

🌐 73 global datasets merged into one (free) population mapping tool
PLUS: a new way to measure the full impact of droughts, a foundation model for describing the Earth, and more.

Hey guys, here’s this week’s edition of the Spatial Edge — a newsletter that’s slightly more reliable than an AWS server… In any case, the aim is to make you a better geospatial data scientist in less than five minutes a week.
In today’s newsletter:
Population Mapping: 73 global datasets merged into one tool.
Drought Impacts: New index captures unseen ecological droughts.
Earth Model: AI generates detailed satellite image captions.
Change Detection: Largest multi-task benchmark for monitoring change.
Irrigation Maps: Global 60 m data on water sources.
Research you should know about
1. 73 global datasets merged into one (free) population mapping tool

A new paper from the WorldPop team introduces something pretty remarkable for us geospatial nerds (let’s call a spade a spade). It’s a massive open dataset to support human population distribution modelling. It’s a collection of 73 standardised global datasets designed to help us figure out where people actually live. The datasets cover everything from building footprints and nighttime lights to rainfall patterns and distance to the nearest road, all harmonised to the same 100 metre grid covering most of the planet. What’s particularly clever is how they’ve combined multiple data sources to fill in gaps. For instance, they’ve taken building data from Google, Microsoft, and several other providers and merged them together, so if one dataset misses a hamlet in the DRC, another might catch it. They’ve done this annually from 2015 to 2023, giving us a time series that can track how settlements expand and change.
The technical achievements here are worth noting. Rather than just creating a single water mask, they’ve produced seven different versions with varying thresholds (from 25% to 90% water coverage per grid cell), which matters enormously for riverside settlements where you need to decide exactly where the water stops and the city begins. They’ve also tackled the persistent problem of volcanoes and gas flares messing up nighttime lights data by developing an outlier removal algorithm that iteratively strips out abnormally bright pixels. And instead of treating all buildings the same, they’ve separated residential from non-residential structures using OpenStreetMap tags, which is pretty important since a warehouse and a housing estate have very different implications for population density.
These harmonised covariates underpin WorldPop’s forthcoming high-resolution global population estimates.
2. A new way to measure the full impact of droughts

A new study published in Scientific Reports tackles a pretty big blind spot in how we measure droughts. While scientists have long tracked meteorological droughts (rainfall deficits), agricultural droughts (crop stress), and hydrological droughts (low river flows), they’ve systematically ignored environmental droughts that directly threaten ecosystems.
Researchers from IIT Kharagpur analysed 42 years of data (1982-2023) from India’s Brahmani River basin using four different drought indices side by side. They used standard measures for the first three drought types, but added a new Environmental Drought Index (EDI) that tracks when river flows drop below what ecosystems need to survive. The EDI essentially asks: is there enough water for fish habitats, riparian vegetation, and other ecological functions? When they compared the period before 2000 with the years after, the results were pretty striking. Severe hydrological droughts nearly doubled in frequency (from 10.5% to 21.7% of events), but environmental droughts showed an even more dramatic shift. Severe environmental droughts surged by 65% and now make up over a third of all environmental drought events.
What’s particularly interesting is how different drought types responded to climate change. Moderate agricultural droughts actually halved (from 100% to 47.8% of events), probably because farmers adapted with drought-resistant crops and better irrigation practices. But ecosystems can’t adapt in the same way. The study found that environmental droughts lasted an average of over 5 months per event, much longer than other drought types. This divergence suggests that while we’ve got reasonably good at protecting crops and managing water supplies during droughts, we’re failing to protect the ecosystems that underpin everything else. The researchers argue that ignoring environmental droughts means we’re missing 40-60% of actual drought impacts, which explains why traditional drought assessments often underestimate the real damage to biodiversity and ecosystem services.
3. A foundation model for describing the Earth
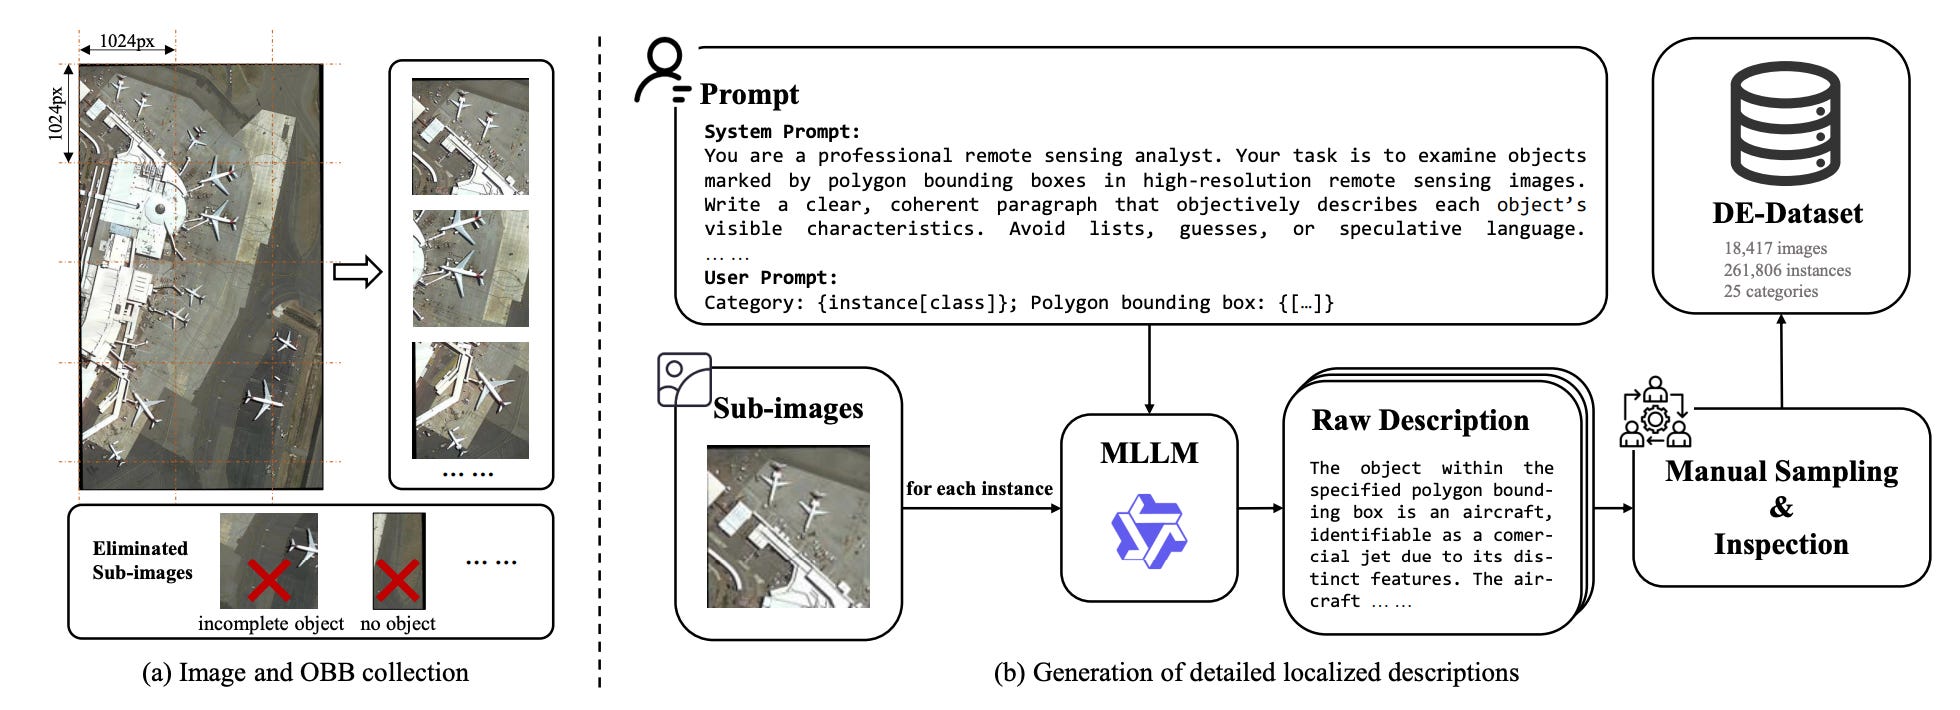
A new paper introduces DescribeEarth, a large multimodal model designed to generate detailed natural language descriptions of objects in satellite images. If you’ve been following this newsletter, you’ll have noticed there seems to be a recent trend towards creating labels for satellite images. While most image captioning models produce short summaries of entire scenes, this approach focuses on Geo-DLC (geographical detailed local captioning): describing specific locations or objects, such as a single airport, dam, or ship. To support this, the authors built DE-Dataset, a large collection of over 260,000 labelled instances, each paired with a fine-grained description averaging around 120 words. The descriptions were created using a mix of multimodal models (like Qwen2.5-VL-32B) and human verification, ensuring both factual accuracy and consistency.
The researchers also designed DE-Benchmark, a new evaluation system. Instead of checking if a generated caption matches a pre-written reference, it scores models based on attributes like colour, structure, context, and factual precision. This evaluation method uses GPT-4.1 as an automated judge, enabling fairer assessments of how well models capture object details and surrounding context in remote sensing imagery.
Finally, DescribeEarth itself combines features from RemoteCLIP (for domain-specific visual understanding) with a new visual fusion strategy that balances high-resolution local detail with global context. It significantly outperforms models like GPT-4o, Gemini 2.5 Pro, and DAM on this benchmark, particularly in categories such as harbours, stadiums, and industrial sites. By merging computer vision and language modelling at the object level, the study is trying to push remote sensing beyond detection into explanation.
Geospatial Datasets
1. Multi-task benchmark for remote sensing
The ChangeIMTI dataset introduces the largest interactive multi-task benchmark for remote sensing change monitoring to date, covering 89,628 samples across change captioning, binary change classification, object counting, and spatial localisation.
2. Global irrigation water source dataset

This global dataset provides 60-metre resolution maps showing whether croplands are rainfed or irrigated. And if irrigated, it shows whether the water source is groundwater or surface water. You can access the data here and the code here.
3. Seismic resilience dataset

This dataset maps the seismic resilience of urban road networks in Turin and Naples, Italy. It does this by integrating data on roads, bridges, buildings, and landslides. You can access the data here.
Other useful bits
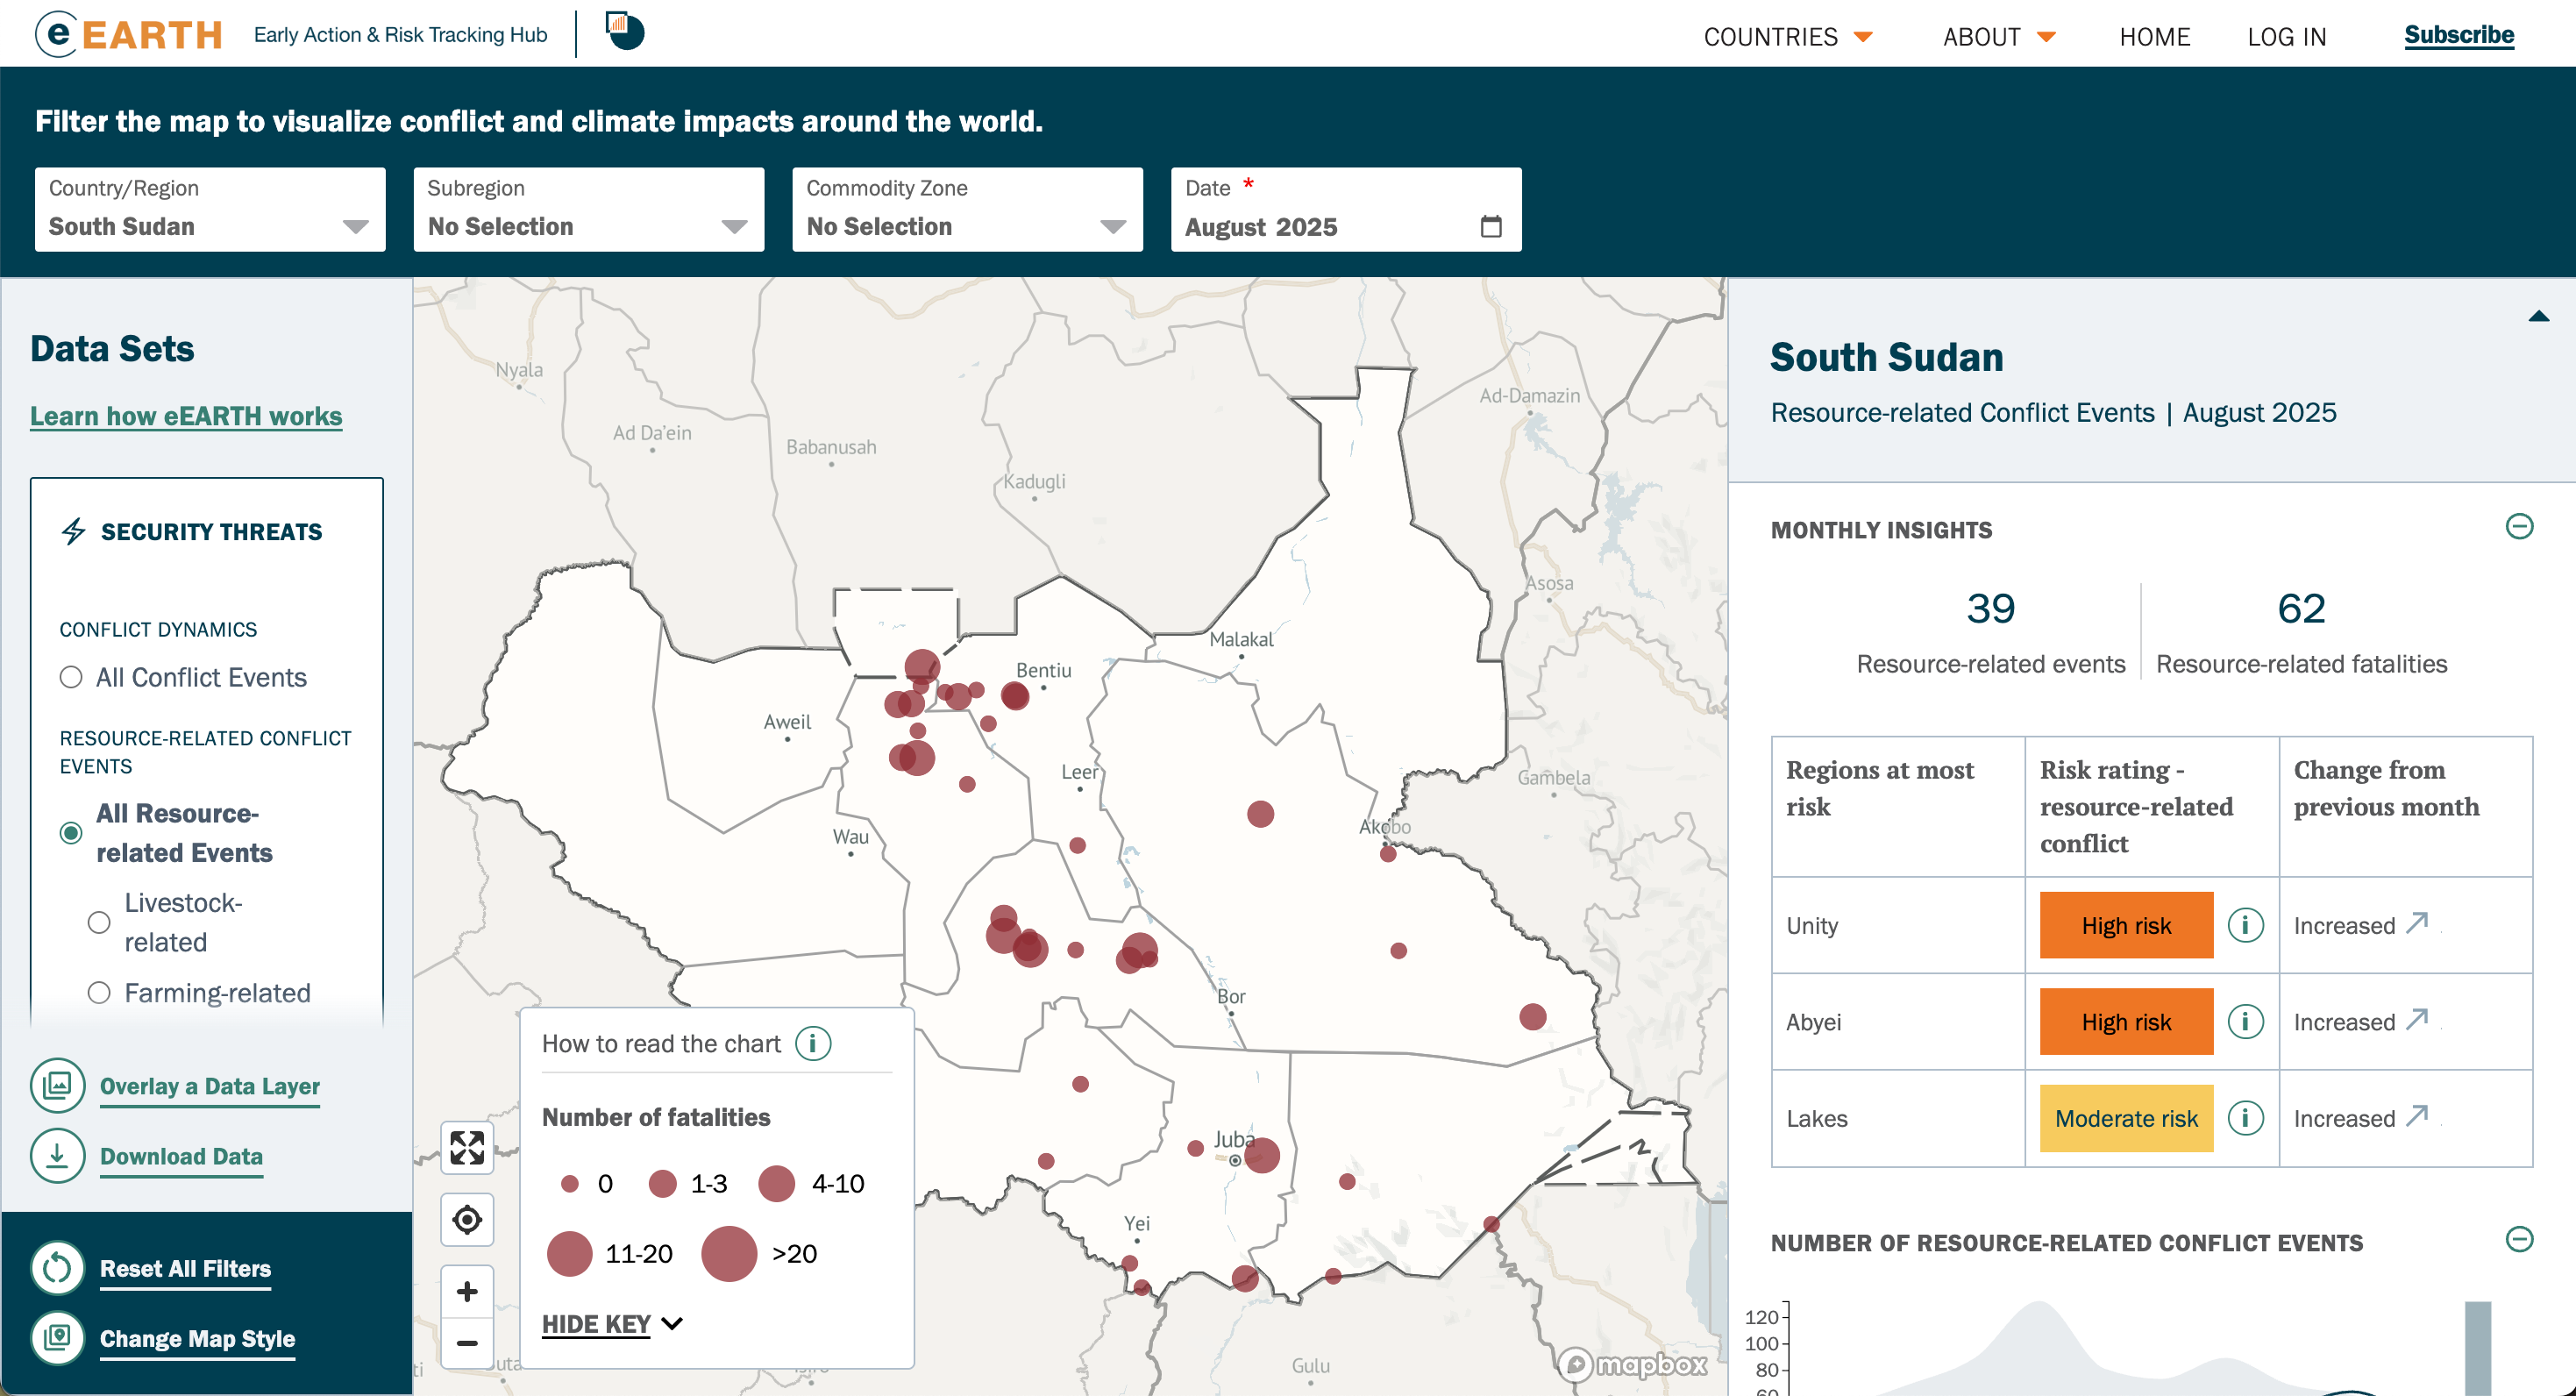
The International Crisis Group’s eEARTH platform combines climate, conflict, displacement, and food security data into one intuitive hub. With map-based visuals, monthly updates, and built-in forecasts, it helps decision-makers cut through data overload to spot risks and act early
The Risk Data Hub has launched two new tools: the Disaster Loss Dashboard and Event Explorer. These make Europe’s disaster data more accessible and interactive. They let users explore past events, visualise losses, and drill down to detailed impacts across all NUTS levels.
InstaGeo is a new open-source framework from InstaDeep that aims to make geospatial machine learning faster and more efficient. By automating data prep and creating lightweight versions of large geospatial models, it cuts computing costs and emissions while maintaining strong accuracy.

Esri’s new book GeoAI: Artificial Intelligence in GIS showcases how AI-powered spatial analysis is transforming decision-making for NGOs, governments and the like. It’s a pretty interesting read for those of you who like the intersection of geospatial analysis and international development.

Jobs
UNICEF is looking for a remote Climate Data Consultant under their Data and Analytics Section based in the US.
The UN Office for Outer Space Affairs is looking for an Intern for Earth Observation for Water Management based in Vienna.
The Nature Conservancy is looking for a Forest Spatial Scientist based in Montana.
Humanitarian OpenStreetMap is looking for a remote Product Marketing Manager.
Just for Fun

We often see images of national-level GDP growth, but here’s an image of sub-national GDP growth from 2000–2019. It’s from a new paper by Andrés Rodriguez-Pose.
That’s it for this week.
I’m always keen to hear from you, so please let me know if you have:
new geospatial datasets
newly published papers
geospatial job opportunities
and I’ll do my best to showcase them here.
Yohan
This article comes at the perfect time! I really appreciate how you highlighted combining multiple data sources to fill in gaps. Its such smart data engineering, making this tool so robust. Brilliant work!