

🌐 A much better way to map human development
PLUS: Predicting flood damage without training models from scratch

Hey guys, here’s this week’s edition of the Spatial Edge — a safe space for Terra and exactextract enthusiasts... In any case, the aim is to make you a better geospatial data scientist in less than five minutes a week.
In today’s newsletter:
Human Development: Satellites map local development levels.
Flood Prediction: LLMs estimate damage without training.
Ecological Mapping: Testing foundation models on ecosystems.
Urban Inequality: Satellites reveal China’s built disparities.
Hyperspectral Data: Planet expands its open dataset.
Research you should know about
1. A much better way to map human development

For years, the UN’s Human Development Index (HDI) has been the gold standard for measuring a country’s wellbeing, factoring in health, education and income. The problem is that HDI data is generally only available at the national or, at best, provincial level. This makes it almost useless for local policy decisions, like deciding which specific neighbourhoods need a new clinic or school. A new paper from Nature Communications used satellite imagery and machine learning to produce the first high-resolution global map of HDI, estimating development levels for over 60,000 municipalities and a 10km-by-10km grid worldwide.
The team achieved this using an approach called MOSAIKS, which translates satellite imagery into a set of random convolutional features. Rather than trying to map irregularly shaped provinces directly, the model learns the relationship between the visual features of an area (like building density, road networks and nighttime lights) and its known HDI. Because this relationship is linear, they can train the model on coarse provincial data and then “downscale” it to predict HDI for much smaller areas based purely on what the satellites see. They validated this by testing it against ground-truth municipal census data in Mexico, Brazil and Indonesia, proving the model could accurately spot local variations.
The results expose a massive flaw in how we currently look at development. The researchers found that if you only use provincial data, more than half of the global population is assigned to the wrong HDI quintile within their country due to “aggregation bias”. It essentially lumps rich urban centres and poor rural outskirts into a single misleading average. By contrast, this new high-resolution data allows policymakers to target aid far more accurately. In a simulated test in Mexico, using municipal data rather than provincial data increased the accuracy of targeting aid to the poorest 10 per cent of the population by over 11 percentage points.
You can access the code here.
2. Predicting flood damage without training models from scratch
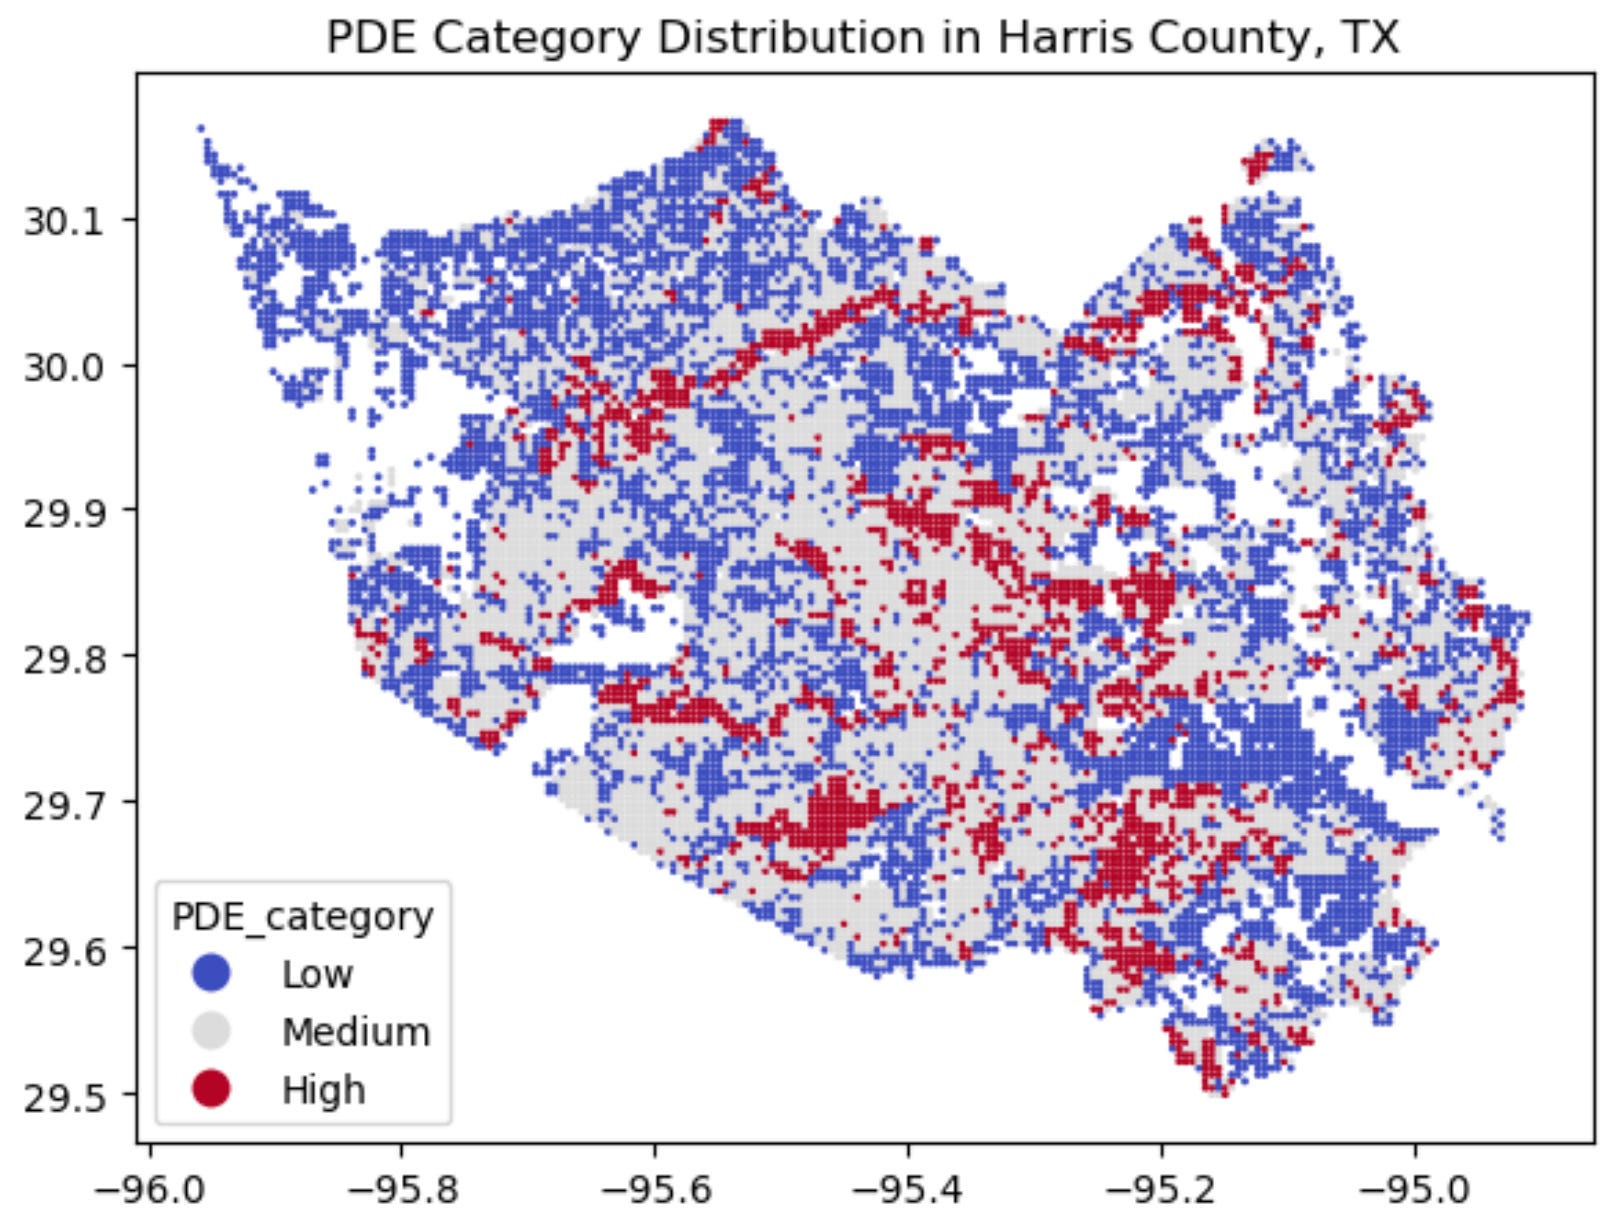
Predicting property damage immediately after a flood usually involves training complex machine learning models on highly specific regional data. This requires an immense amount of upstream effort to assemble datasets, engineer features and handle skewed data where extreme damage cases are rare. To bypass this bottleneck, a new study has introduced R2RAG-Flood, a new framework that uses LLMs to predict post-storm Property Damage Extent (PDE) without requiring any task-specific training or fine-tuning.
Instead of fitting new parameters, the framework uses Retrieval-Augmented Generation (RAG). It takes historical tabular data about flood events (like rainfall, elevation and building density) and converts it into concise text summaries paired with logical “reasoning trajectories.” When a new storm hits, the system looks at a specific target area and searches its knowledge base for similar historical cases nearby (geospatial neighbours) and typical examples of different damage levels (prototypes). It feeds these examples to an LLM, asking it to emulate the reasoning process to classify the new target into low, medium or high damage.
The team tested this approach on data from Hurricane Harvey in Harris County, Texas. While a traditional supervised model achieved 0.714 overall accuracy, the training-free R2RAG-Flood approach was highly competitive, hitting up to 0.668 accuracy depending on the LLM backbone used. More importantly, the RAG approach outputs a structured, human-readable rationale explaining exactly why it predicted a certain level of damage. When factoring in the cost of API calls versus the computing power needed to train a model from scratch, the lightweight LLM variants proved significantly more cost-efficient, offering a scalable way to rapidly assess flood impacts in new regions without heavy computational overhead.
3. Putting AI foundation models to the ultimate ecological test
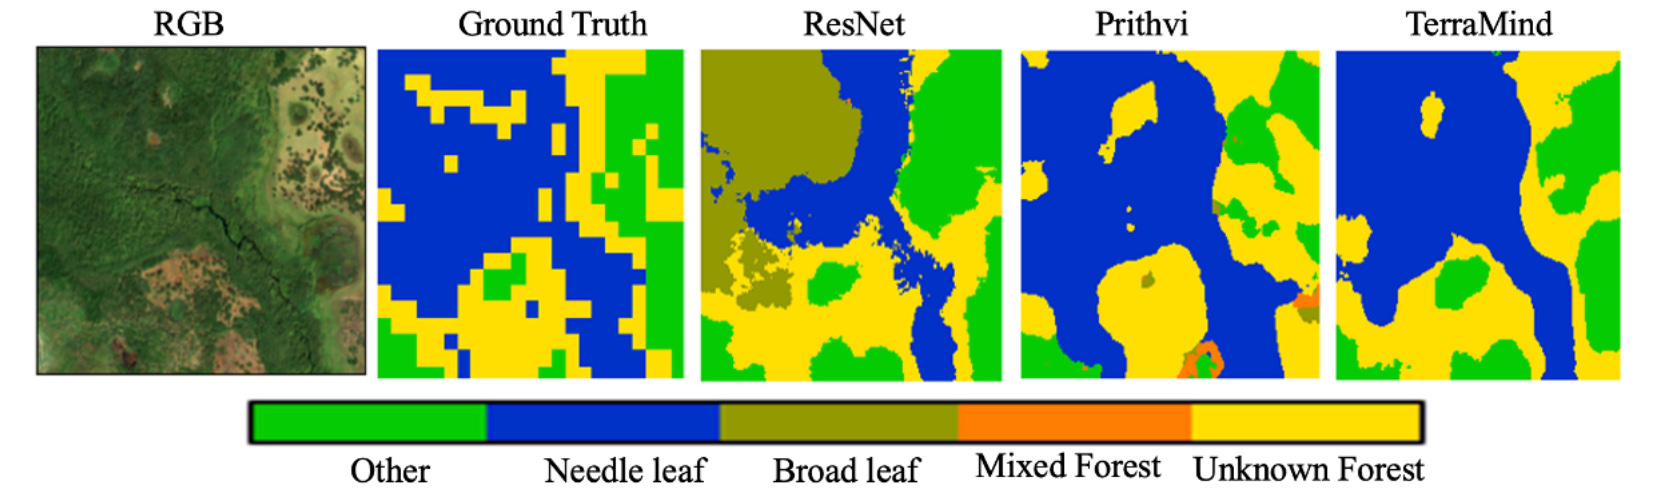
Geospatial Foundation Models (GFMs) are, of course, all the rage for earth observation, but mapping complex ecosystems is a whole different beast compared to drawing basic land cover maps. To see if these models actually live up to the hype, researchers put two leading GFMs (Prithvi-EO-2.0 and TerraMind) to the test against a standard deep learning baseline. They wanted to find out if these systems could handle highly specialised jobs like estimating forest canopy density across the United States and tracking the extent of carbon-rich peatlands in Patagonia.
The results were pretty clear: both GFMs comfortably beat the standard baseline model across all the ecological tasks. By being pre-trained on massive amounts of satellite data, these models avoided the usual pitfalls of standard image classifiers and adapted much better to geospatial nuances. TerraMind slightly outperformed Prithvi on basic tasks, but it really pulled ahead when the researchers fed it multimodal inputs. By combining standard optical imagery with radar and elevation data, the model became much better at separating tricky vegetation types, like distinguishing vital peat moss from generic grass.
Despite the impressive performance, the study highlighted some pretty big roadblocks before we can completely hand ecological mapping over to AI. For one, these models are highly sensitive to the quality of the training labels. When the researchers used coarse, off-the-shelf datasets to teach the models, the AI struggled to draw accurate boundaries, proving that you still need high-fidelity, expert-verified field data. Furthermore, the standard 10-metre resolution of satellite inputs proved to be a major limitation for capturing fine-scale ecological changes. So while these foundation models are a massive leap forward, they still need sharper data and better ground truths to truly map out the complexities of the natural world.
4. Satellite mapping reveals deep built environment disparities in urban China

China’s cities have grown at a breakneck pace over the last few decades, but figuring out exactly how equitable this growth has been at the street level is notoriously difficult due to a lack of building-level data. To tackle this, a team of researchers just released SinoBF-1, a massive national map that categorises the specific function of 110 million individual buildings across 109 major Chinese cities. By combining 1-metre high-resolution satellite imagery with other multi-modal data, they essentially built a microscopic view of the country’s urban landscape to track exactly where resources are concentrated.
Using nine distinct indicators covering everything from facility accessibility to infrastructure sufficiency, the study reveals some pretty big disparities across different regions and city tiers. Unsurprisingly, top-tier megacities dominate when it comes to amenity diversity and access to services, with these perks dropping off a cliff as you move down to lower-tier cities. However, the data shows that mid-tier cities actually offer the most equitable housing allocation. Geographically, southern cities boast the best access to healthcare and education, but this comes at the cost of severe infrastructure overcrowding compared to other regions.
Zooming in on individual cities, the map also highlights a growing divide between old and new neighbourhoods. The researchers found that newer, recently expanded zones on the outskirts of cities suffer from much greater built environment disparities than the early-established urban cores. This spatial footprint serves as a physical ledger of national development policies over the past half century, offering a highly detailed framework for tracking urban inequality in rapidly developing areas.
Geospatial Datasets
1. Open hyperspectral satellite dataset
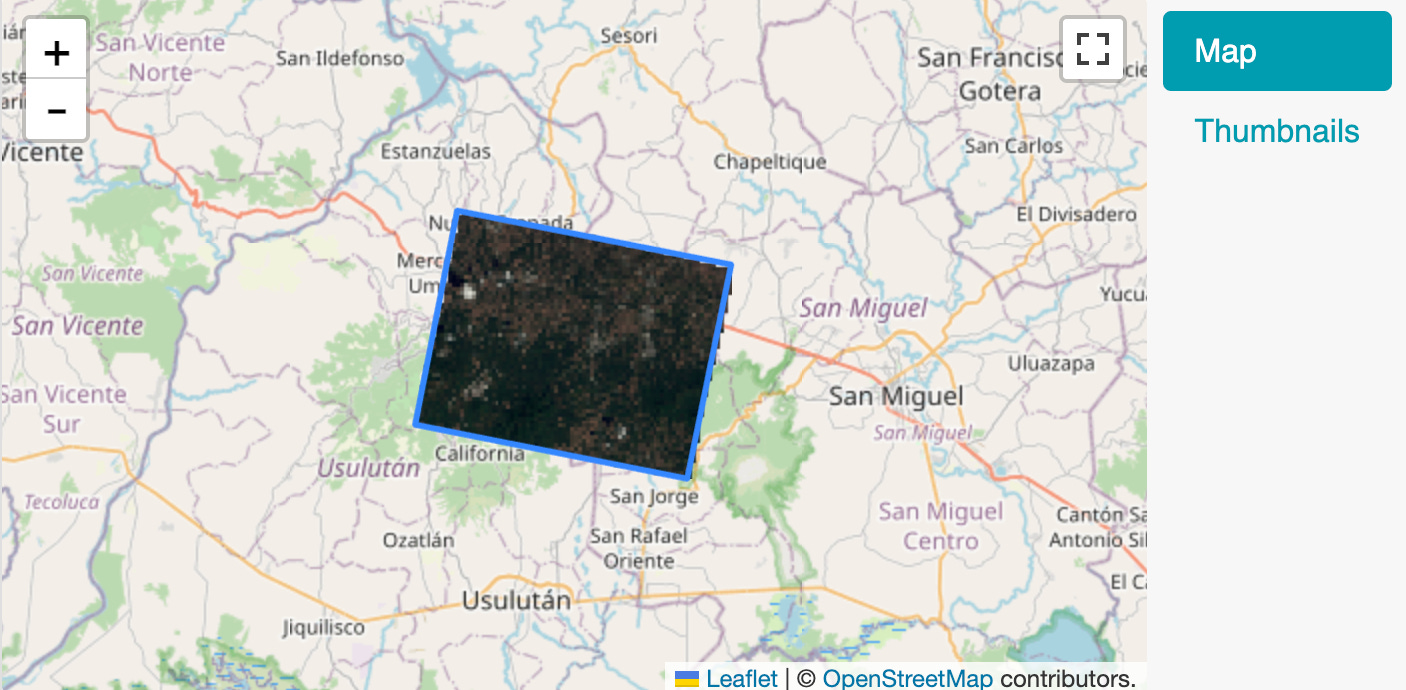
Planet has recently expanded its Open STAC Catalog with nearly 100 new hyperspectral scenes, offering an impressive global footprint for geospatial exploration. You can access the data here.
2. Tile-drainage and Rotation-Enhanced Cropland (TREC) dataset

The newly developed Tile-drainage and Rotation-Enhanced Cropland (TREC) dataset significantly improves the spatial accuracy of ecohydrological models across the Conterminous United States. You can access the data here and the code here.
3. High-resolution global precipitation dataset

The newly updated PERSIANN-CCS-CDR Version 2.0 offers a remarkable high-resolution global precipitation climate record, boasting a 0.04° spatial and 3-hourly temporal resolution. You can access the data here and the code here.
4. Global water storage anomaly dataset

The newly released ML-TWiX dataset is a brilliant resource that extends our understanding of global total water storage anomalies back to 1980, well before the launch of the GRACE satellite missions. You can access the data and code here.
Other useful bits
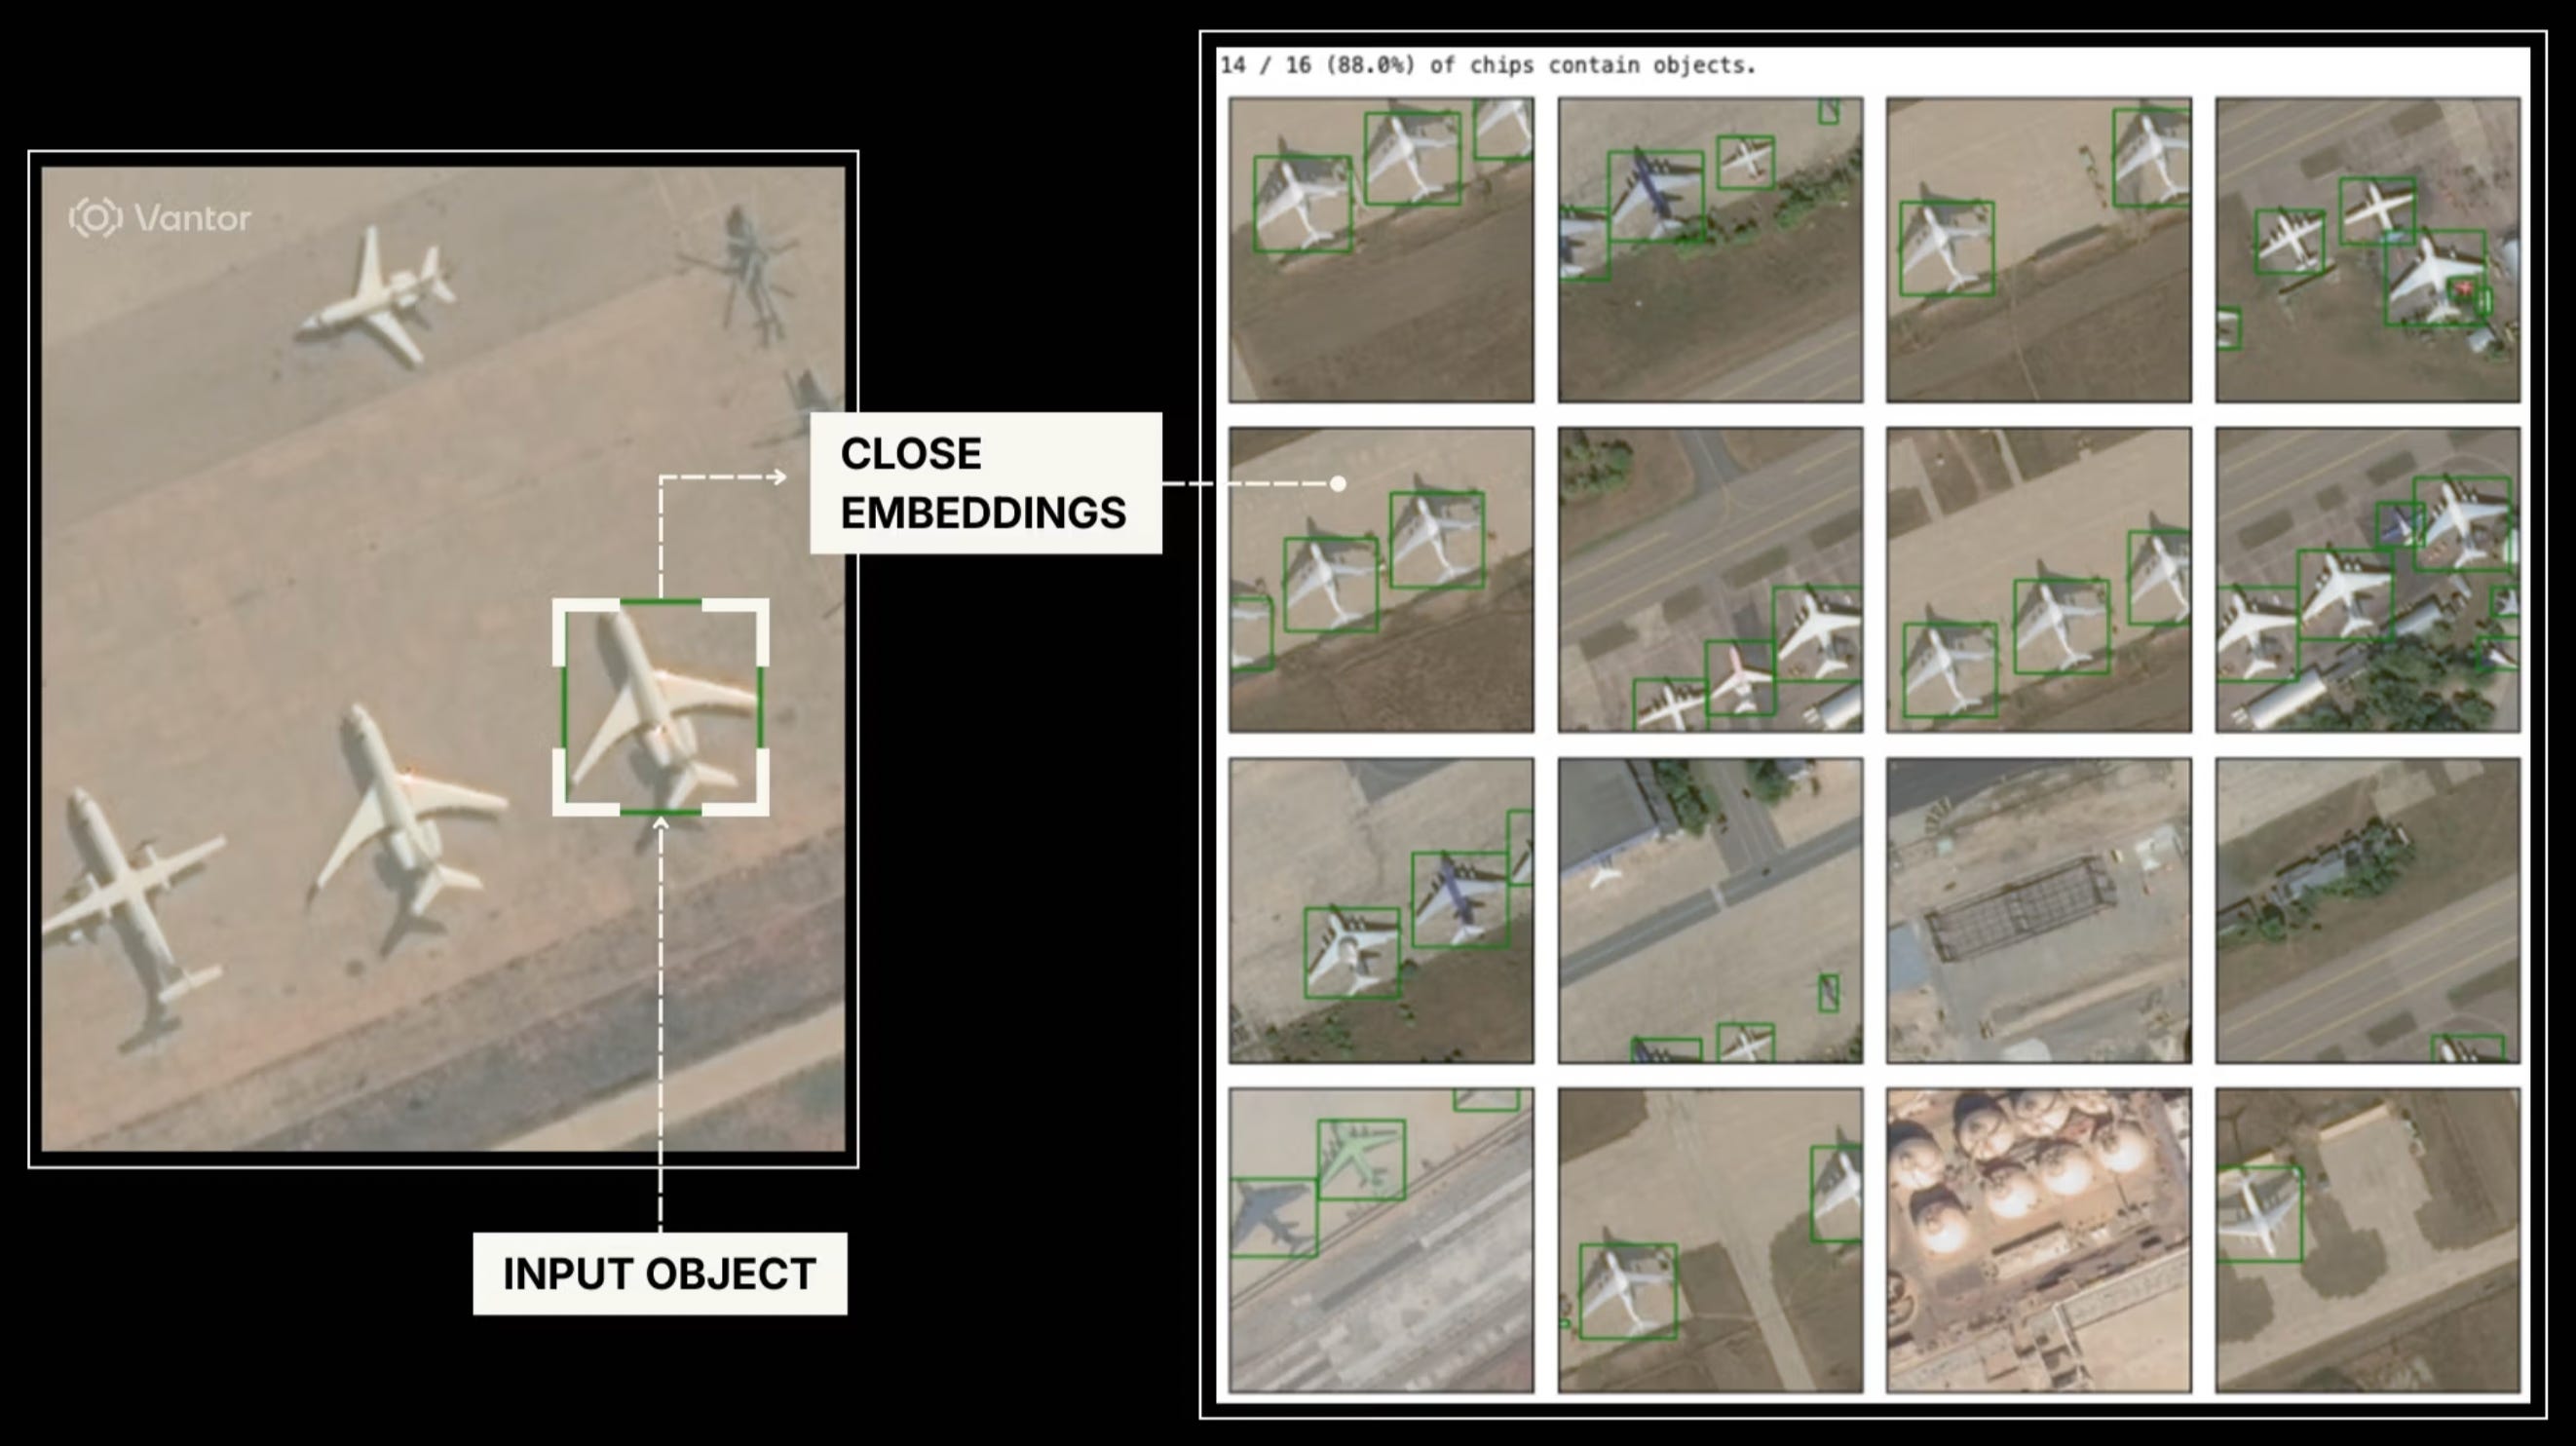
Vantor has cleverly teamed up with Google to integrate powerful Earth AI imagery models into its Tensorglobe platform, allowing these tools to be used in secure, air-gapped environments for the very first time. By combining cutting-edge AI with a massive archive of high-resolution satellite imagery, it offers a brilliant new way to effortlessly monitor infrastructure and track changes offline.
To tackle AI's struggle with 'spatial grammar', researchers have built MapTrace, a new pipeline that generates millions of synthetic map-path pairs for training. This approach has already given models a massive boost in accurately tracing paths on real-world maps, proving just how useful synthetic data can be.
A developer has cleverly forked Apple’s Embedding Atlas to create Geospatial Atlas, a new open-source tool for exploring massive datasets of up to 100 million points right in your web browser. It brings together tools like WebGPU, DuckDB, and MapLibre. This essentially provides a smooth and interactive way to visualise huge amounts of spatial data without needing heavyweight desktop software.
A new AI methodology called Groundsource has just been unveiled, turning millions of public reports into a massive historical dataset for predicting urban flash floods. By mapping these events using Gemini and Google Maps, a new model can now forecast sudden flooding up to 24 hours in advance, offering a vital lifeline to communities worldwide.
Jobs
ESA is looking for two EO Data Architect and AI Experts based in Frascati for their (1) Copernicus Ground Segment Systems Section and (2) Ecosystem Development Section.
Development Seed is looking for a Technical Project Lead based in the US who will work across their NASA portfolio.
The European Organization for Nuclear Research (CERN) is looking for GIS Specialist and Developer based in Geneva.
Médecins Sans Frontières (Doctors Without Borders) is looking for a GIS Data Governance Specialist based in Geneva.
The Center for International Forestry Research (CIFOR) is looking for a Spatial Data Scientist for Machine Learning & Remote Sensing who will be based in either Kenya, Nairobi or remote.
Just for Fun
Researchers at NOAA have shared a rather striking animation of high winds over the Great Lakes, created using their experimental RRFS weather model. It provides a brilliant demonstration of DESI, a clever tool designed to help forecasters effortlessly explore, compare, and share ensemble weather guidance.
That’s it for this week.
I’m always keen to hear from you, so please let me know if you have:
new geospatial datasets
newly published papers
geospatial job opportunities
and I’ll do my best to showcase them here.
Yohan