

🌐 A new (free) tool for mapping war destruction
PLUS: How accurate are population datasets, foundation models for generating 3D images and more.


Hey guys, here’s this week’s edition of the Spatial Edge — a weekly round-up of geospatial news. It’s Rhianna’s favourite geospatial newsletter (mainly because it makes her a better geospatial data scientist in less than 5 minutes a week).
In today’s newsletter:
War Damage: A free tool maps destruction in Ukraine.
Geospatial population datasets: Global datasets miss rural communities.
Scene Classification: MEET offers million-scale image labels.
Forest Data: OpenForest catalogues 86 forest datasets.
3D Geospatial Foundation models: Create 3D images instantly
Research you should know about
1. A free tool for mapping war destruction

Let’s face it. It hasn’t been a great period in terms of wars. And when wars break out, humanitarian agencies, governments and development organisations need to know which places have been impacted, and the extent of the impact.
Obviously, it’s tough to do this by deploying human surveyors to unsafe areas. So instead, these organisations are turning to earth observation data.
One of the most popular ways of doing this involves using SAR (a topic we’ve covered numerous times on here). In a nutshell, SAR sends out microwave signals and measures how they bounce back. Because of this, SAR can “see” through clouds and works even at night.

There are two main ways to use SAR for detecting change:
Incoherent methods: Only use how strong the signal is (amplitude), similar to comparing brightness in two photos.
Coherent methods: Use both the strength and the timing (phase) of the signal. This allows you to detect much smaller changes, even below the image’s pixel size, using techniques like Interferometric SAR (InSAR).
The downside of coherent methods is that they require more complex data and processing.
Therefore, a new study published in Communications Earth & Environment presents a method of estimating large-scale building destruction using amplitude-based methods. On top of this, they’ve created a free, open-source tool to detect war-related building damage. I’ve had a lot of fun playing around with it.
The main datasets used were:
Reference damage data (UNOSAT)
The UNOSAT maps are the only public source that gives geolocated building-level damage data for Ukraine.
SAR time series (Sentinel-1)
Building footprints (from Overture maps)
They then used a random forest model to predict whether a building is likely to have been damaged in a specific time period.
For each location, the model uses two time series of radar backscatter from Sentinel-1 SAR data:
one from a fixed pre-invasion reference year (2020) and
one from a 3-month assessment window between 2021 and 2024.
Each time series includes two radar signal types (VV and VH), and is summarized using basic statistics like mean, standard deviation, skewness, and kurtosis, which essentially describe how the signal behaves over time.
These summaries form the input features for the model. To train the model, UNOSAT damage labels were used: each point UNOSAT had marked as “destroyed” or “severely damaged” was matched to its corresponding time series, and labeled as either damaged (1) or undamaged (0) depending on when the damage was reported. This allowed the model to learn how war-related damage shows up in radar signal patterns over time.

The results were pretty compelling:
F1-score (74.9%): A balanced measure that considers both how many damaged buildings the model correctly finds and how many it misses or wrongly flags.
AUC (81.3%): This shows how well the model separates damaged from undamaged buildings across all thresholds—a higher score means better overall performance.
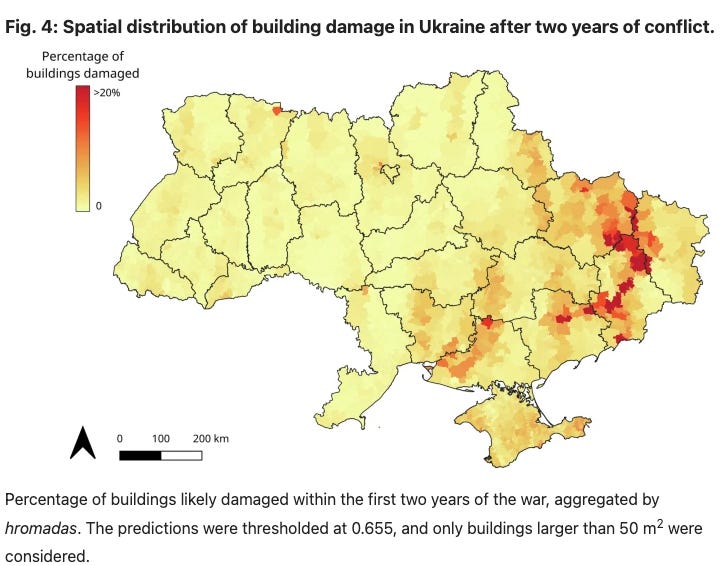
They found that around 2.7% of Ukraine’s buildings were likely damaged in the first two years of the conflict, with particularly high rates in heavily contested areas. All in all, I’m sure this will be a valuable tool for policymakers working in this space.
You can access the code here.
2. How population data underestimate rural communities

As frequent readers may know, I’m quite interested in better understanding how geospatial datasets, which are supposed to measure the same thing, actually end up diverging from each other. Frustratingly, this is a pretty common occurrence.
A new paper in Nature Communications looks at how five widely used gridded population datasets (GWP, GRUMP, GHS-POP, LandScan, and WorldPop) measure rural populations. The researchers collected reported human resettlement numbers from 307 dam construction projects in 35 countries, then compared those on-the-ground counts with what these global datasets predict in the corresponding reservoir areas. They found a consistent underestimation of rural populations, with even the “best” dataset off by about 50%. This negative bias could be due to limited census coverage in remote areas and calibration techniques that lean toward better-reported, often urban, locations.
Underestimating rural populations can have big consequences.
Allocations for disaster relief or infrastructure improvements could be too small if planners rely on these datasets alone, which may place people in rural areas at a disadvantage.
Unfortunately, there aren’t great solutions out there except for promoting better on-the-ground data collection in rural regions. But I don’t see any quick wins here.
In any case, this is an important lesson for those of us who use these datasets for capturing population in rural areas.
You can access the code here.
Geospatial Datasets
1. Remote sensing scene classification dataset

MEET is a million-scale dataset built to advance fine-grained geospatial scene classification using zoom-free remote sensing imagery. It contains over 1.03 million samples across 80 scene types. You can access the code here.
2. Forest monitoring data catalogue

OpenForest is a catalogue of 86 open-access forest datasets, covering everything from tree inventories to satellite imagery. You can access the data here.
3. Geospatial question answering dataset

MapQA is a new dataset for answering natural language questions grounded in geospatial data. It includes 3,154 question–answer pairs across nine reasoning types like proximity, route planning, and containment. I suppose it’ll be useful for incorporating geospatial analyses into LLMs. You can access the data here.
Other useful bits
Google’s new codelab walks you through building your first 3D map using the Maps JavaScript API — all in just 30 minutes. You’ll start simple and get tips for adding points of interest, routes, and boundary controls.
FoundationStereo is a new foundation model for stereo depth estimation: zero-shot, high-accuracy, and now top of the Middlebury + ETH3D leaderboards. It outperforms traditional RGBD cameras and comes with a 1M-sample synthetic dataset from NVIDIA Omniverse. Check out the paper here and the code here.

Skylight just made a big leap in the fight against illegal fishing. Their latest AI model now detects fishing activity in real time (down from a 6-hour delay), giving conservationists and enforcement agencies a huge boost in response speed. It’s powered by billions of AIS messages and near 80% accuracy.
ESA has launched the Space HPC, a new high-performance computing hub to boost research, development, and innovation in Europe’s space sector.** Based at ESRIN in Italy, this powerful system will support ESA programmes, researchers, and SMEs with simulations, AI modelling, and data analysis. Also props for running sustainably on solar power.
Sentinel-2A has resumed imaging for a 12-month campaign. Alongside Sentinel-2B and 2C, this means at least three overpasses every 10 days over several areas, including Europe and some cloud-prone tropical regions. I’m so pumped for this.

Jobs
The Environmental Defense Fund (EDF) is looking for a remote Geospatial Analyst for their Remote Sensing Team, who can be based in Germany, the Netherlands, or in the UK.
The International Criminal Court (ICC) is looking for a short-term Associate Forensic Geospatial Developer in the Hague to support their Information Fusion Centre.
Conservation International is looking for a Climate and Land Use Data Scientist in Eastern Cape to support the implementation of the Climate Positive Land Use Strategy in its Umzimvubu Demonstration Landscape.
World Bank is looking for a Data Scientist under their Trade Unit (ETIRI) in Washington.
UN-Habitat is looking for an Urban Data/GIS Expert as part of its Ukraine Urban Lab in Kyiv.
Just for Fun

Satellites are giving us a bird’s-eye view of clean energy in action. Solar and wind farms are popping up fast across the globe. This NYT piece goes into the details.
That’s it for this week.
I’m always keen to hear from you, so please let me know if you have:
new geospatial datasets
newly published papers
geospatial job opportunities
and I’ll do my best to showcase them here.
Yohan