


Hey guys, here’s this week’s edition of the Spatial Edge — we put the ‘special’ in geospecial data science… As usual, the aim is to make you a better geospatial data scientist in less than five minutes a week.
In today’s newsletter:
Urban Food Security: Graph AI optimises hydroponic nutrient dosing.
Crop Yield Prediction: Interpretable deep learning improves harvest forecasts.
European Mobility: Seven mobility types reshape regional policy.
Forest Height Mapping: Radar and optical data improve accuracy.
Macroeconomic Data: Global statistics spanning nearly a millennium.
Research you should know about
1. A graph-based approach to urban food security
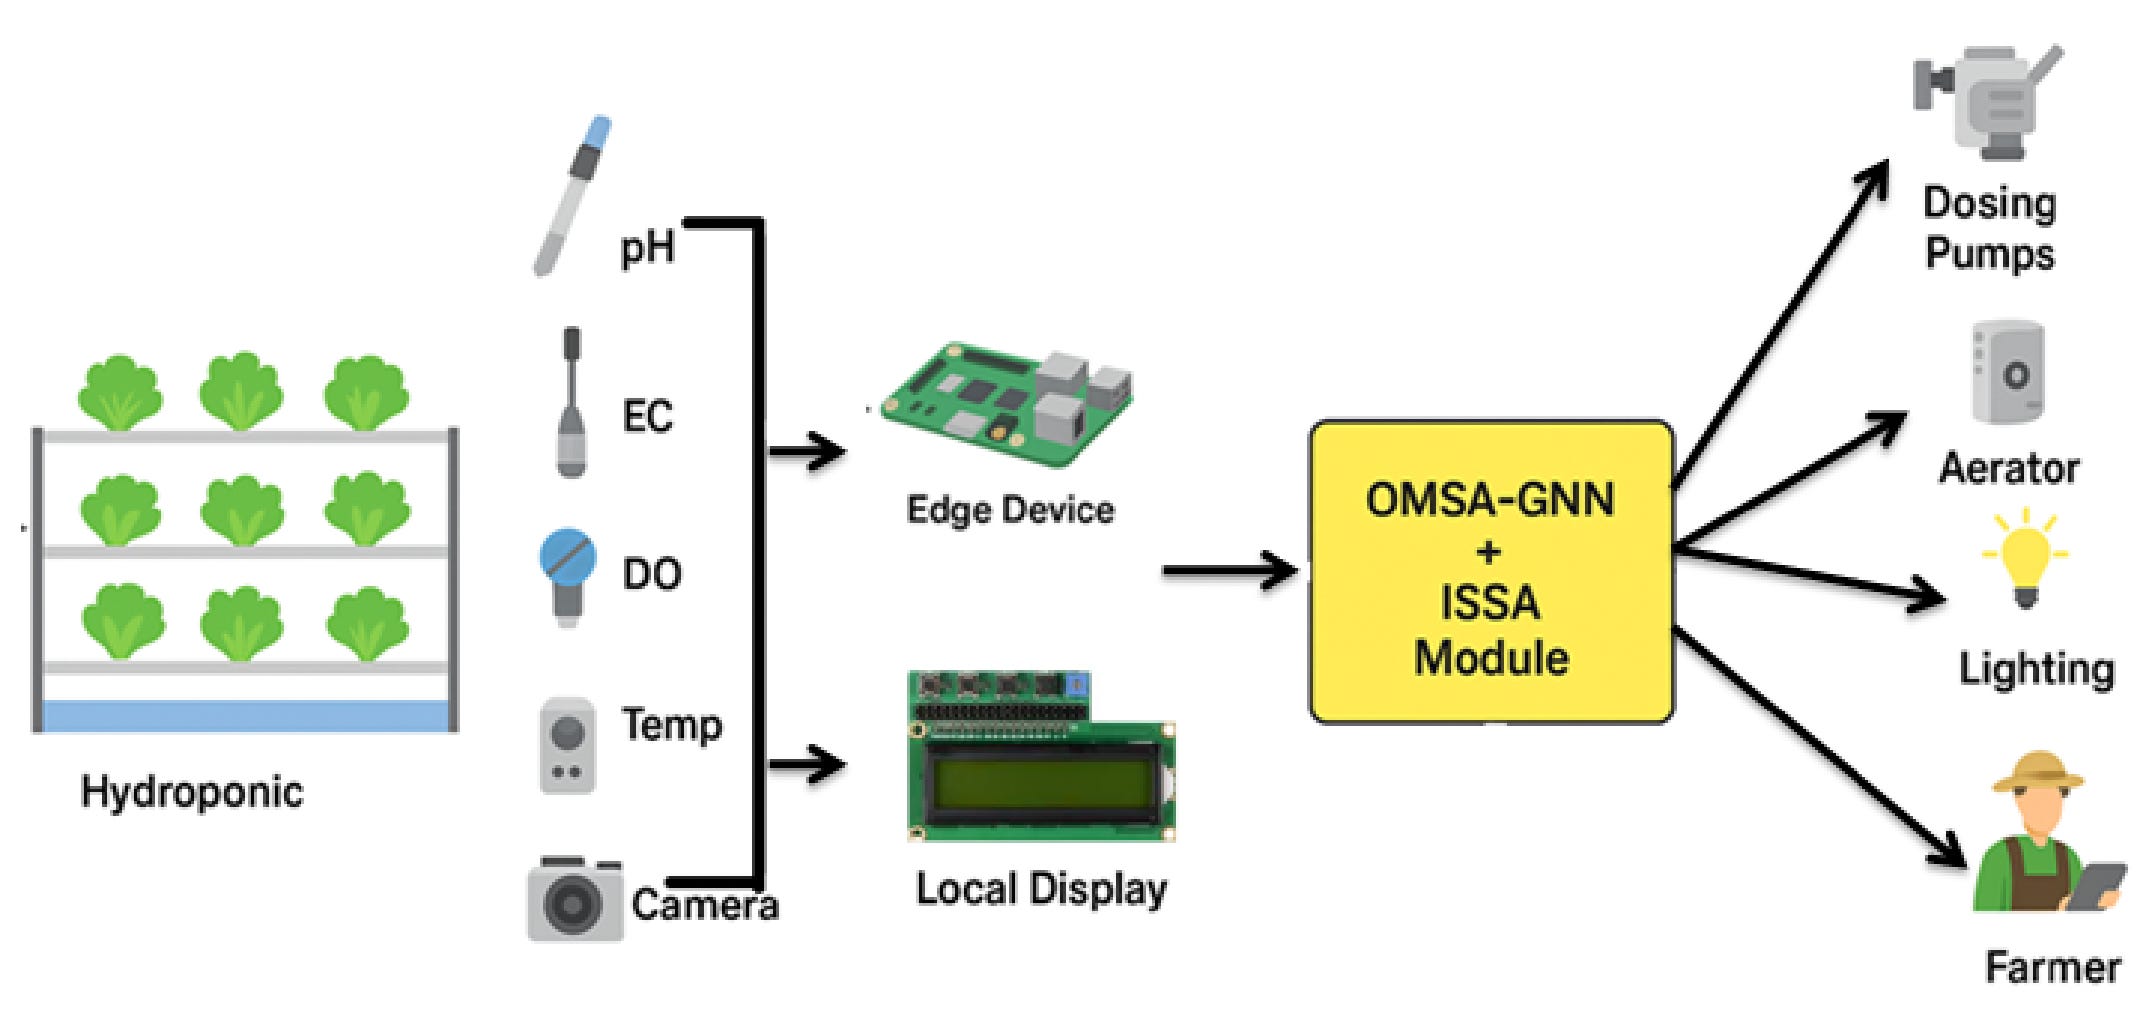
As anyone who’s read the news knows, traditional soil-based agriculture is increasingly vulnerable to various issues like extreme weather, soil degradation, and water shortages. Taken together, this leads to a rise in global food insecurity. In response, ‘soilless’ (or is it ‘soil-free’?) methods like hydroponics and aeroponics are gaining popularity for urban food production. However, these controlled-environment systems rely on precise, real-time nutrient dosing. Current systems often use rigid/static dosing rules that don’t really account for the complex, non-linear interactions between dynamic environmental conditions (e.g. temperature or humidity) and a plant’s physiological response. This inflexibility can essentially lead to nutrient waste and increased crop stress.
A new study from Scientific Reports addresses this by introducing the Optimised Multi-Scale Adaptive Graph Neural Network (OMSA-GNN). The framework uses a Raspberry Pi-based network of sensors to monitor conditions like pH, dissolved oxygen, electrical conductivity, and visual plant health. Rather than treating these as isolated metrics, the system treats them as localised geospatial data points. The OMSA-GNN model, fine-tuned by an Improved Sparrow Search Algorithm (ISSA), builds adaptive graphs to map the relationships between these variables, allowing it to predict plant stress and adjust nutrient dosing vectors dynamically.
When evaluated on a dataset of hydroponic lettuce growth, the OMSA-GNN framework outperformed the older, more traditional static models, as well as several other neural network architectures, in both forecasting accuracy and nutrient efficiency. By treating individual sensor nodes as micro-spatial intelligence units, the model was able to detect early signs of physiological stress and automatically adjust the nutrient mix, reducing waste and stabilising yields. This approach offers a highly adaptable, data-driven solution for securing urban food systems against the unpredictability of climate-stressed environments.
You can access the dataset here.
2. An interpretable deep learning model for crop yield prediction
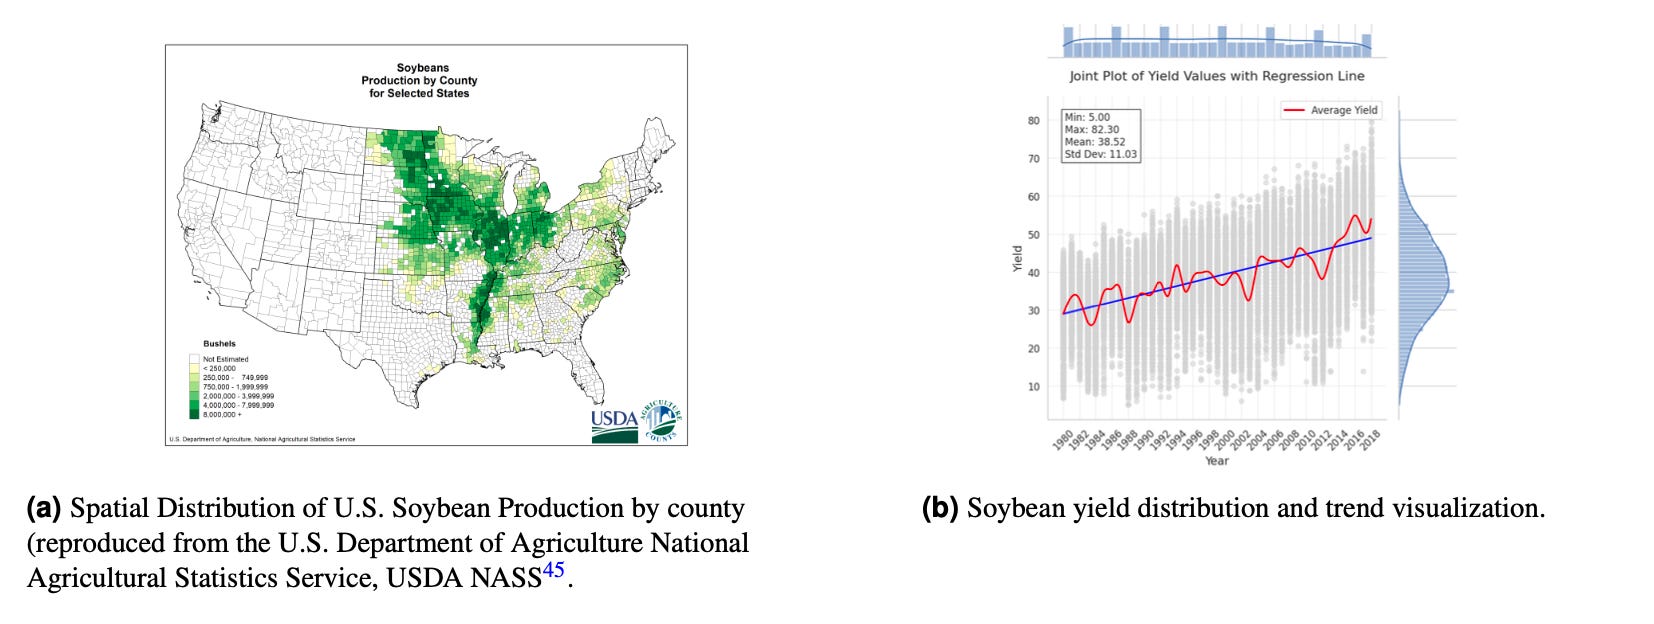
Accurate crop yield prediction is pretty important for global food security and smart agriculture, but it’s a notoriously difficult problem. Agricultural yields are determined by a complex mix of weather, soil, and management practices that all interact over time. Deep learning models have shown promise in this area, but they do struggle with “gradient instability” in the face of early-season weather anomalies (like a spring drought). I.e. these events lose their impact in the model’s memory by the time it predicts the final harvest.
To tackle this, a new paper from Scientific Reports introduces the MHCNN-LSTM-MHA model, a hybrid architecture that tackles agricultural data in a highly structured way. Rather than mixing weather and soil data together at the start, the model uses parallel Multihead Convolutional Neural Networks (MHCNN) to process them separately, preserving their unique characteristics. This data is then fed into a Long Short-Term Memory (LSTM) network to track temporal changes across the growing season. Finally, a Multi-Head Attention (MHA) mechanism acts as the model’s focus, dynamically prioritising specific time steps to ensure critical events aren’t lost.
When tested on a comprehensive 39-year dataset of US soybean yields, the proposed model achieved an impressive 9.86% improvement over the previous best benchmark. They conducted a SHAP analysis and confirmed that the model’s logic aligned with established agronomic principles, heavily weighting factors like solar radiation, maximum temperature, and precipitation. The conclusion, according to the authors, then is this might be more reliable or ‘trustworthy’ than other approaches.
3. Rethinking spatial mobility across Europe
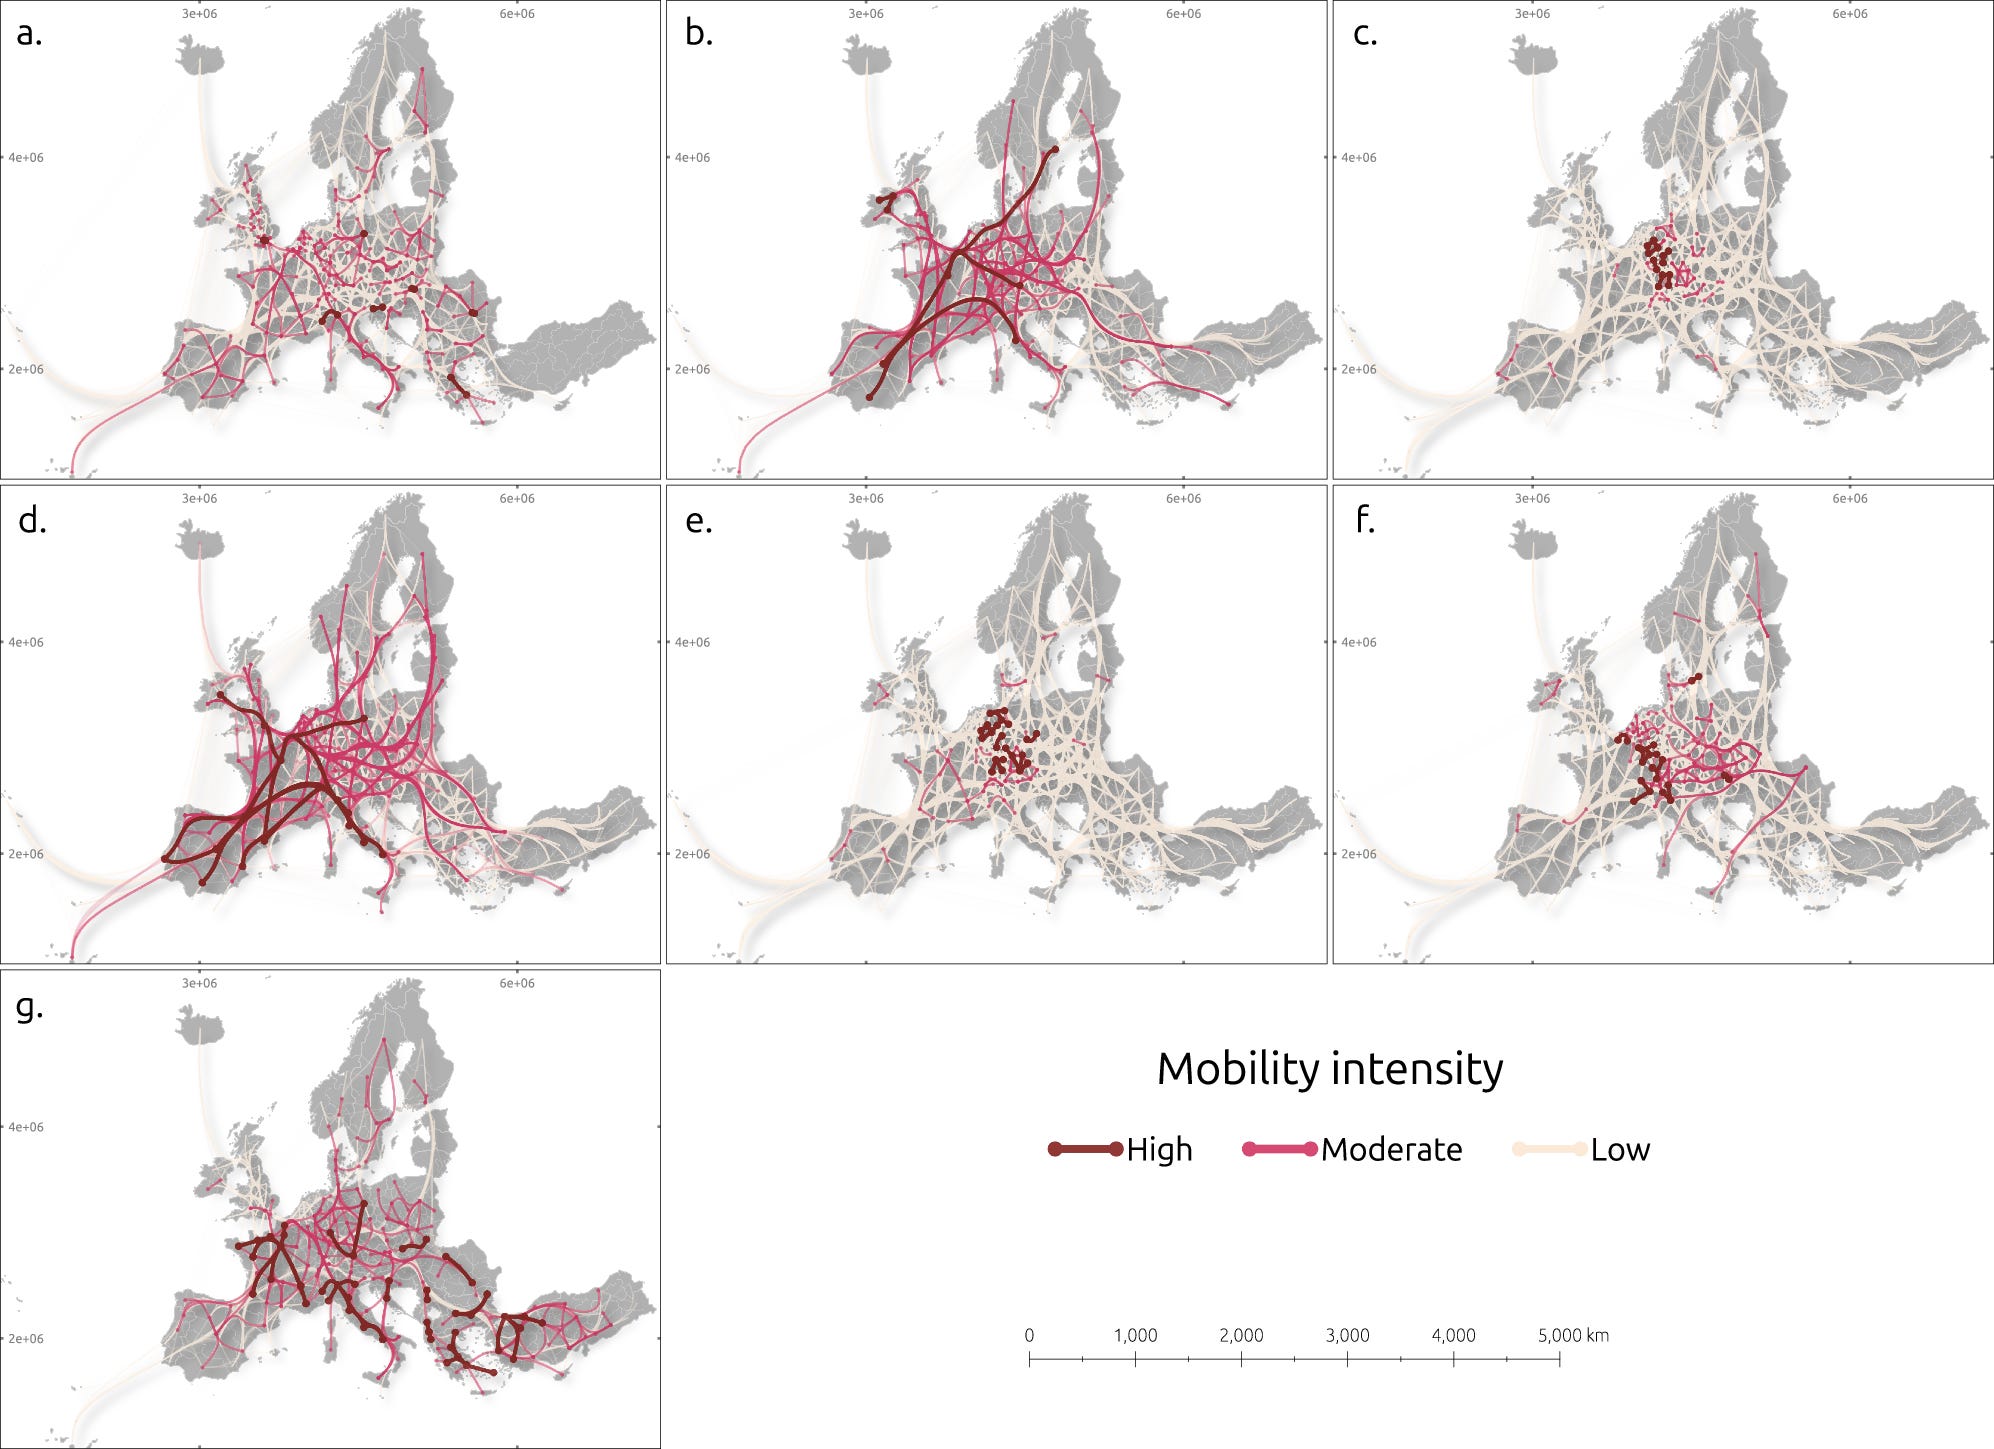
It’s August in Europe (and for the rest of the world for that matter), which means that everyone is on holidays and travelling around - usually in a caravan or a train of some sort (no gross over-generalisations here…). Anyway, a new study from Nature Communications argues that we need to stop treating all movement as the same. The researchers combined data from the Labour Force Survey, Erasmus+ student exchanges, and geotagged X posts to map out seven distinct types of spatial mobility. This included everything from short-term student exchanges and seasonal agricultural work to cross-border commuting and multilocal living, where people actively split their time between multiple residences.
By running these different mobility flows against a huge variety of regional characteristics, the team found that the factors attracting one type of person often repel another. For instance, an increase in a region’s GDP per capita generally leads to an influx of long-term students and permanent migrants, but it actually causes a drop in seasonal workers and long-distance commuters. Digital infrastructure also plays a fascinating role. Faster mobile internet speeds at an origin location tend to boost cross-border commuting and multilocal living, likely because good connectivity makes flexible work arrangements easier. Conversely, at the destination, faster internet is associated with a decrease in seasonal manual labour.
The findings highlight that a one-size-fits-all approach to regional development just doesn’t work. Rather than simply trying to stop outmigration or blindly attract permanent residents, policymakers might be better off leaning into their region’s specific strengths to attract seasonal workers or digital nomads.
You can access the data here.
4. Combining radar and optical data for better forest mapping
Estimating forest height accurately across large areas is a massive challenge in remote sensing, but it can be pretty important for understanding biomass and carbon storage. While SAR techniques like Polarimetric SAR Interferometry (Pol-InSAR) are widely used for this, their performance can suffer when the underlying physics models struggle with complex terrain slopes and varied canopy structures. A new study from IEEE tackles this by expanding on a recently developed hybrid model that combines machine learning with a physical radar model. The researchers realised that while radar data from satellites like TanDEM-X is great for capturing physical structures, adding multispectral optical data from Landsat could provide the extra missing clues about vegetation types and density needed to resolve tricky structural ambiguities.
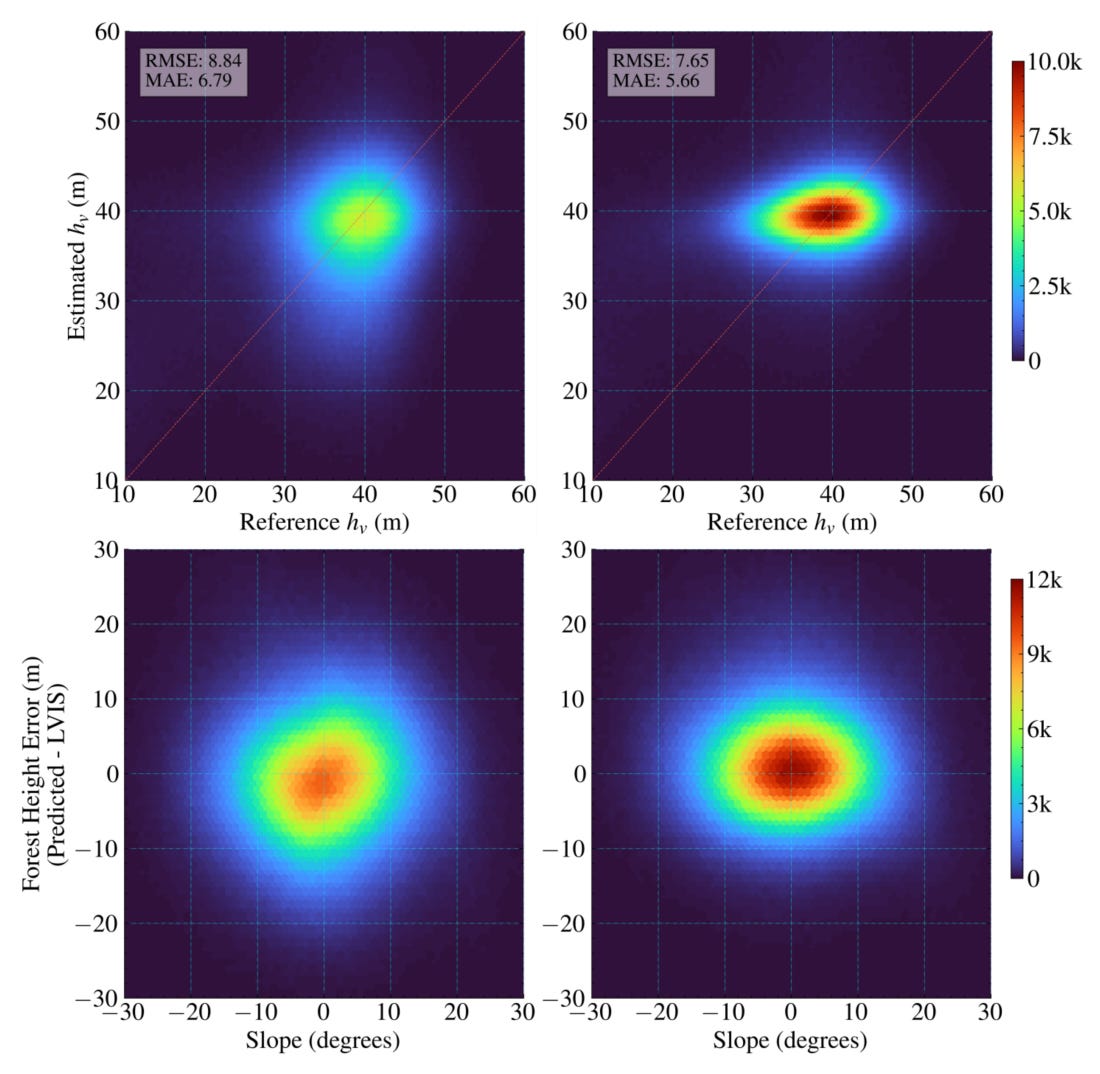
To put this to the test, the team took an earlier hybrid model that relied solely on TanDEM-X radar features (Model C) and upgraded it by adding four Landsat optical bands: Red, Near-Infrared (NIR), and two Short-Wave Infrared bands (SWIR1 and SWIR2). They trained and tested this new version (Model D) over the diverse, hilly terrain of the Lopé National Park in Gabon, comparing the results against high-precision airborne LiDAR measurements from the AfriSAR campaign. The optical boost made a remarkable difference. Model D reduced the Root Mean Square Error (RMSE) by 13.5% and the Mean Absolute Error (MAE) by 16.6% compared to the radar-only version.
What’s particularly impressive is how well the new model handled difficult topography. The radar-only approach consistently underestimated forest heights on slopes facing away from the sensor, but the inclusion of Landsat spectral data allowed the machine learning component to correct this bias almost entirely on moderate slopes.
Geospatial Datasets
1. Global macroeconomic statistics dataset
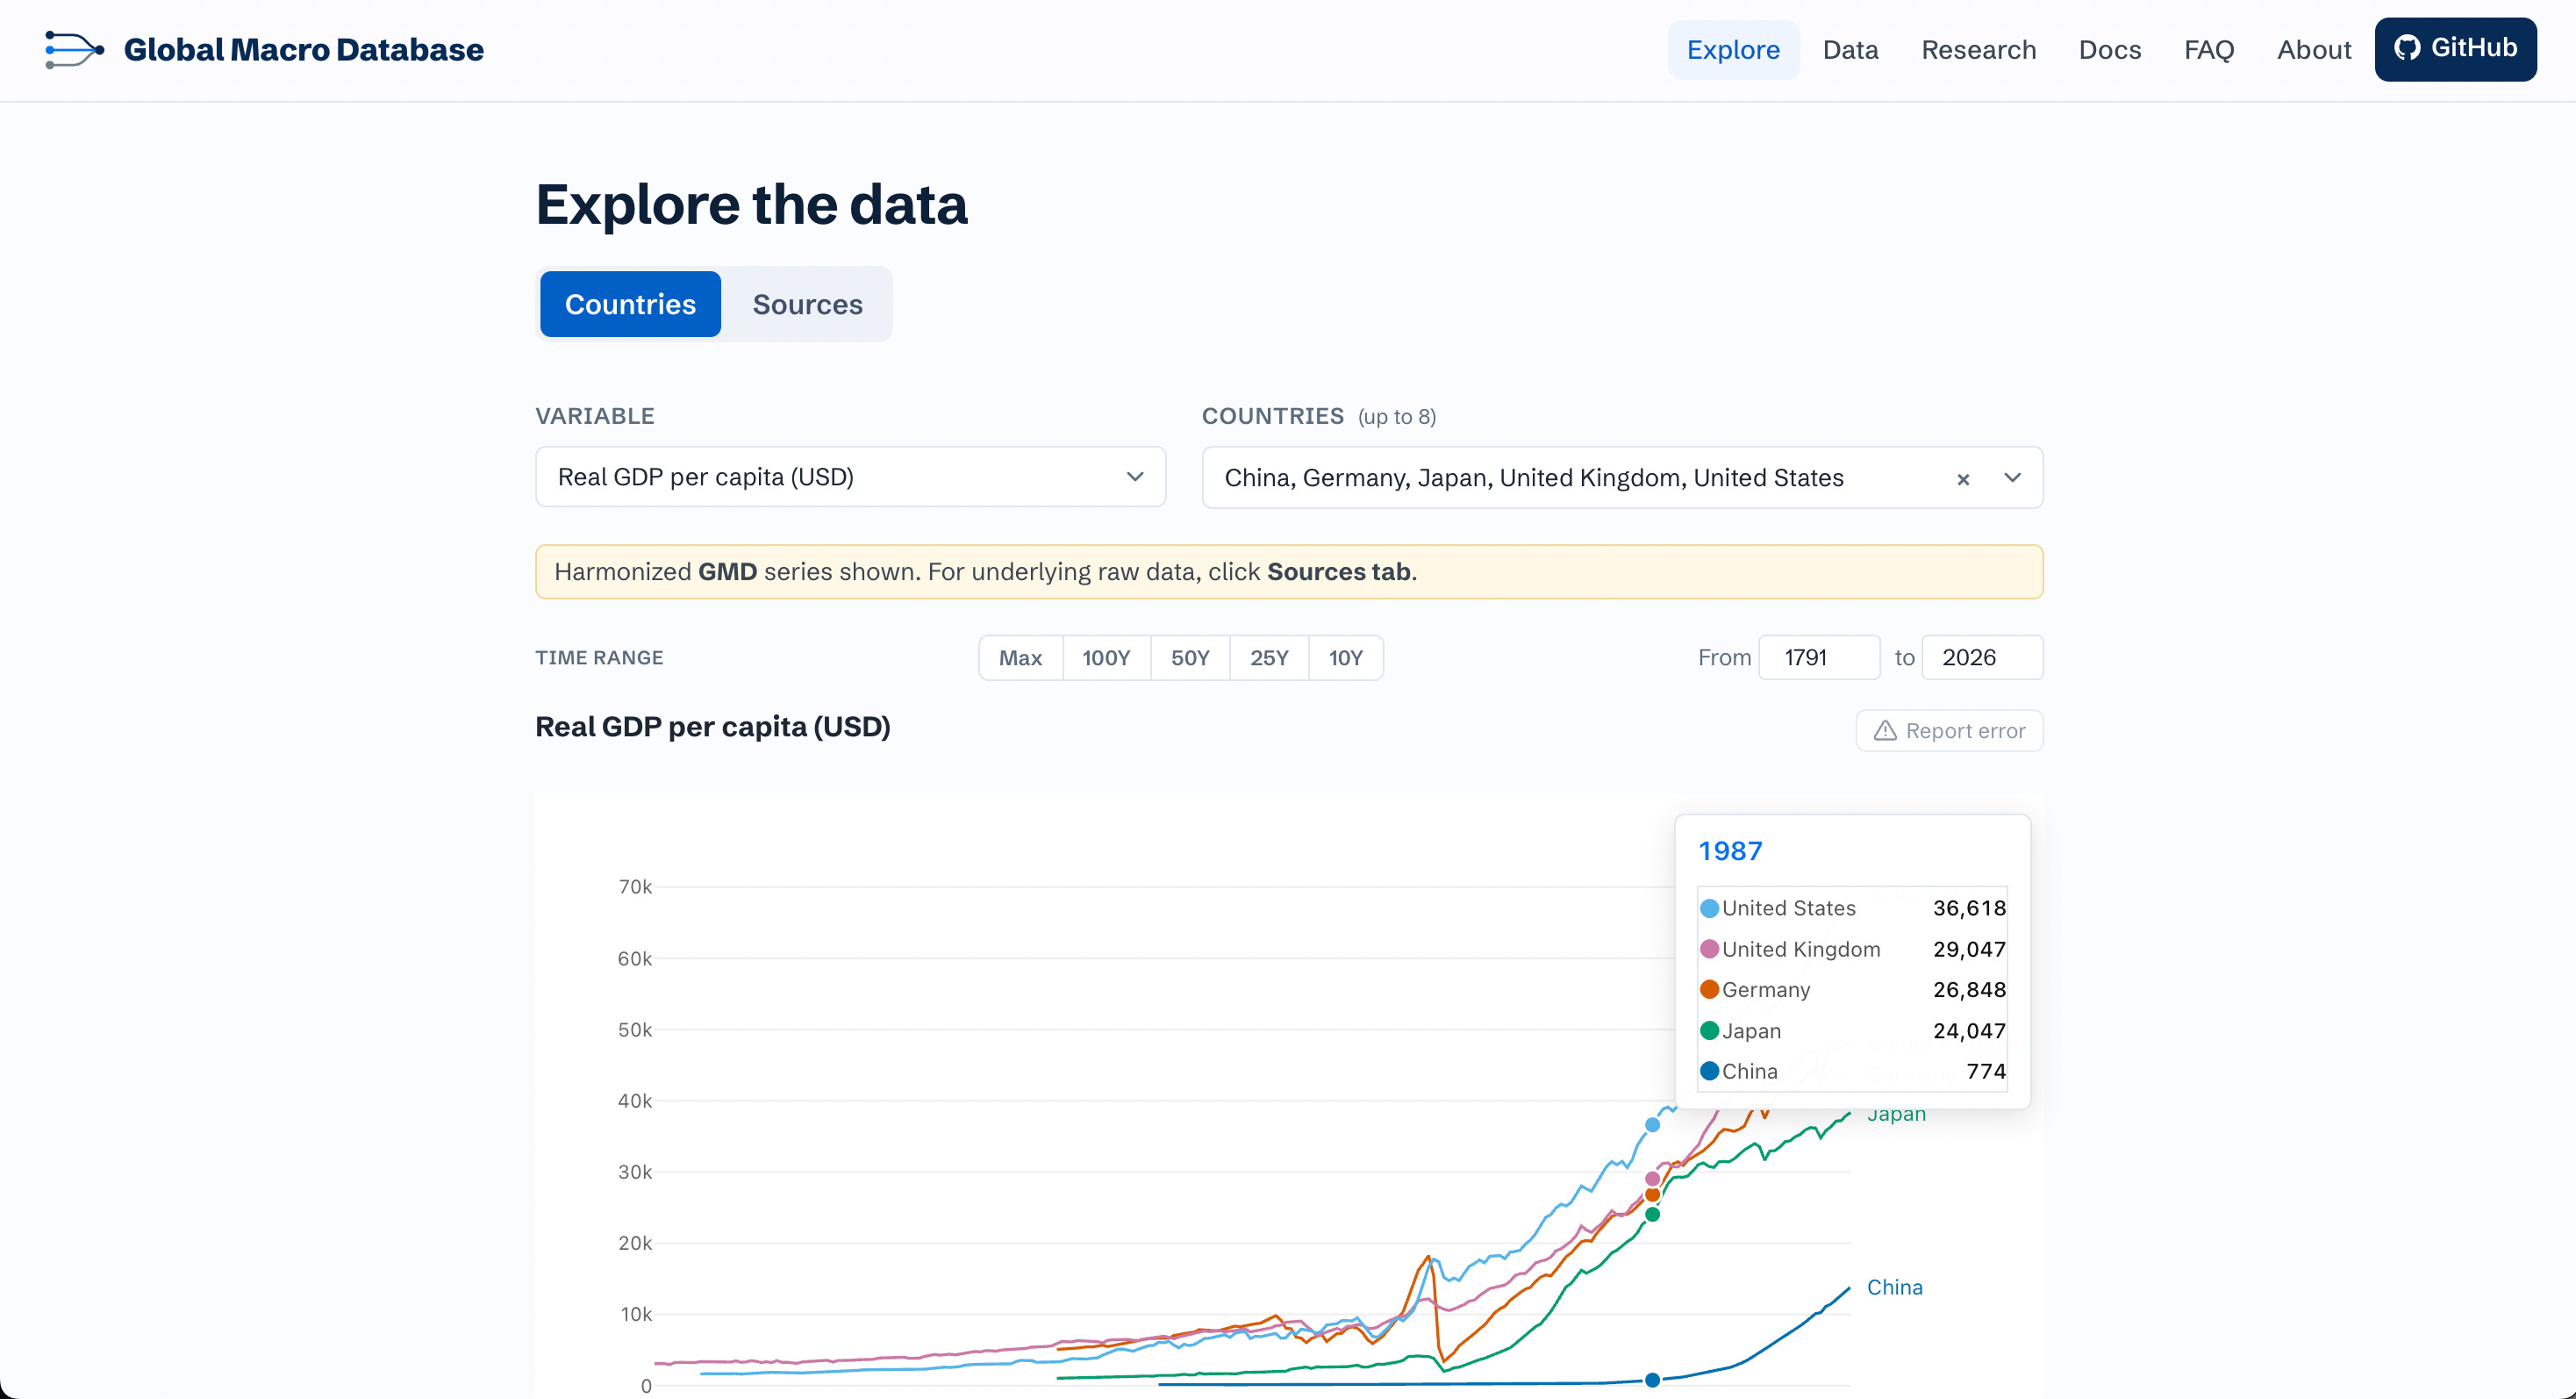
The Global Macro Database compiles 46 macroeconomic variables across 239 countries, harmonising 160 historical and contemporary sources into continuous country-level series. The data runs from 1086 to 2025 with forecasts extending to 2030. Access the data here and code here.
2. Abyssal ocean temperature dataset
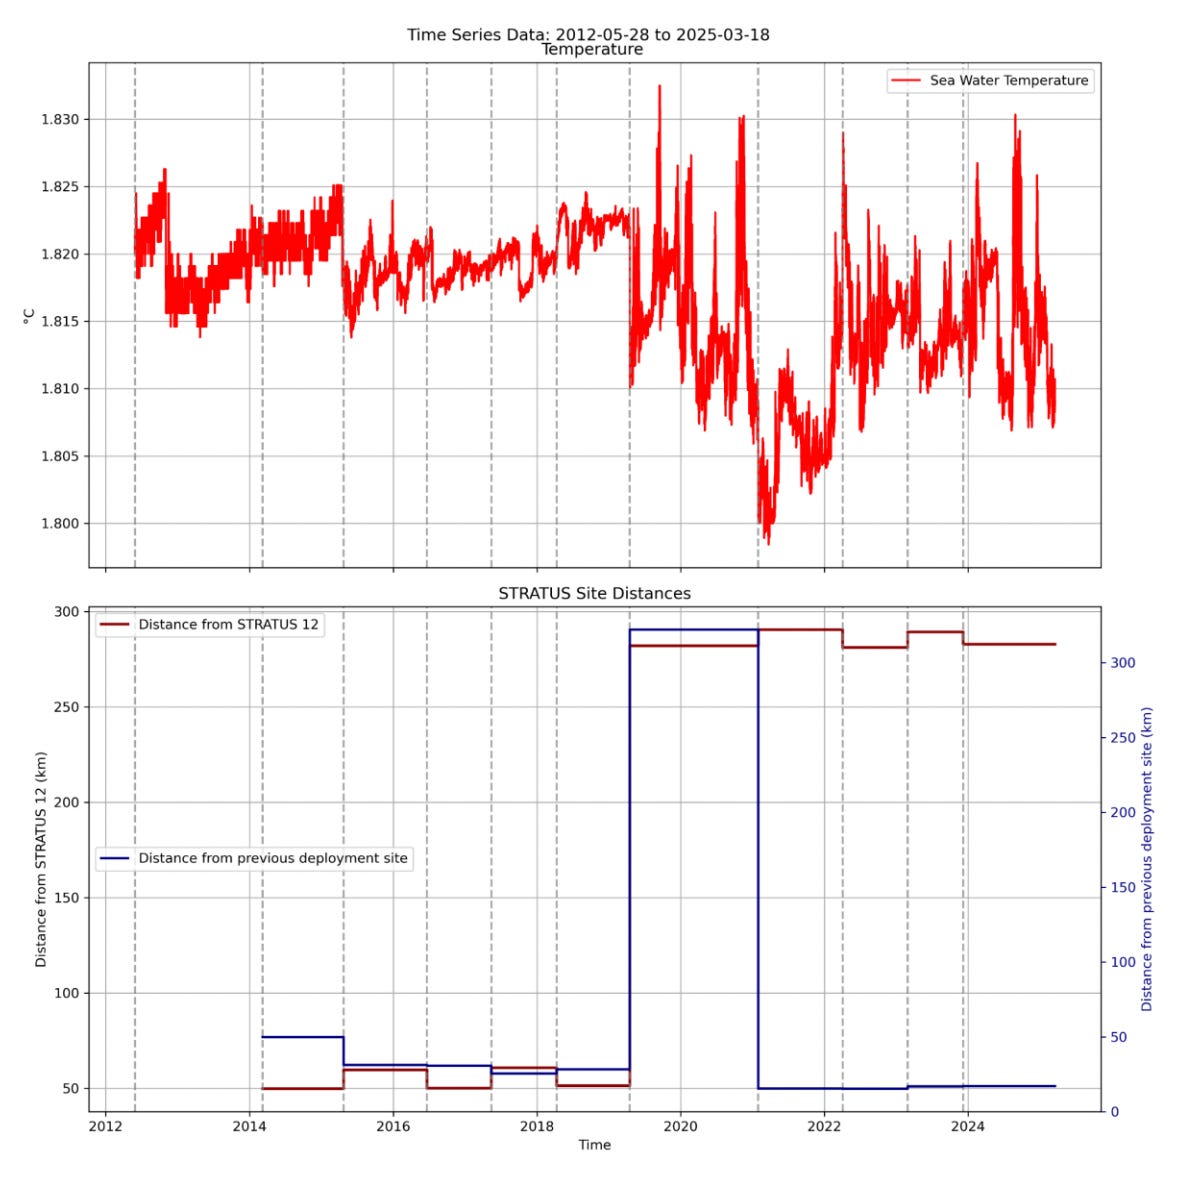
The Stratus Ocean Reference Station dataset provides a 13-year continuous time series (2012 to 2025) of deep ocean temperature observations at abyssal depths between 4,191 and 4,526 m in the Southeast Pacific. Access the data here and the code here.
3. Global snow-free leaf area index dataset
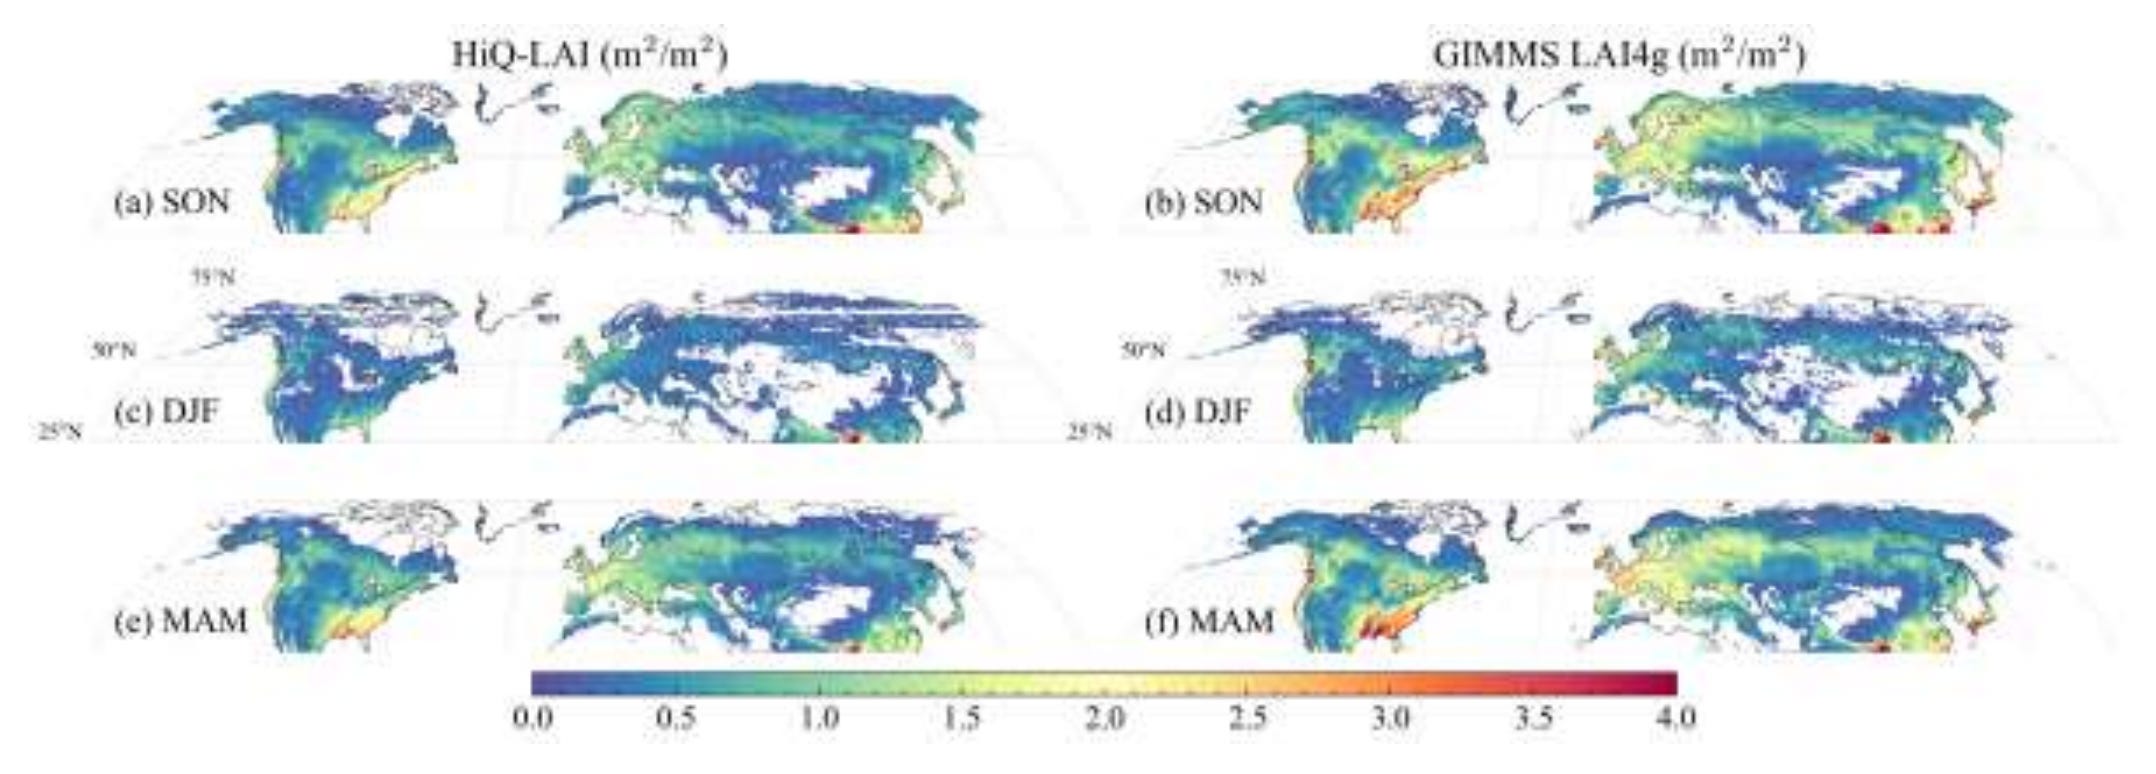
The Global Snow-free Leaf Area Index dataset provides monthly global leaf area index (LAI) and stem area index (SAI) fields at a 500-m spatial resolution spanning from 1985 to 2020. Access the code here. The links to the datasets for each year (1985-2020) can be found under Data Records of the article.
4. Hybrid global river discharge dataset
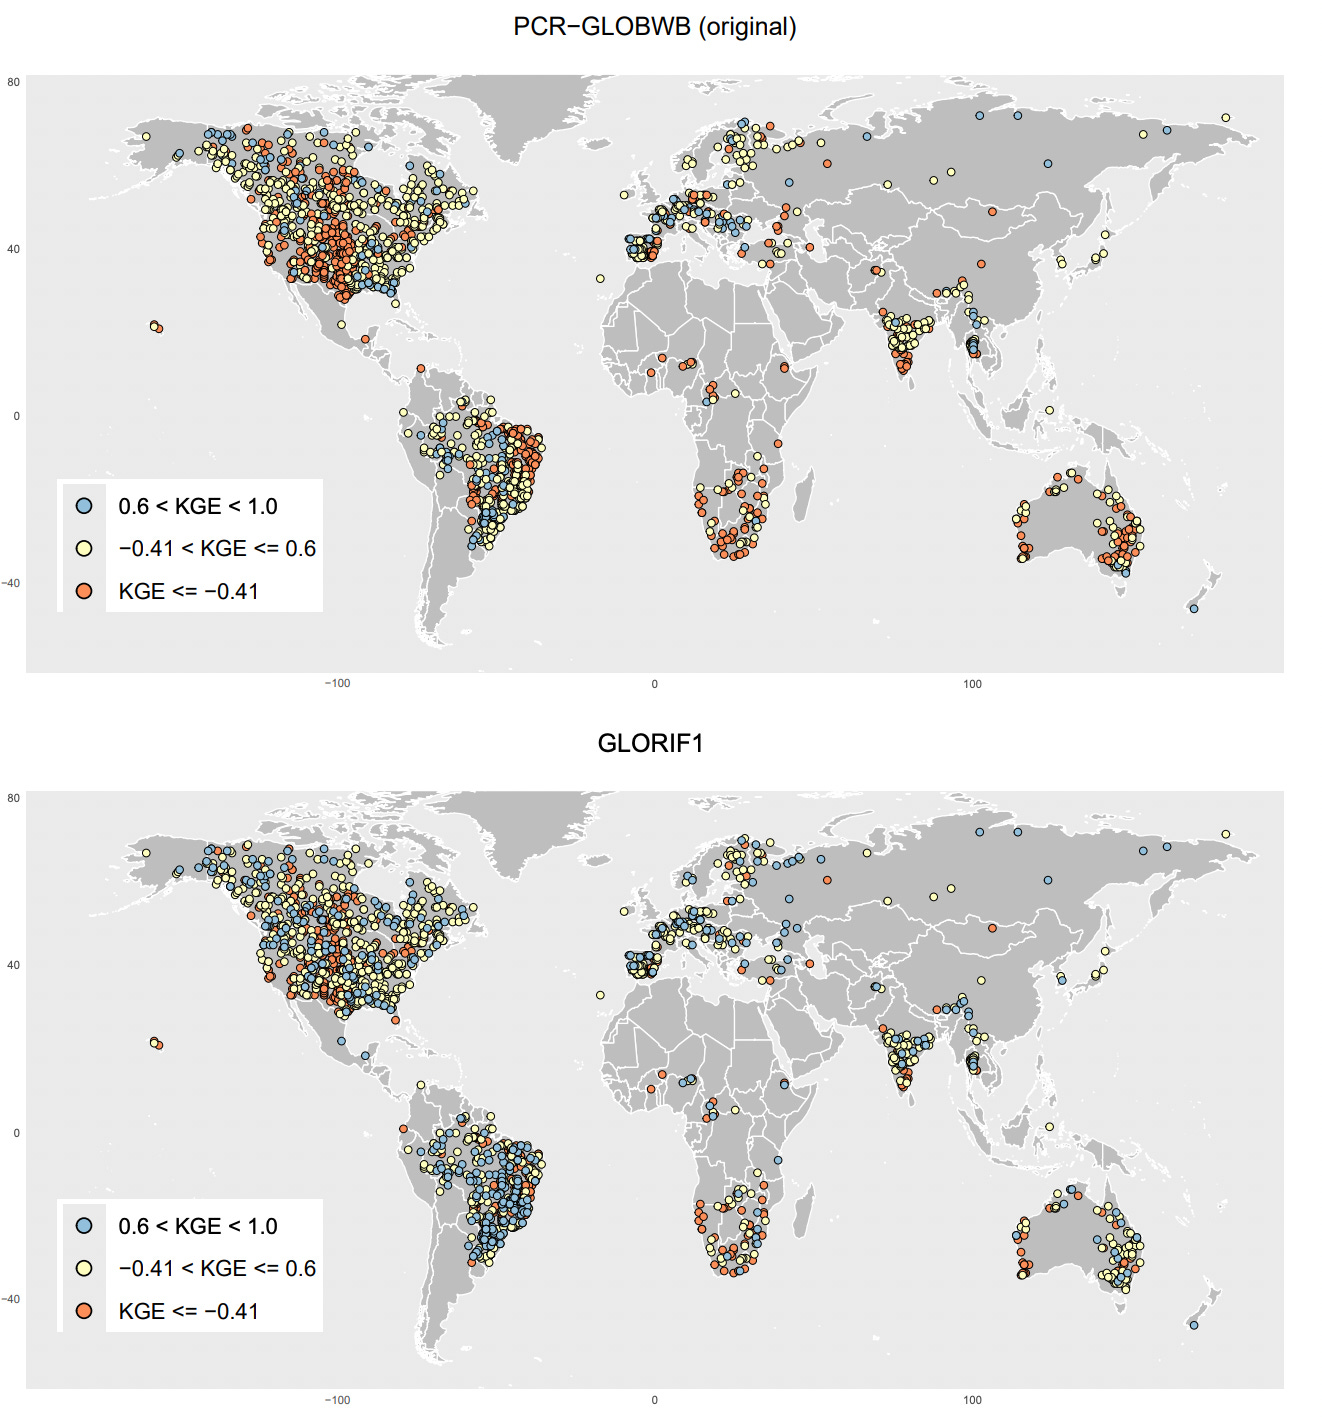
The GLORIF1 dataset provides a monthly global river discharge inventory spanning 1979 to 2019 at a 30-arcminute spatial resolution (approximately 50 km at the equator). Access the data here and the code here.
Other useful bits
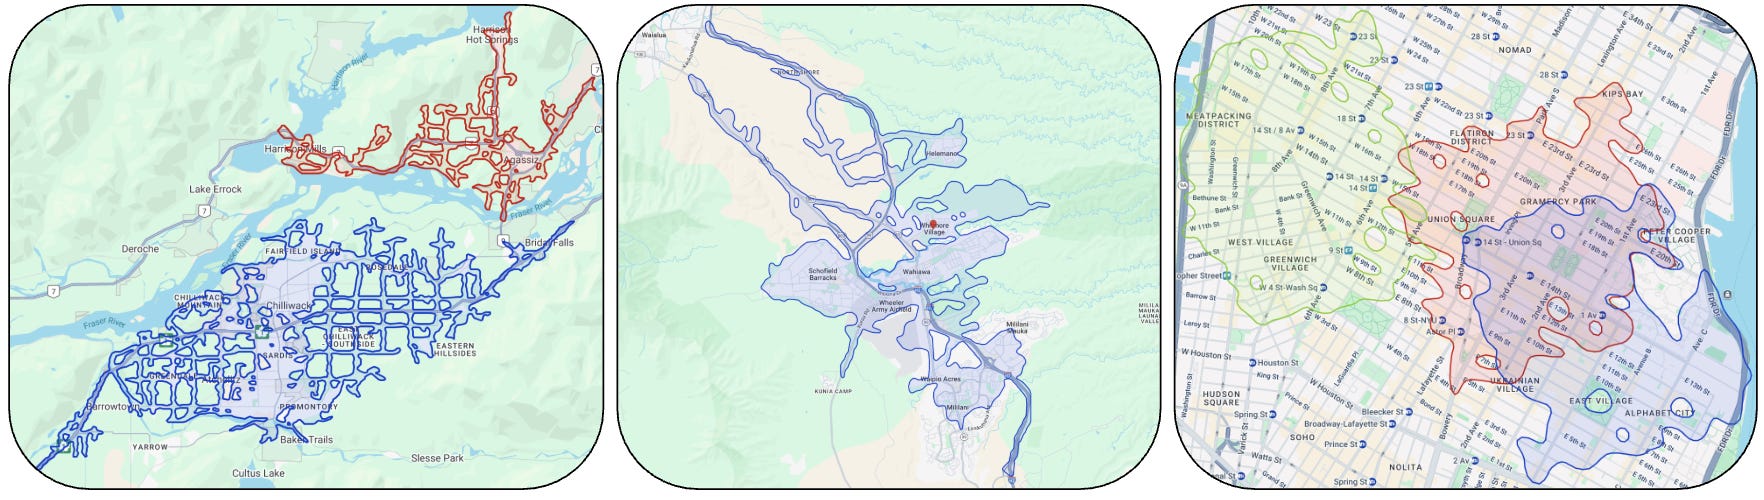
Google’s Isochrones API generates reachable area polygons from an origin point based on actual road network travel times rather than simple straight-line distances. This allows developers to measure true accessibility for practical applications like delivery logistics, real estate commute planning, and urban service mapping.
Sentinel-2 Paint is an open-source web app that reconstructs user-uploaded images as mosaics using real, geolocated satellite imagery patches from the Sentinel-2 archive. It indexes nearly 93,000 unique surface colours extracted from global imagery.
NASA has mandated that its 11 billion dollar Habitable Worlds Observatory will be engineered for robotic in-space servicing, assembly, and maintenance. Situated at the Sun-Earth Lagrange point 2, the flagship telescope will feature modular components and standardised interfaces so robotic spacecraft can upgrade and repair its systems in orbit.
A non-profit is investing in open-source geospatial AI tools to help humanitarian organisations like the WFP predict supply chain disruptions and reroute food aid more efficiently. By identifying structural bottlenecks and road closures in vulnerable regions like Afghanistan before they occur, the initiative aims to mitigate hunger and ensure timely delivery amidst growing global food insecurity.
Jobs
Mercy Corps are looking for a remote GIS Intern
The Nature Conservatory is looking for a Natural Climate Solutions Data Scientist in the US
The FAO is looking for a bunch of Geospatial Data Science Consultants
Just for Fun

A daytime telescopic image captured from British Columbia, Canada, highlights the moment Venus re-emerged from behind the bright limb of a crescent Moon following a one-hour lunar occultation on 17 June.
That’s it for this week.
I’m always keen to hear from you, so please let me know if you have:
new geospatial datasets
newly published papers
geospatial job opportunities
and I’ll do my best to showcase them here.
Yohan