

🌐 A new way to measure rural economic activity
PLUS: Spotting urban danger zones with geospatial models, and more.

Hey guys, here’s this week’s edition of the Spatial Edge — your weekly map to the latest geospatial news. The aim, as always, is to make you a better geospatial data scientist in less than five minutes a week.
First up, I’ll be heading to the AI For Good Summit in Geneva next Tuesday, so hit me up if you’ll be around. I’m always up for a coffee and a geospatial chat.
In today’s newsletter:
Rural Markets: Satellites track weekly market activity.
Urban Hazards: Geospatial models flag danger zones.
Groundwater Loss: Urban sprawl threatens aquifers.
Urban Weather: Atlanta gets high-res meteorology data.
AI Economy: Stanford tracks AI’s economic impacts.
5G Networks: Glasgow releases urban performance data.
Research you should know about
1. A new way to measure rural economic activity
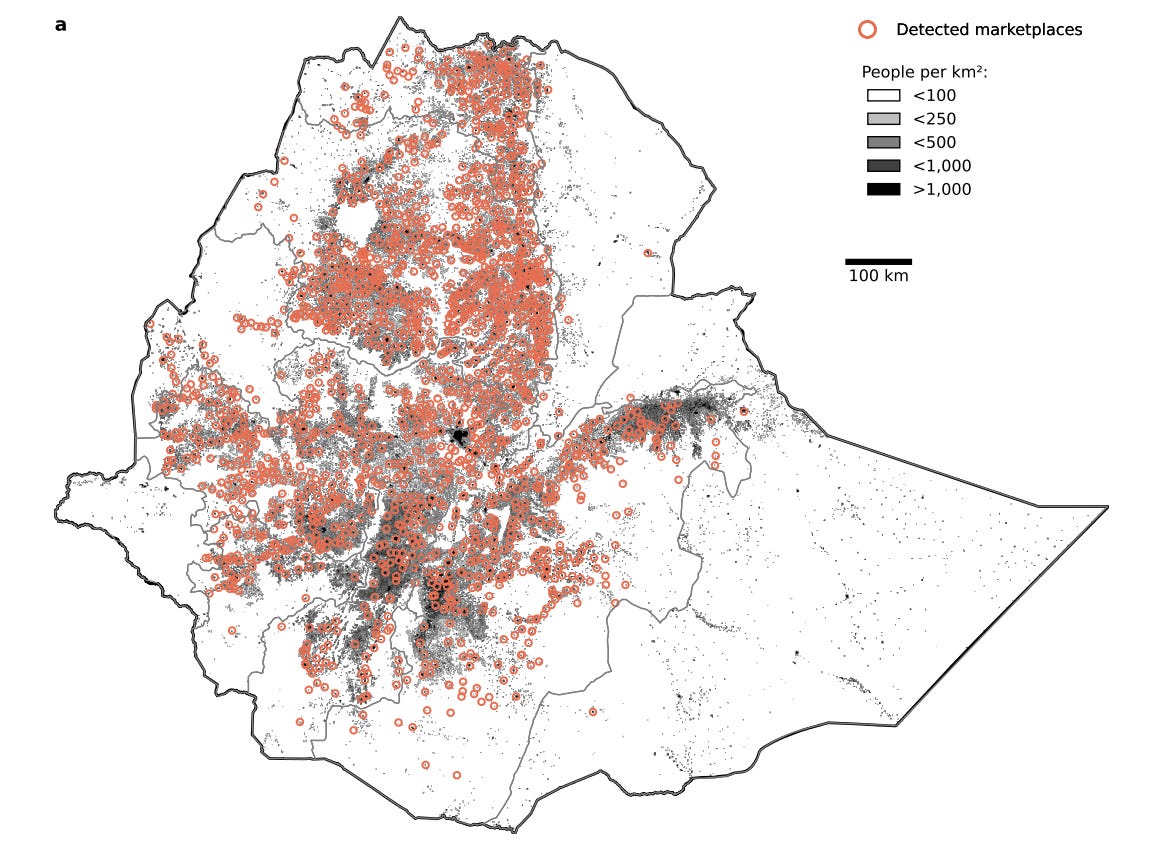
In many rural areas, weekly markets are where a lot of the local economy actually happens. Farmers sell crops, traders move goods around, and households buy what they need. But these markets are often informal, scattered across remote areas, and poorly recorded in official data. A new Nature Communications study shows that satellites can help fill this gap. The basic idea is that outdoor markets look different on market days than on other days, because of stalls, crowds, vehicles, and temporary structures. A single satellite image might barely show this, but a long time series of images can reveal a repeated weekly pattern.
The authors use PlanetScope imagery to compare each image with nearby non-market-day reference images, then look for places where brightness and colour change on a regular day-of-week cycle. They validate the approach using known marketplace data from Kenya, Malawi, and Mozambique, where the method achieves high precision, generally above 90% across a broad range of signal strengths. They then apply it across Ethiopia, excluding Addis Ababa, and map 1,776 periodic markets between 2017 and 2024. The resulting map is pretty revealing: around 70% of Ethiopia’s population lives within 10 km of one of these detected markets, and 63% of the markets sit in places with no measurable night-time light emissions. So this picks up a kind of rural economic activity that nightlights would mostly miss.
The activity data is also interesting. Market activity rises and falls with the agricultural calendar, increasing around harvest periods and responding to rainfall shocks. A one standard deviation increase in growing-season rainfall is associated with a roughly 4.2 point increase in harvest-season market activity. The authors also use the data to track disruption during Ethiopia’s recent conflict, finding that periods with more conflict events generally line up with lower market activity. The method has limits, especially where markets are covered, hidden by trees, very cloudy, or not operating around the satellite overpass time. But as a way to monitor rural economic life at high frequency, especially where surveys are sparse or unsafe, this is a pretty neat addition to the geospatial toolkit
2. Spotting urban danger zones with geospatial models
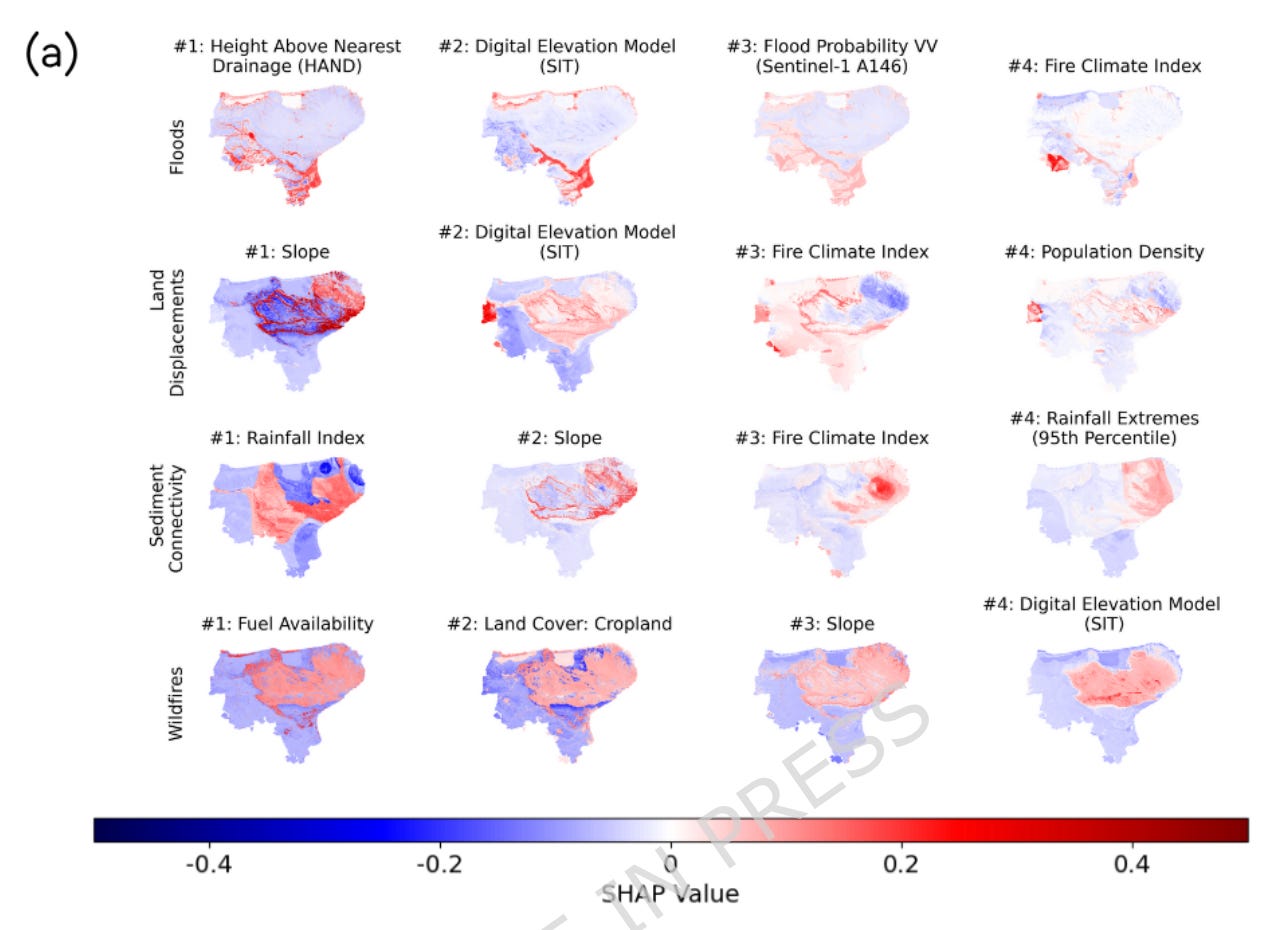
A new Scientific Reports paper looks at a pretty useful problem in urban remote sensing: how to monitor several hazards at the same time. Most satellite-based hazard studies focus on one thing, like floods, wildfire risk, or land movement. This paper tries to bring these together by combining AI with several sources of satellite imagery to map four hazards across two areas in Puglia, southern Italy: floods, land displacement, sediment connectivity, and urban wildfires.
The authors used a mix of Sentinel-1, Sentinel-2, COSMO-SkyMed, and SAOCOM data, alongside environmental and human-made features like elevation, slope, rainfall, soil stability, road distance, land cover, and population density. They trained separate random forest models for each hazard on 100 x 100 m grid cells, then used SHAP analysis to see which factors were actually driving the predictions. This is the interesting bit: the model shows why a place is being flagged. For example, flood risk was strongly linked to drainage position, elevation, soil thickness, and satellite-derived flood probability, while wildfire risk was mainly explained by fuel availability, land cover, and fire climate conditions.
The results were fairly strong, especially for land displacement, sediment connectivity, and wildfires. The multi-source approach generally beat single-hazard models, with big gains for land displacement in both study areas. The SHAP analysis also picked up some useful local patterns. In Gargano, steep slopes and post-wildfire conditions helped explain land instability and sediment movement. In Bari, land displacement was more closely linked to roads, pointing to the role of construction, altered drainage, and other human pressures. The broader takeaway is that multi-hazard mapping works best when it treats hazards as connected systems, rather than separate layers on a map.
3. The toll of urban sprawl on groundwater
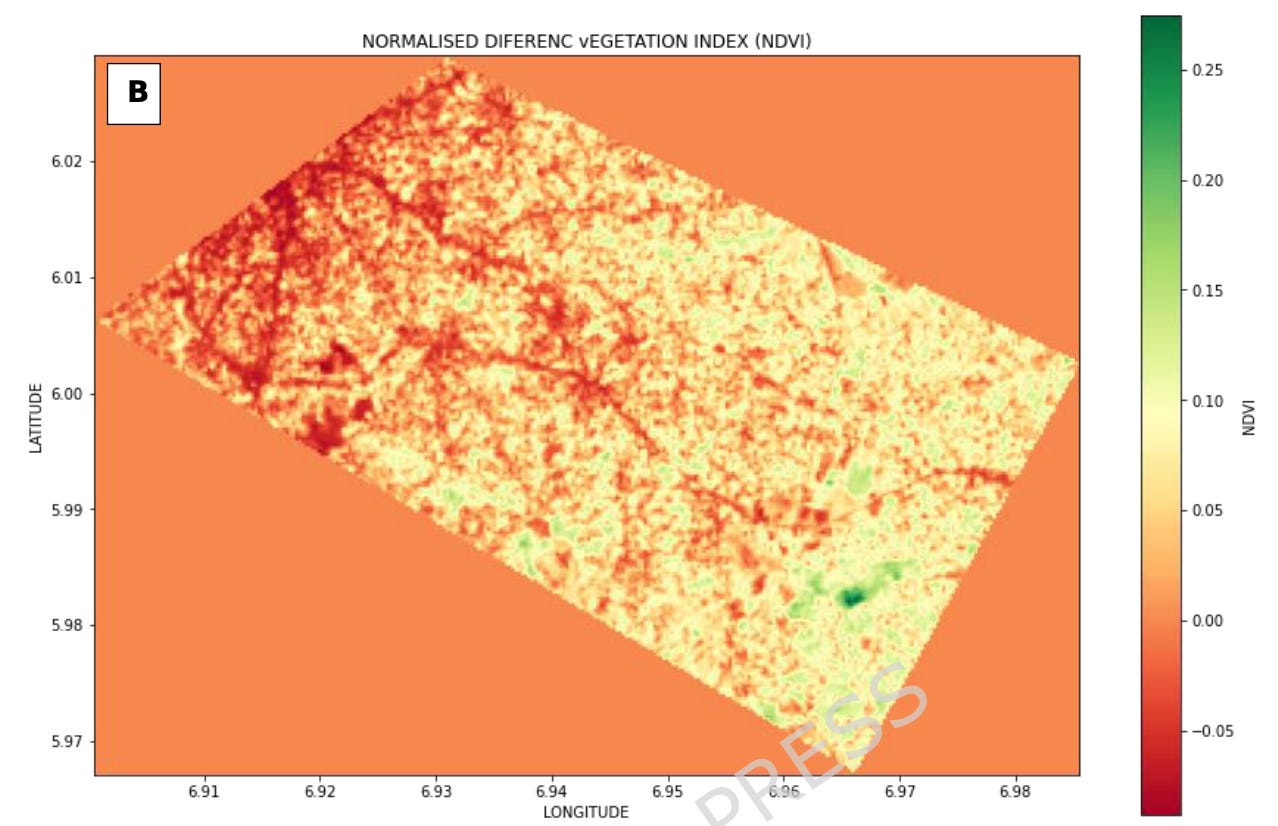
As cities continue to expand rapidly around the globe, they transform the natural landscape by replacing soil and vegetation with concrete and asphalt. This unchecked urban sprawl poses a bit of a threat to underground aquifers, which rely on permeable land to soak up rainfall and replenish their stores. However, the exact impact of this urban growth on groundwater recharge and quality has been difficult to map and quantify on a city-wide scale. A new paper from Scientific Reports addresses this gap by focusing on Nnewi, a rapidly expanding industrial city in southeastern Nigeria, using a combination of remote sensing satellites and GIS to analyse changes over the past decade.
The researchers used Landsat imagery from 2013 and 2024 to map the changing landscape, feeding the data into a GIS model to calculate groundwater recharge potential. The results were pretty big. Over the eleven-year period, dense vegetation plummeted by 71%, while impervious, built-up surfaces expanded significantly to cover over 11% of the total area. Crucially, the model revealed that areas capable of recharging the aquifer now make up just 28% of the city. Furthermore, the expansion of concrete and loss of vegetation not only starved the aquifers of water but directly caused water quality to plummet, with industrial and high-density residential areas showing dangerous spikes in nitrates, heavy metals, and dissolved solids.
The study proves that as a city paves over its natural landscape, it effectively suffocates its own water supply while simultaneously trapping and funnelling pollutants directly into the remaining water table. These findings serve as a bit of a warning for rapidly urbanising cities, especially in Sub-Saharan Africa, where groundwater is often the primary source of drinking water. The authors stress that city planners must urgently incorporate “green infrastructure,” such as permeable pavements and urban parks, to restore the natural water cycle before the damage to local aquifers becomes irreversible.
Geospatial Datasets
1. High-res urban meteorology dataset
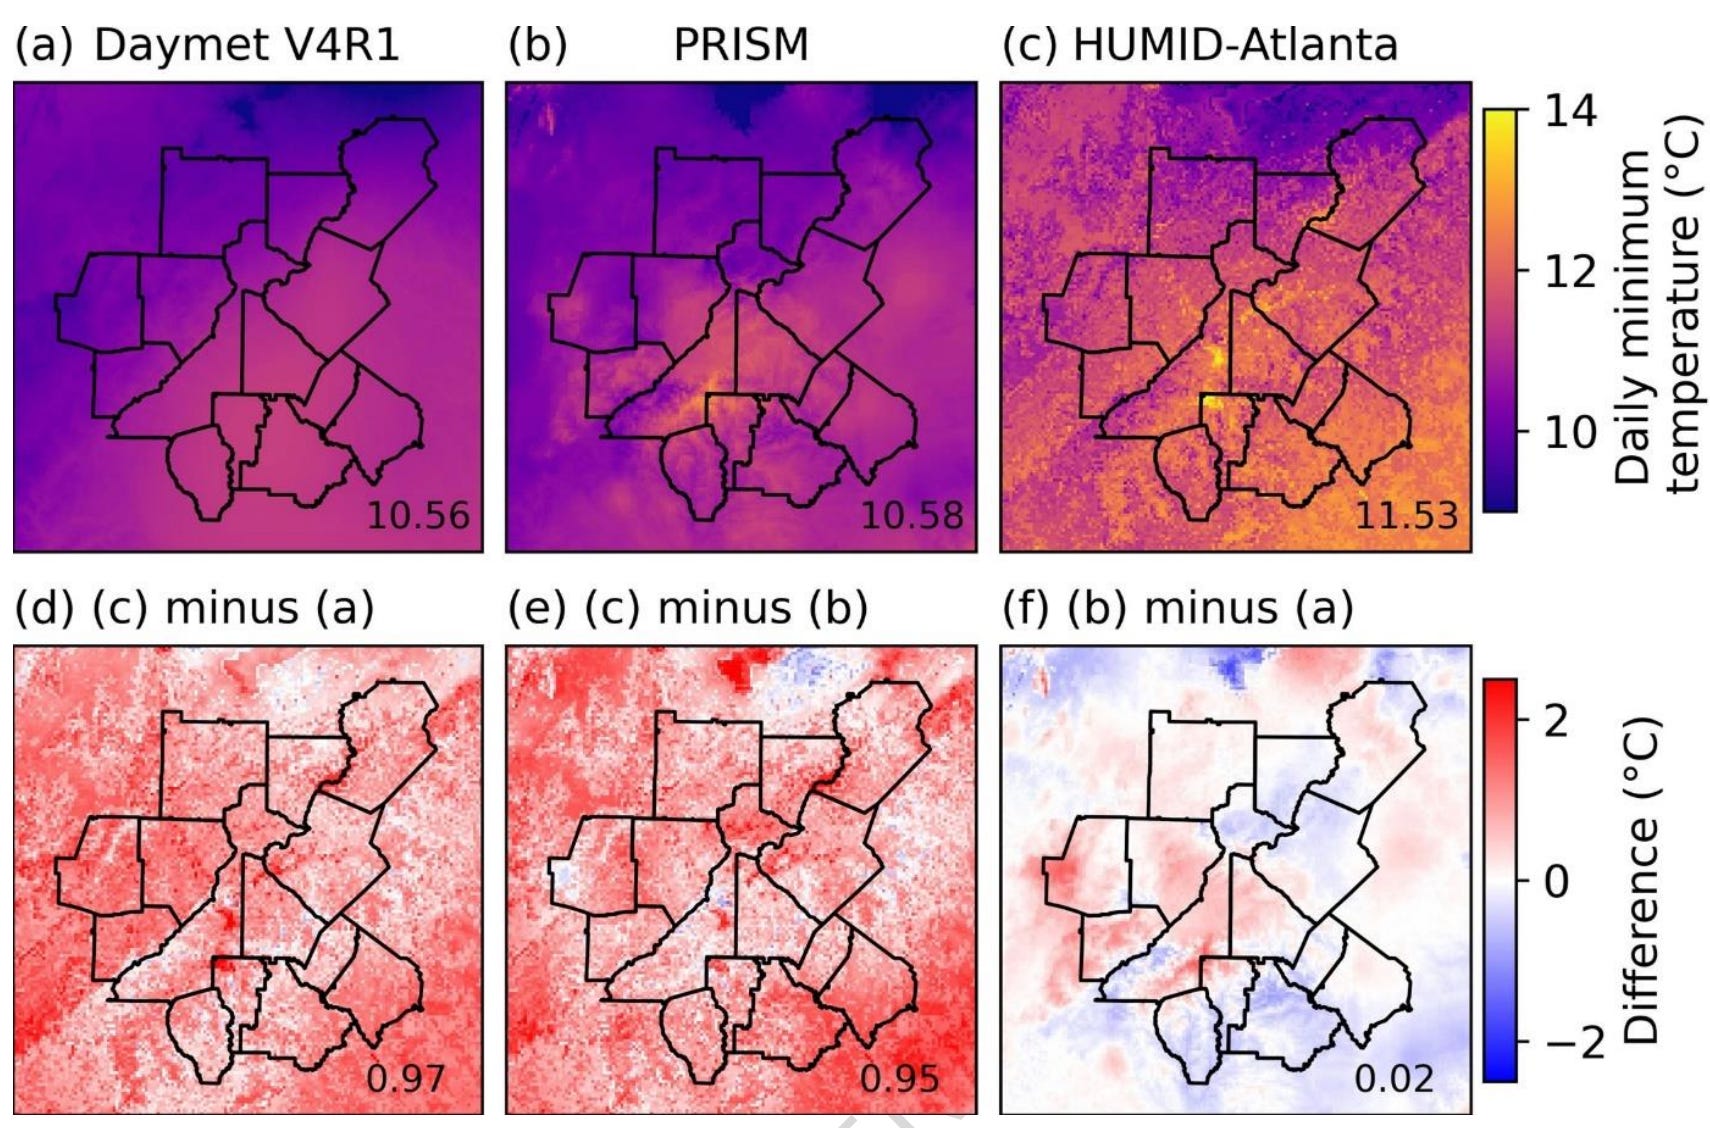
The HUMID-Atlanta dataset provides a 1-square-kilometre resolution hourly meteorological record covering the Atlanta metropolitan area from 2010 to 2023. Access the data here and the code here.
2. AI economic indicators
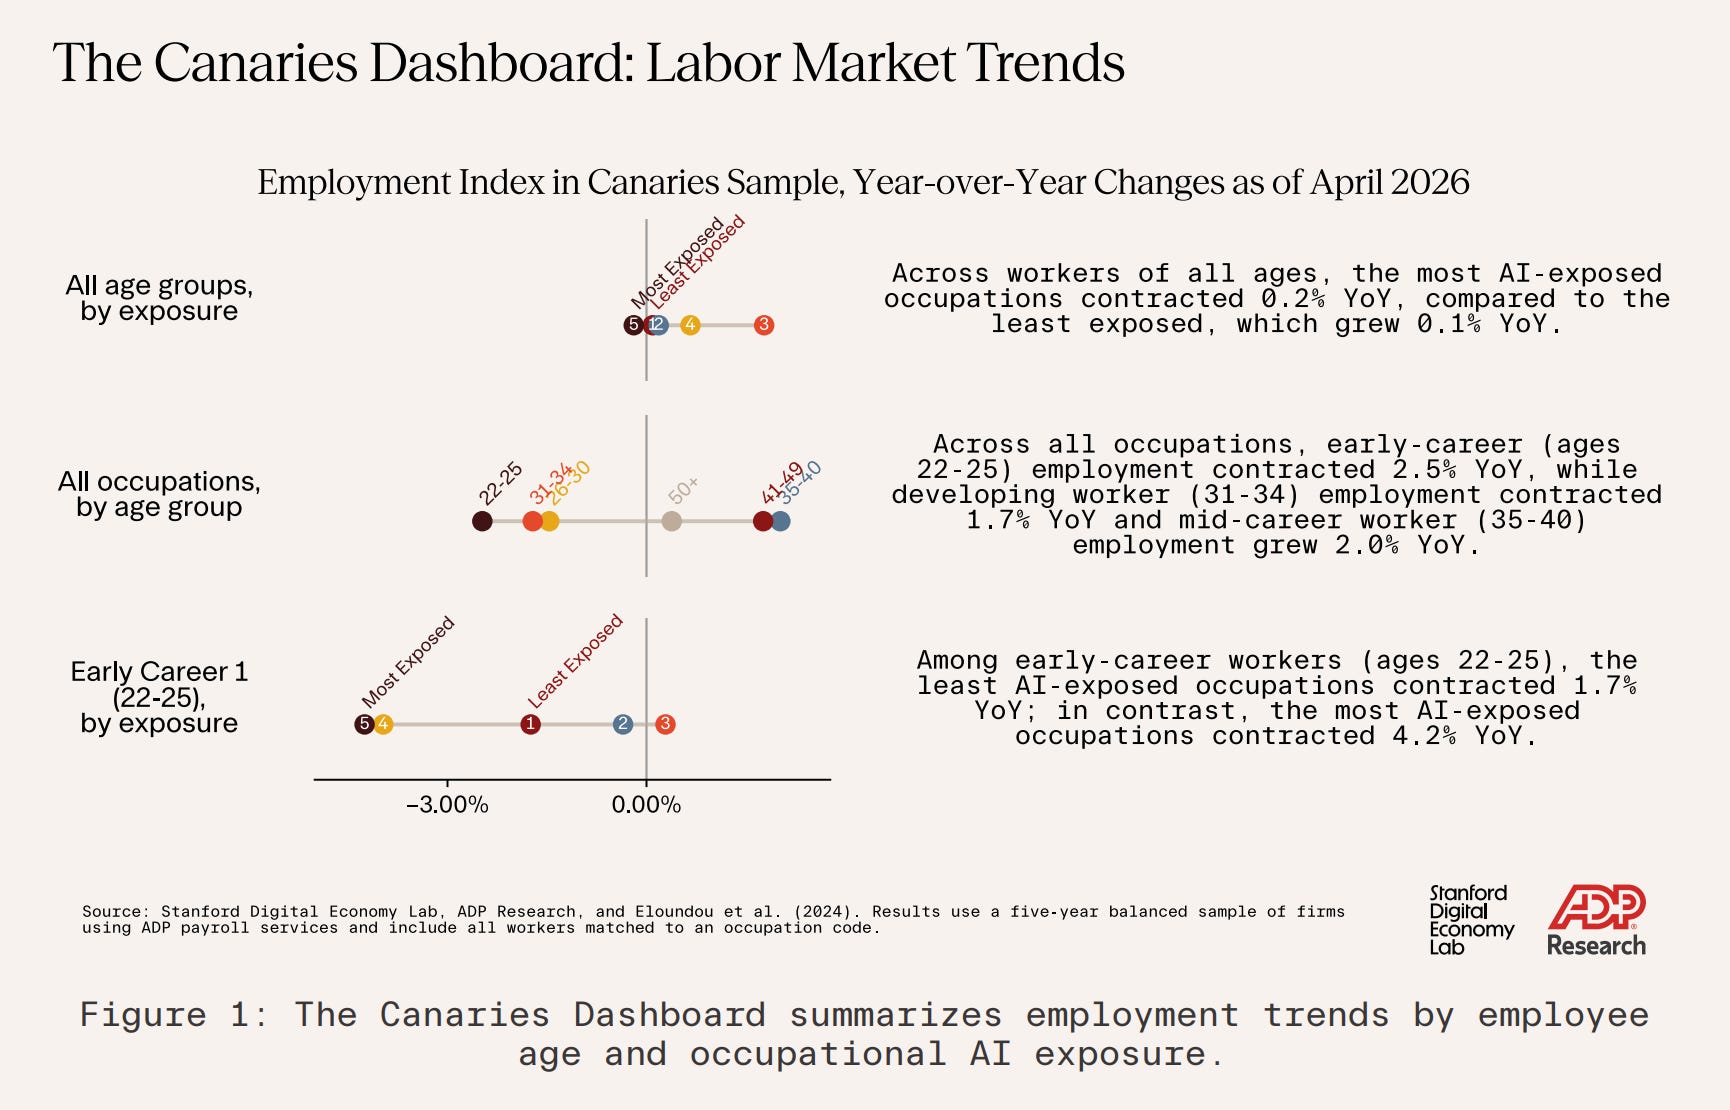
Stanford Digital Economy Lab’s AI Economic Indicators provide a comprehensive framework to monitor the macroeconomic and labour market impacts of AI across the US. It combines three measurement tools: the Canaries Dashboard for payroll employment tracking, the Takeoff Tracker for explosive economic growth indicators, and the Adoption Monitor for firm-level survey results. Access the indicators here.
3. Land-atmosphere coupling metrics dataset
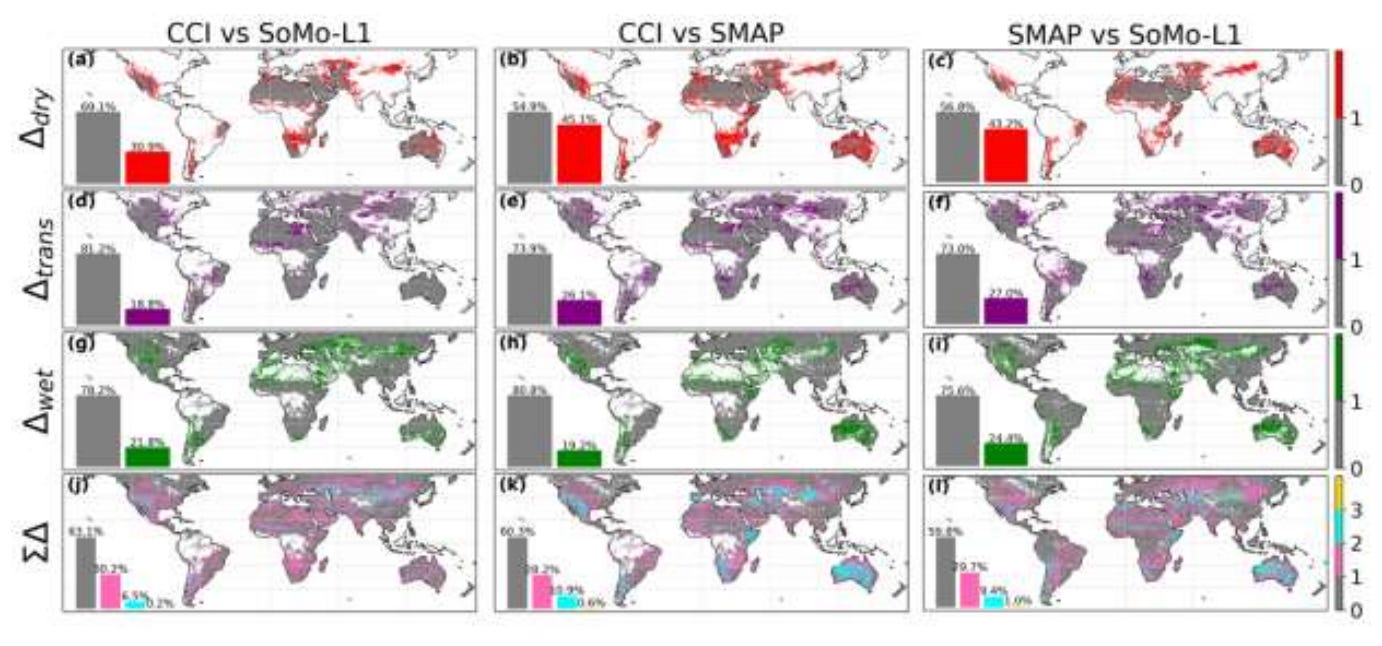
The Global Observationally-Based Land-Atmosphere Coupling Metrics (GOLAM) dataset provides global fields of land-atmosphere interaction parameters at spatial resolutions of 0.1° and 0.25°. Access the data here and the code here.
4. Urban 5G network performance dataset
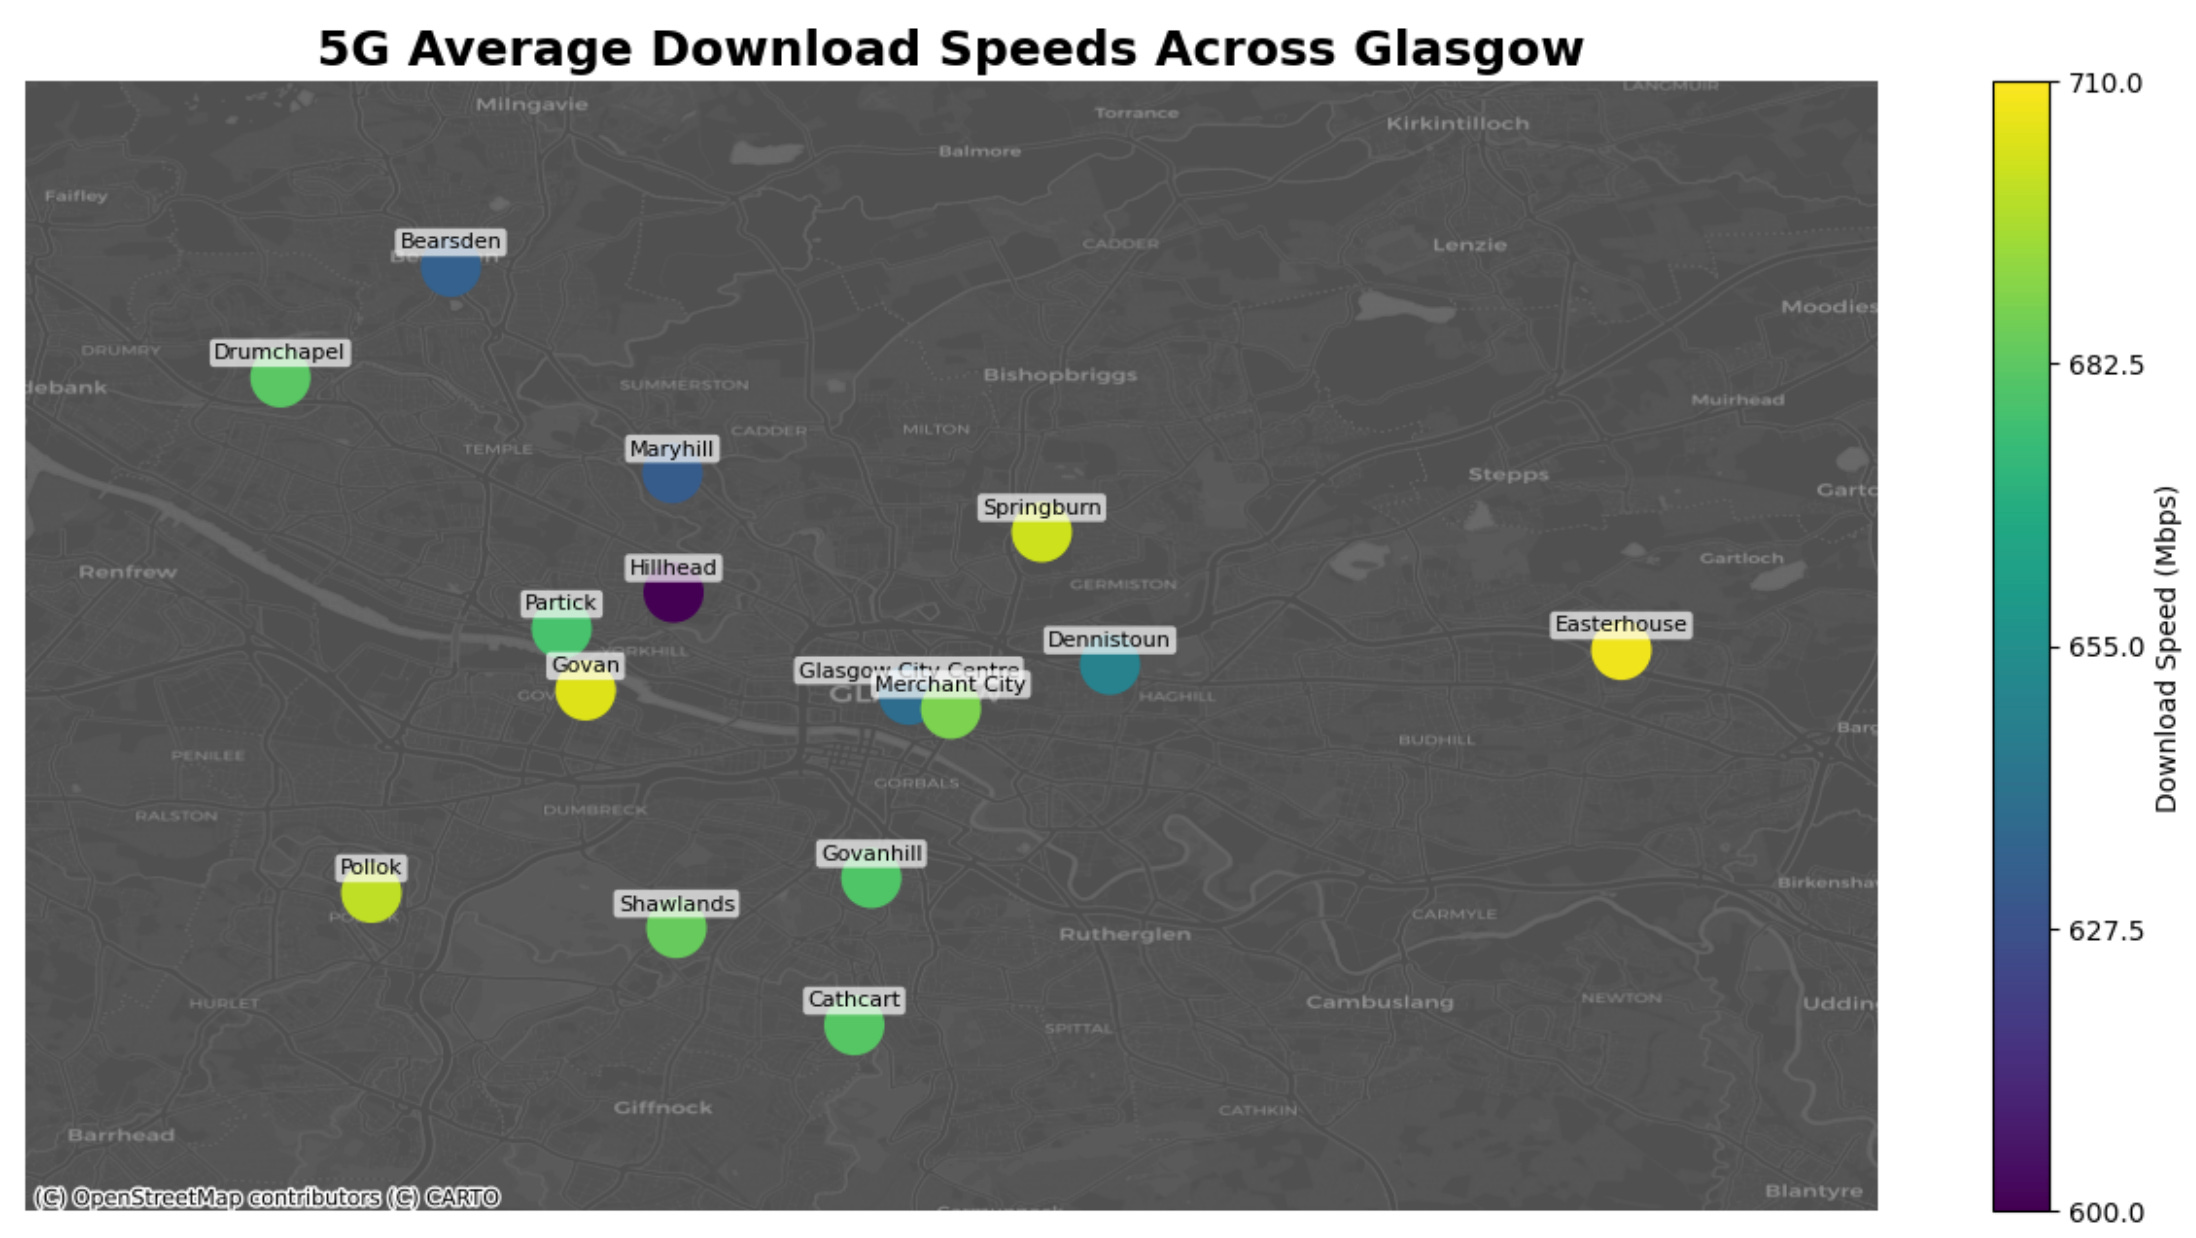
The Glasgow Public and Private 5G Performance Dataset provides 720 empirical outdoor network measurements collected across 15 Glasgow neighbourhoods over a three-day period in April 2025. Access the data and code here.
Other useful bits

A comparative satellite analysis has highlighted 10 global water bodies suffering from severe "continental drying" caused by climate change and unsustainable land use. Long-term imagery reveals that critical freshwater sources, including Argentina's Parana River, Iran's Lake Urmia, and the South Aral Sea, have experienced drastic volume reductions that threaten local ecosystems and regional water security.
Google Research has developed a high-res deep learning framework that converts pixel-based satellite imagery of agricultural landscapes into a vectorised dataset of fine-scale ecological features. This automated pipeline uses Google Earth AI and Google Earth Engine to programmatically classify and map millions of small-scale vegetation structures across England, providing a precise inventory to support nature restoration without compromising food security.
The open-access Harvest2Market platform, developed by NASA Harvest, centralises satellite imagery, market indicators, shipping data, and global crop reports to bridge information silos in agricultural monitoring. This web-based system enables analysts to evaluate food supply chain risks by mapping how regional events, such as severe weather or trade disruptions, impact interconnected global markets.
A satellite has successfully utilised a vision-language model in orbit to identify specific environmental features and infrastructure from natural language queries without ground-based human analysis. The demonstration, conducted on Loft Orbital's YAM-9 spacecraft using a streamlined version of Google DeepMind’s Gemma 3 model, proves the viability of on-orbit data triage and paves the way for autonomous, real-time monitoring constellations.
Jobs
EIB is looking for (1) a Data Warehouse Officer and (2) an Associate DevSecOps Engineer, both based in Luxembourg.
UNOOSA Germany is looking for a GIS / Remote Sensing Expert based in Bonn.
Médecins Sans Frontières UK is looking for (1) a Missing Maps Coordinator and (2) a GIS Specialist (Maternity Cover) based in London
IOM is looking for a Data and Research Intern based in Vienna
Just for Fun
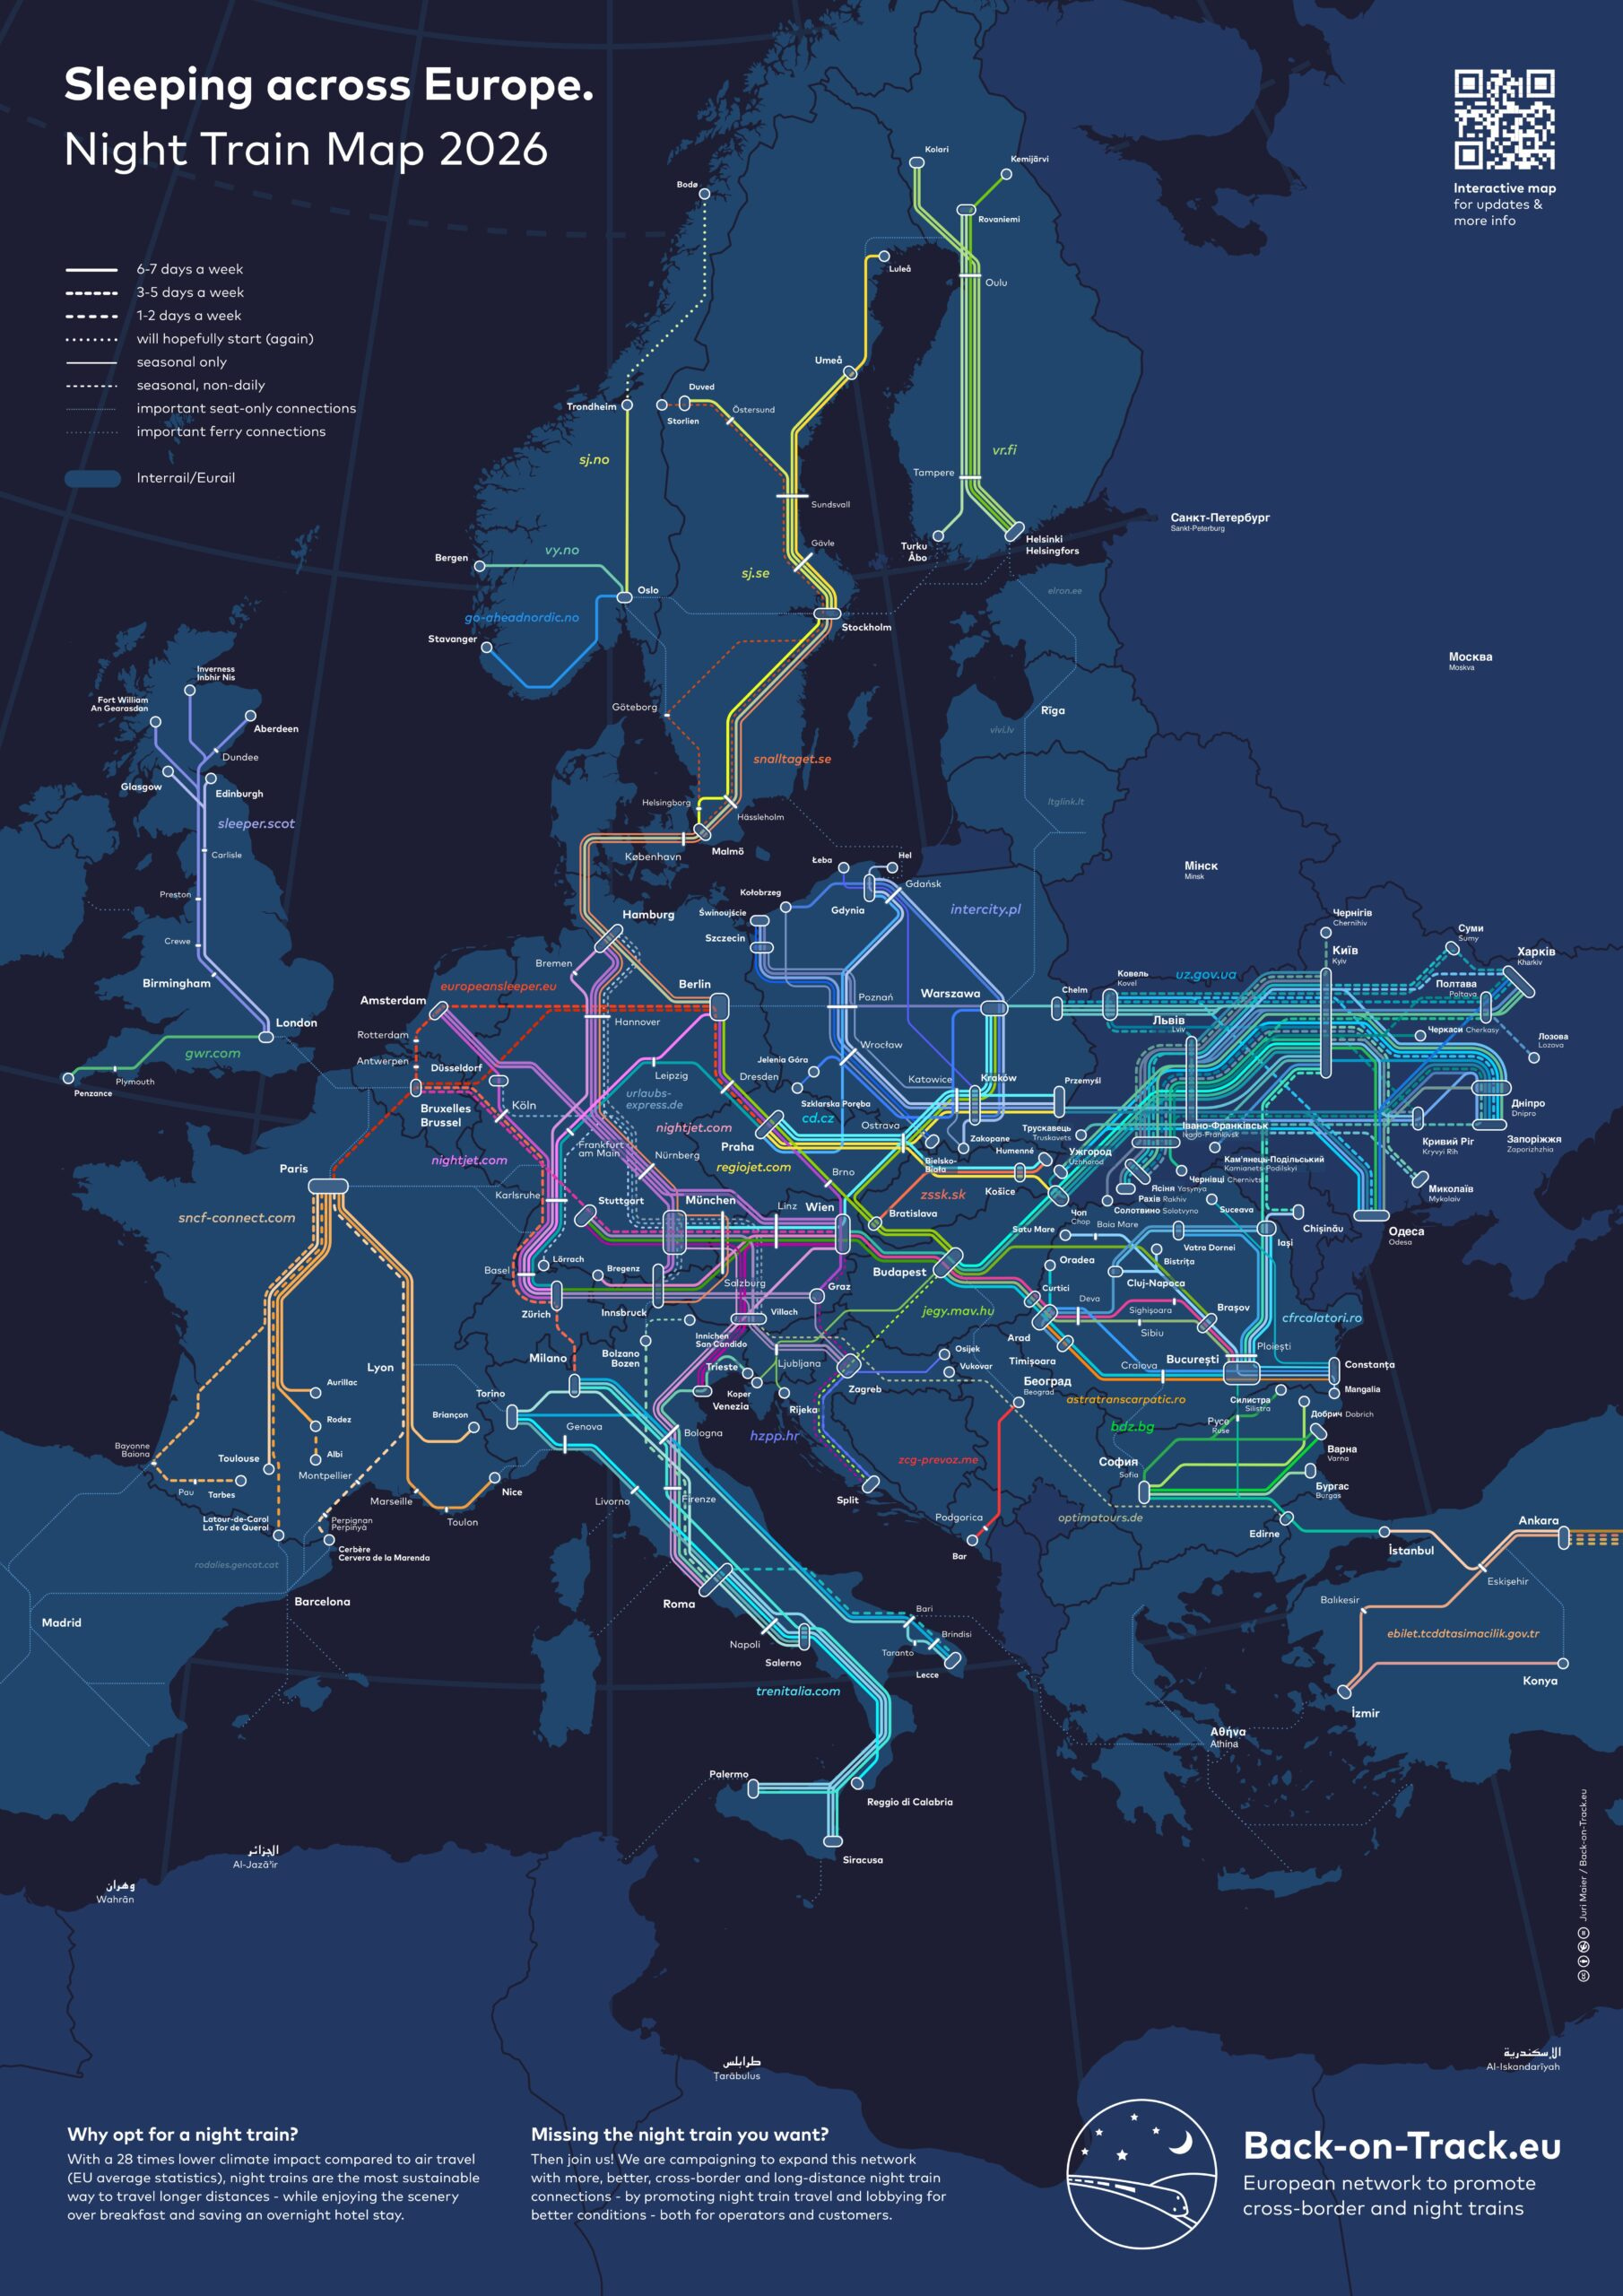
Back-on-Track.eu has launched an interactive 2026 European night train map tracking 205 regular sleeper lines, highlighting five new routes alongside ten closures.
That’s it for this week.
I’m always keen to hear from you, so please let me know if you have:
new geospatial datasets
newly published papers
geospatial job opportunities
and I’ll do my best to showcase them here.
Yohan