

🌐 A sharper lens on disaster zones
PLUS: When maps learn to answer questions, the hidden heat from AI data centres and more.

Hey guys, here’s this week’s edition of the Spatial Edge — a safe space for map fetishists… The aim is to make you a better geospatial data scientist in less than five minutes a week.
In today’s newsletter:
Disaster Damage: AI assesses buildings after natural disasters.
Map Queries: LLMs make spatial databases conversational.
Data Heat: AI infrastructure warms nearby landscapes.
Satellite Labels: MAPLE teaches AI land-cover hierarchies.
Urban Plastics: DURUM tracks microplastics in stormwater.
Research you should know about
1. A sharper lens on disaster zones
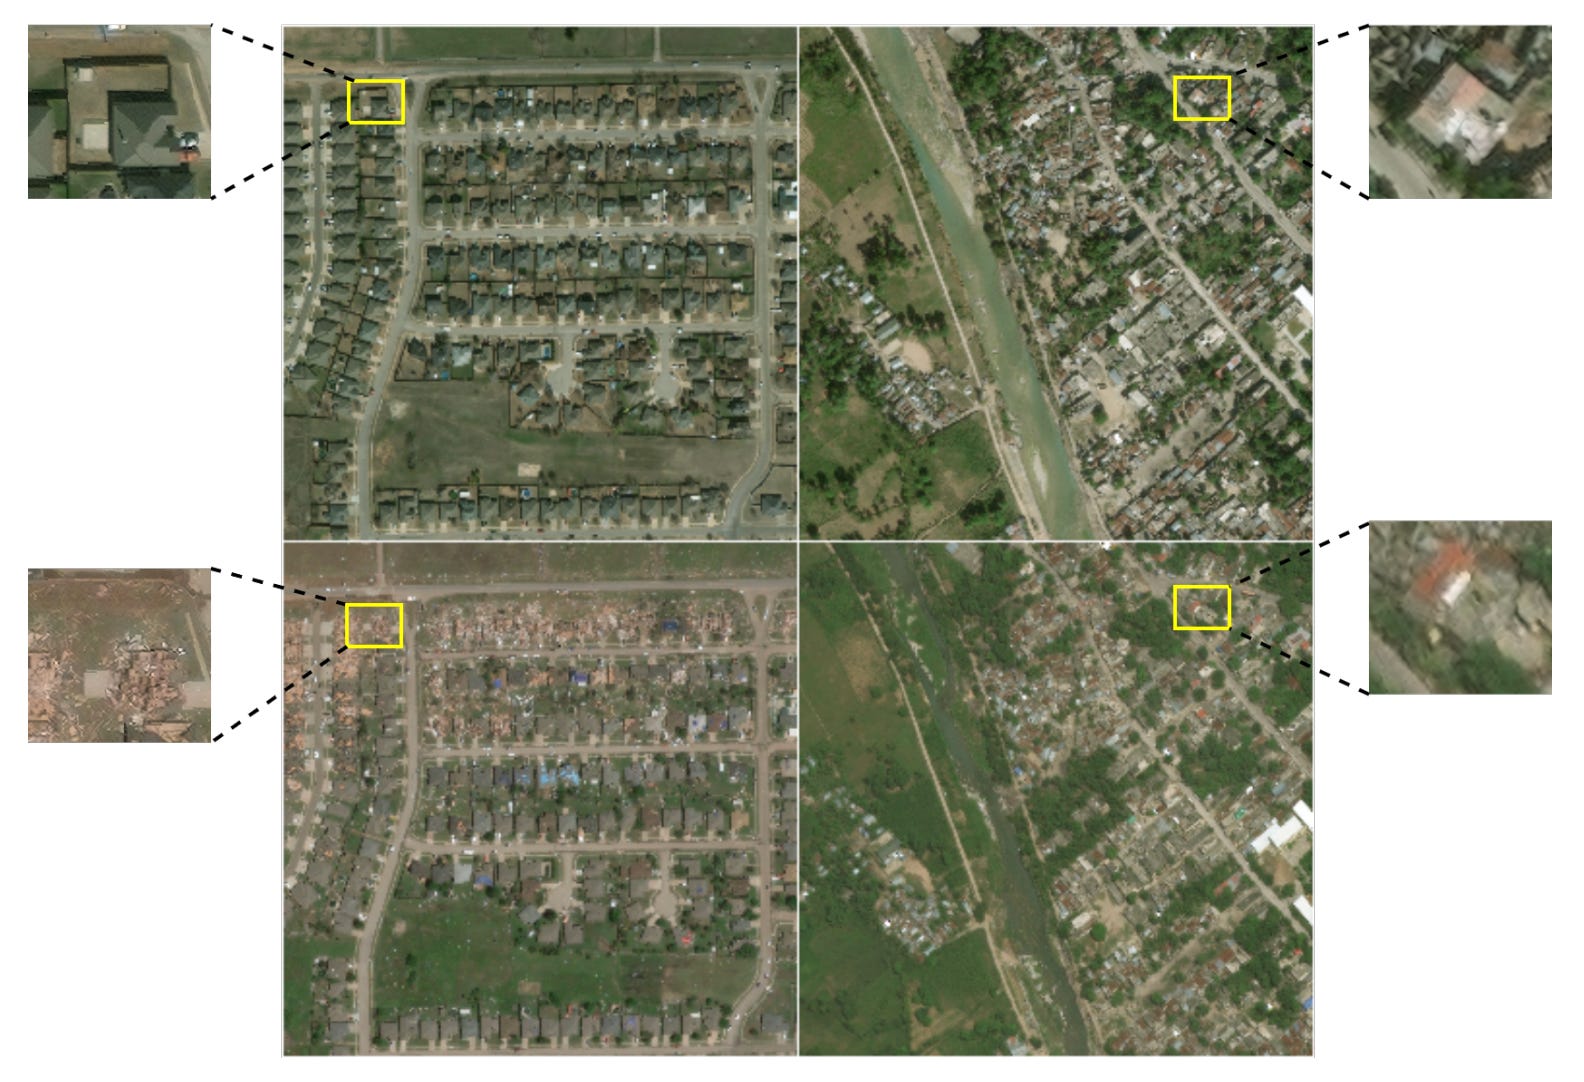
A new study introduces a three-step AI framework designed to improve how we assess building damage from space. When a natural disaster strikes, quickly figuring out which buildings are destroyed is pretty important for sending rescue teams to the right places. However, the satellite imagery used for these assessments is often blurry or full of noise, which makes it pretty difficult for automated systems or even human experts to spot crucial details like collapsed roofs or cracked walls. Traditional object detection models can spot buildings but fail to interpret the severity of the damage, while newer Vision-Language Models (VLMs) can analyse scenes but often get confused and ‘hallucinate’ when looking at low-resolution photos.
To overcome these limitations, researchers from Dakota State University built a hybrid pipeline and tested it against the xBD dataset, a massive benchmark collection of satellite images covering various global disasters. The new framework tackles the problem in three steps. First, it uses a Video Restoration Transformer to artificially upscale the low-resolution satellite images, quadrupling their size to make structural details stand out. Next, it uses a YOLOv11 object detection model to draw precise boxes around every building in the image and crops them out. Finally, these high-resolution cropped images are fed into several different VLMs, which act as a ‘jury’ to assess the damage severity of each building on a four-point scale. By combining multiple models, the system drastically reduces the bias and hallucination risks of relying on just one AI.
When evaluated on imagery of Hurricane Matthew and the Moore Tornado from the xBD collection, the results showed that this multi-stage approach was pretty decent. By upscaling the images first, the VLMs were able to produce much more accurate and semantically rich descriptions of the damage. Furthermore, the team found that the Qwen3 family of models consistently outperformed Gemma3 models, proving to be far more reliable at identifying completely destroyed buildings. Ultimately, this pipeline could provide first responders with a faster way to prioritise rescue efforts without having to set foot in a hazardous area. However, I do remain sceptical about the super-resolution approach…
2. When maps learn to answer questions
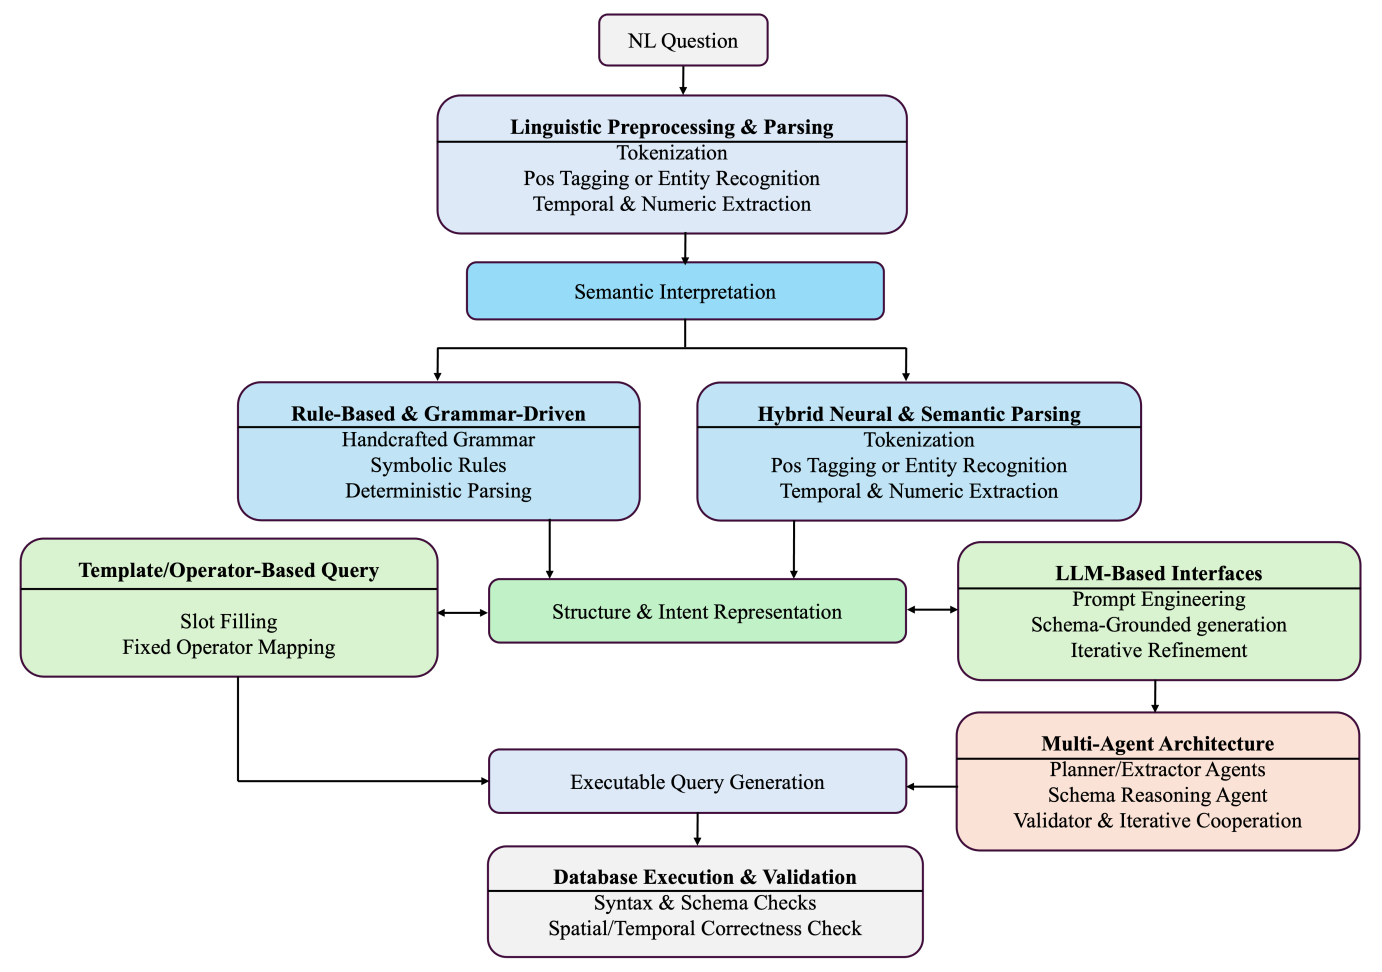
Querying complex geographic or time-based databases usually requires some coding skills. If you want to find all the restaurants within a specific flood zone, you can’t just type that into a search bar and expect a database to understand you. Developers build Natural Language Interfaces to Databases so everyday users can bypass the complex code and just ask questions. A new paper maps out the entire landscape of this highly fragmented field, reviewing everything from the datasets used to the evolution of the algorithms themselves.
The paper breaks down how these systems have evolved across four main categories. Early models relied on strict, handcrafted grammar rules that worked well but struggled with casual or unexpected phrasing. Programmers then moved to hybrid neural networks that learned from data but still relied on rigid templates. Today, the focus has shifted entirely to LLMs and multi-agent systems, where different AI agents collaborate to interpret a query, check the database schema, and write the code. While these modern approaches can be incredibly flexible, they often suffer from geo-hallucination, where the AI invents imaginary spatial relationships or references tables that simply do not exist.
Beyond the models, the review highlights a pretty big issue with the data used to test them. Right now, there isn’t a single, unified benchmark that accurately reflects the messy and ambiguous way real people ask geographic questions. Instead, researchers rely on a mix of highly controlled synthetic datasets and real-world GIS databases that make it nearly impossible to compare different models fairly. Ultimately, the authors conclude that before we can build AI that truly understands space and time, the industry needs to ditch these fragmented tests and create a robust benchmark that accounts for real-world geographic ambiguity.
3. AI’s next environmental problem is heat
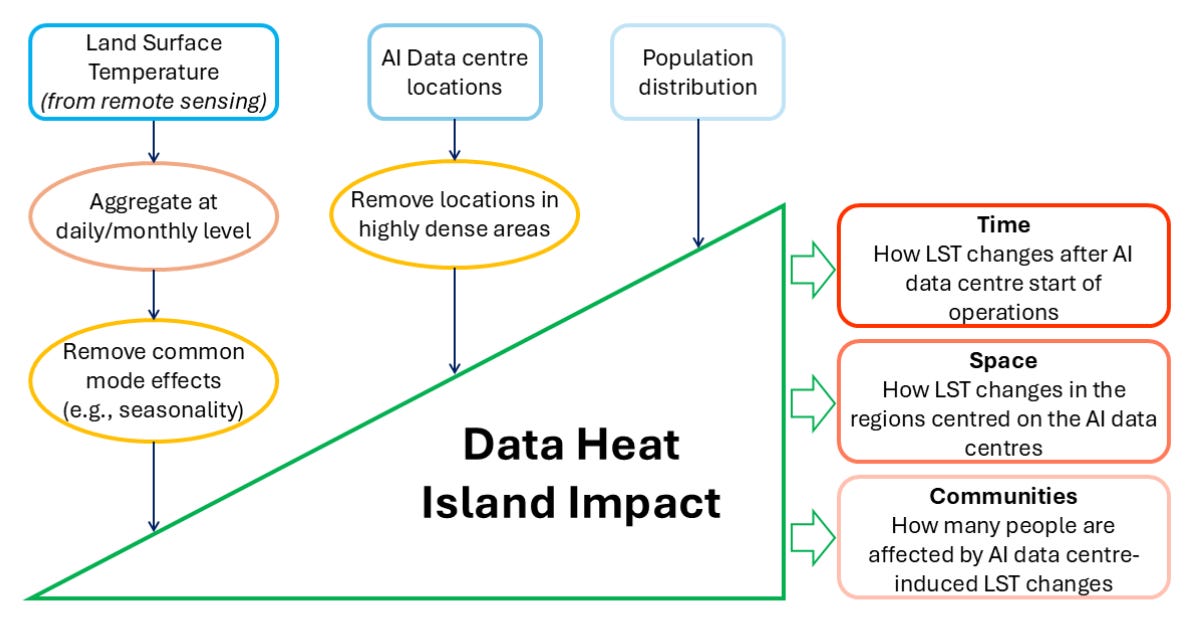
We hear a lot about the massive energy demands of artificial intelligence, but there’s a hidden side effect we rarely talk about: the heat. As tech companies scramble to build massive AI data centres across the globe, these power-hungry hubs are pumping enormous amounts of thermal energy into the atmosphere. To figure out the real-world impact, researchers combined two decades of satellite land surface temperature records with the exact locations of over 8,000 data centres built outside densely populated cities. This allowed them to isolate the specific temperature changes caused by these facilities without getting confused by typical urban warmth.
The data reveals a pretty crazy phenomenon that they call the ‘data heat island effect’. On average, the land surface temperature around a new AI hyperscaler spikes by 2°C right after it starts operating. This warming footprint isn’t just confined to the building itself. The heat ripples outward, raising local temperatures for up to 10 kilometres in every direction. When researchers overlaid this temperature data with global population maps, they discovered that over 340 million people currently live within these artificially warmed zones. It’s a pretty big deal, considering this extra heat places significant stress on local healthcare, energy grids, and water supplies.
Tackling this growing problem requires a mix of smart software and innovative hardware. On the coding side, developers can reduce compute loads by cleaning up messy data before processing or using stuff like carbon-aware token generation to improve efficiency. Physically, engineers are exploring some incredibly interesting tech to keep temperatures down. This includes adiabatic circuitry that actually recycles energy during computation, hybrid liquid cooling systems, and special passive radiative coatings that reflect solar heat away from the buildings. By combining these hardware and software upgrades, the industry has a real shot at keeping our environment cool(er) as AI continues to scale.
4. Teaching AI the family tree of satellite imagery
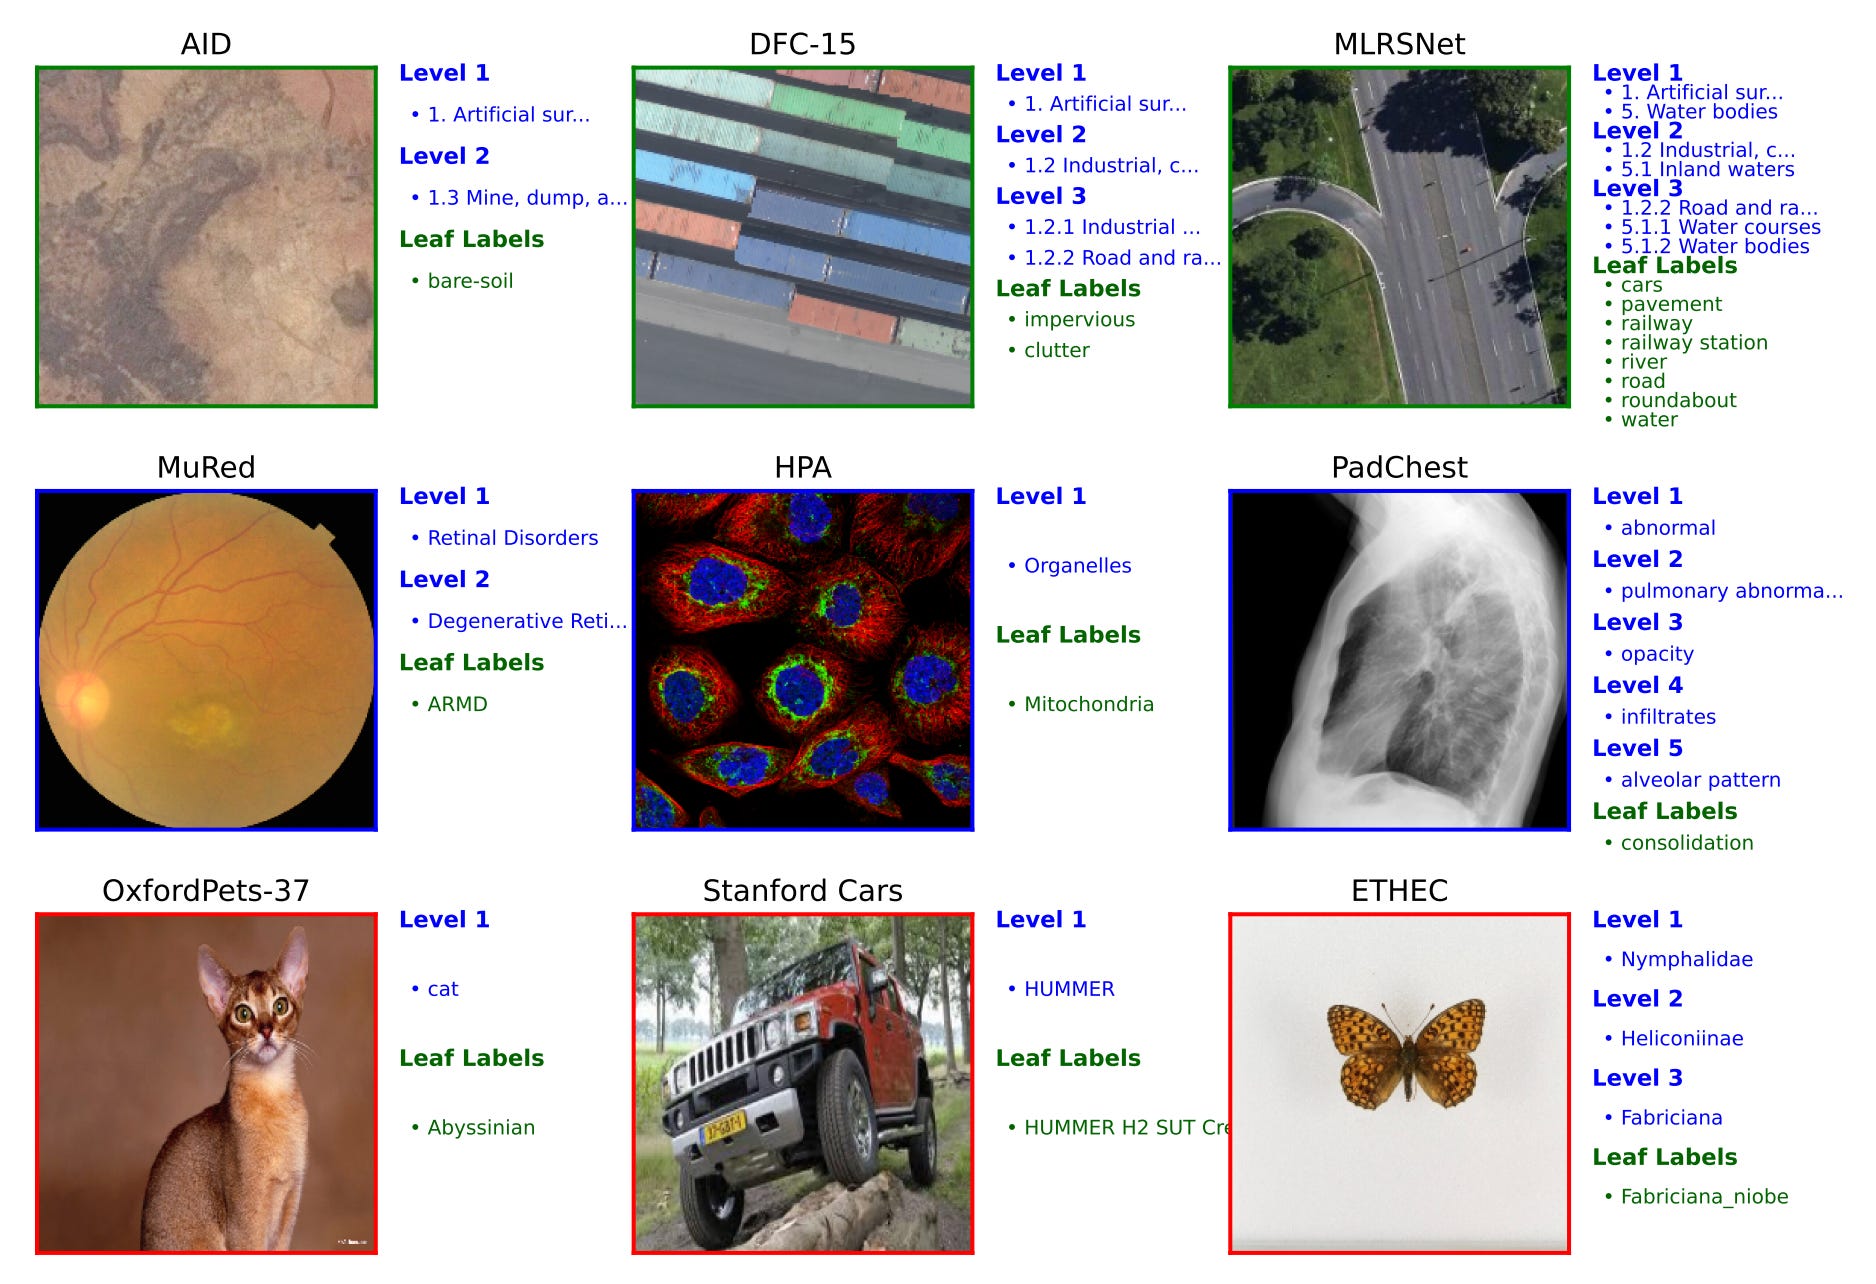
When AI models look at satellite imagery, it’s usually trained to spot flat, isolated labels like a ship, a tree, or a road. But the real world is pretty highly structured, and these labels actually belong to a complex hierarchy. E.g. a ship is part of a port area, which itself is a type of artificial surface. While some models try to learn these hierarchical relationships, they can get confused when a single image contains multiple objects from completely different branches of the taxonomic tree. Furthermore, these older methods are pretty computationally heavy and tend to fall apart when they do not have massive amounts of training data.
A recent paper introduces MAPLE, a new framework designed to solve this multi-path classification problem by explicitly teaching AI the hierarchical structure of remote sensing data. The system starts by feeding the model text-based descriptions of how different land cover types are related, creating a semantic map of the categories. It then uses a Vision Transformer to scan the satellite image and a Graph Convolutional Network to pass information along the branches of the label tree. Finally, it uses an adaptive fusion mechanism to dynamically weigh the visual evidence from the image against the structural rules, ensuring it makes logical predictions across every level of the hierarchy without any manual tuning.
The researchers tested MAPLE across several major remote sensing datasets that were mapped to standard land-cover classifications. The results were pretty impressive, particularly when the model was given very little data to learn from. In these restricted scenarios, MAPLE outperformed standard classification baselines by up to 42%, proving that understanding the relationships between categories gives models a massive head start. Interestingly, it achieved these gains while adding only a tiny 2.6% increase in computational overhead. The framework also proved quite effective at reducing dumb mistakes between tricky categories, making it a robust and highly efficient tool for Earth observation.
Geospatial Datasets
1. Wind tunnel gas dispersion dataset

The RED:VAPOR dataset captures gas sensor responses to vapour plumes in scale-model landscapes, using a wind tunnel fitted with both low-cost and advanced sensors to map synthetic gas dispersion across a dense 3D grid under controlled wind conditions. You can access the data here and the code here.
2. Urban runoff microplastics dataset

The Dataset of Urban RUnoff Microplastics (DURUM) brings together 180 urban stormwater microplastic sampling efforts across 15 countries from 2018 to 2024, covering runoff from streets, residential catchments, and industrial areas. You can access the data here and the code here. You can access the data here and the code here.
3. Multi-sensor EO dataset

The BigEarthNet.txt dataset provides more than 464,000 co-registered Sentinel-1 and Sentinel-2 satellite images paired with detailed textual descriptions, with nearly 9.6 million annotations covering land-use classes, spatial relationships, and visual question-answering pairs. You can access the data here.
4. Global soil water isotope dataset

This new dataset provides a harmonised global collection of soil-water stable isotope records from 1975 to 2024, bringing together more than 27,000 records from 463 observation sites across 37 countries and organising them into standard soil-depth intervals. You can access the data here.
Other useful bits
While AI is often discussed in terms of its environmental footprint, DINOv3 is also being used for nature restoration finance. The model uses computer vision to count individual trees and measure canopy height from satellite imagery, helping investors verify local restoration projects at lower cost and direct funding towards farmers and communities.
For the first time in history, agricultural field boundaries have been mapped at a global scale. The 10-metre resolution dataset is publicly available at no cost and can be explored through the FTW Explorer.
Google Earth has just released an update that allows users to import Shapefiles and 3D models directly onto its real-world canvas. This improvement enables us to render industry-standard data as cloud-native layers, and they’ve even added elevation profiles to the measure tool to help you easily visualise detailed terrain data.
Jobs
Yale University is looking for a GIS Research Specialist based in Connecticut.
NTT Data is looking for a Esri/ArcGIS Specialist based in Arlington.
BP is looking for a Senior GIS Specialist based in Denver.
TomTom is looking for a Staff UX Designer under their Map Visualisation team based in Amsterdam.
Esri is looking for a remote GIS Project Manager under their Assessment Department based in Canada.
Just for Fun

A research team aboard the Polarstern icebreaker has discovered a small, uncharted island in the Weddell Sea after sailing into a mysterious “danger zone” that was previously hidden from all nautical maps.
That’s it for this week.
I’m always keen to hear from you, so please let me know if you have:
new geospatial datasets
newly published papers
geospatial job opportunities
and I’ll do my best to showcase them here.
Yohan