


Hey guys, here’s this week’s edition of the Spatial Edge, a place where all your layers line up first time. Anyway, the aim as usual is to make you a better geospatial data scientist in less than five minutes a week.
In today’s newsletter:
Mining Threats: A third of mining land overlaps conservation priorities.
Food Security: El Niño amplifies the impact of food price spikes.
Fire Weather: Hourly fire danger reveals sharp local risk gradients.
Flood Susceptibility: A global 30 m flood susceptibility map.
Methane Hunting: Planet launches hyperspectral Tanager-2 on Transporter-18.
Research you should know about
1. A third of the world’s mines sit in conservation hotspots
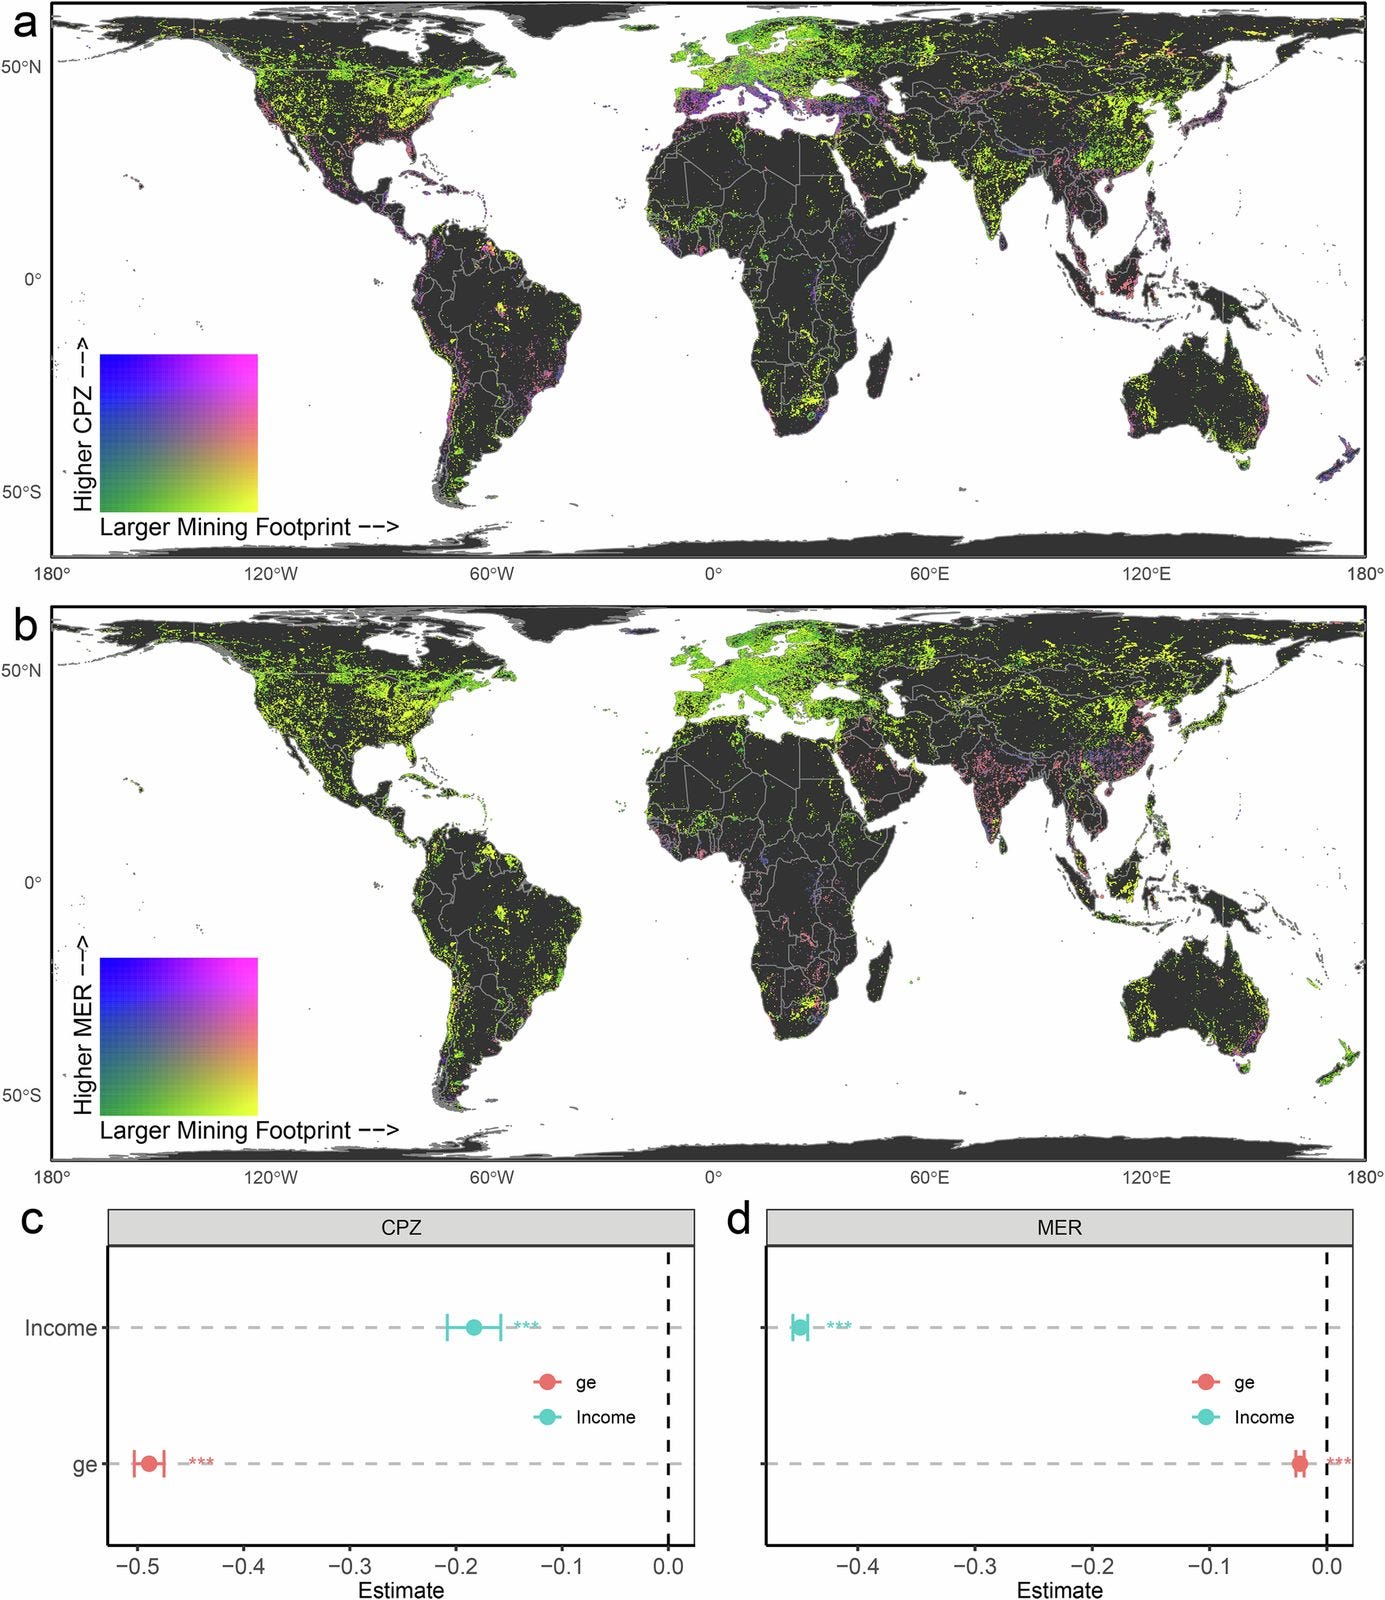
The UN has committed to halting biodiversity loss by 2030, but mining remains a major driver of decline, and its overlap with conservation priorities has, weirdly, never been properly measured. A new study in Nature Communications led by the Naturalis Biodiversity Center and Leiden University maps that overlap globally, both for today’s mines and for land that could be mined in future.
The team overlaid 145,000 km² of current mining land with conservation priority zones and species ranges, then repeated the exercise for land potentially exploitable for metals, non-metals and coal. This shows which species, biomes and ecosystems are exposed now, and where future mining expansion would collide with conservation goals.
About 34% of current mining land (49,000 km²) overlaps conservation priority zones, intersecting the ranges of more than 2,300 species, many of them threatened. The threats span 14 biomes, with disproportionately high relative impacts in fragile ecosystems like mangroves and the Mediterranean. Looking ahead, 43% of land potentially exploitable for metals (12 million km²), 29% for non-metals (2 million km²) and 37% for coal (4 million km²) also overlaps these zones. The authors pitch the maps as a way to align mining with the Kunming-Montreal biodiversity targets.
2. How El Niño changes the impact of food price spikes
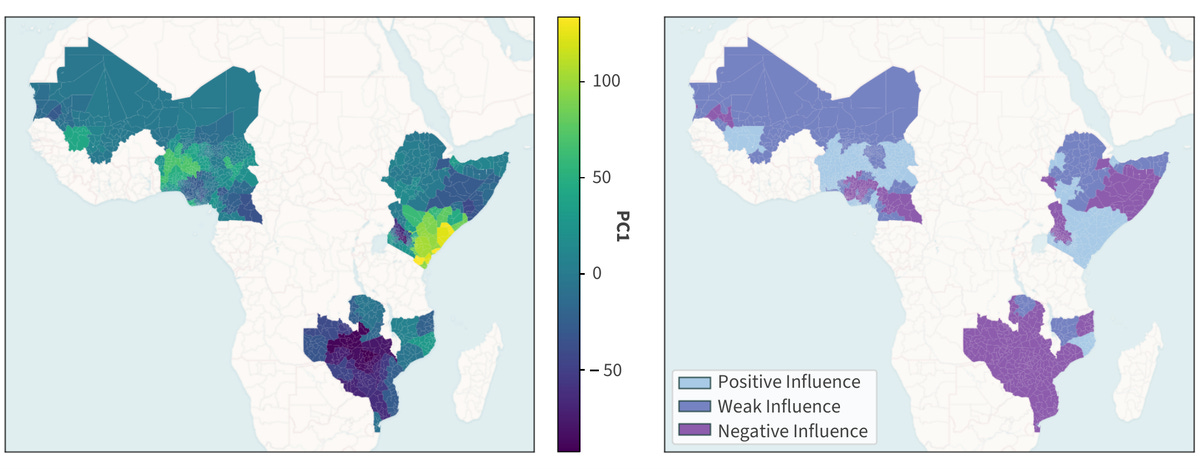
Food price spikes push people into hunger, but the damage isn’t the same everywhere, and early-warning systems rarely account for slow-moving climate patterns like El Niño. A new study from the Universitat de València, Wageningen University and the EU’s Joint Research Centre asks whether El Niño’s influence on vegetation changes how hard price spikes hit food security in sub-Saharan Africa.
They grouped 222 regions in 11 countries by how El Niño affects their vegetation, then estimated the causal effect of price spikes on food insecurity in each group using double machine learning. The groups come from a Granger-causal PCA on 20 years of MODIS NDVI and the Niño 3.4 index, splitting regions into those where El Niño suppresses vegetation, boosts it, or has little effect. The treatment is WFP’s price-spike indicator, the outcome is next month’s share of people in crisis-level coping, and the models adjust for climate, conflict, displacement and economic factors from September 2020 to February 2024.
In regions where El Niño suppresses vegetation, a price spike raised crisis-level food insecurity by about 5.4 percentage points, against roughly 2 points (not statistically significant) elsewhere. For a typical region of about 1.3 million people, that’s around 70,600 more people in crisis the following month. These regions also start from the highest baseline vulnerability. The practical idea is to use the El Niño state to flag vulnerable regions months ahead, then have responses ready for when prices spike. The code is on GitHub.
3. Why fire danger needs an hourly view
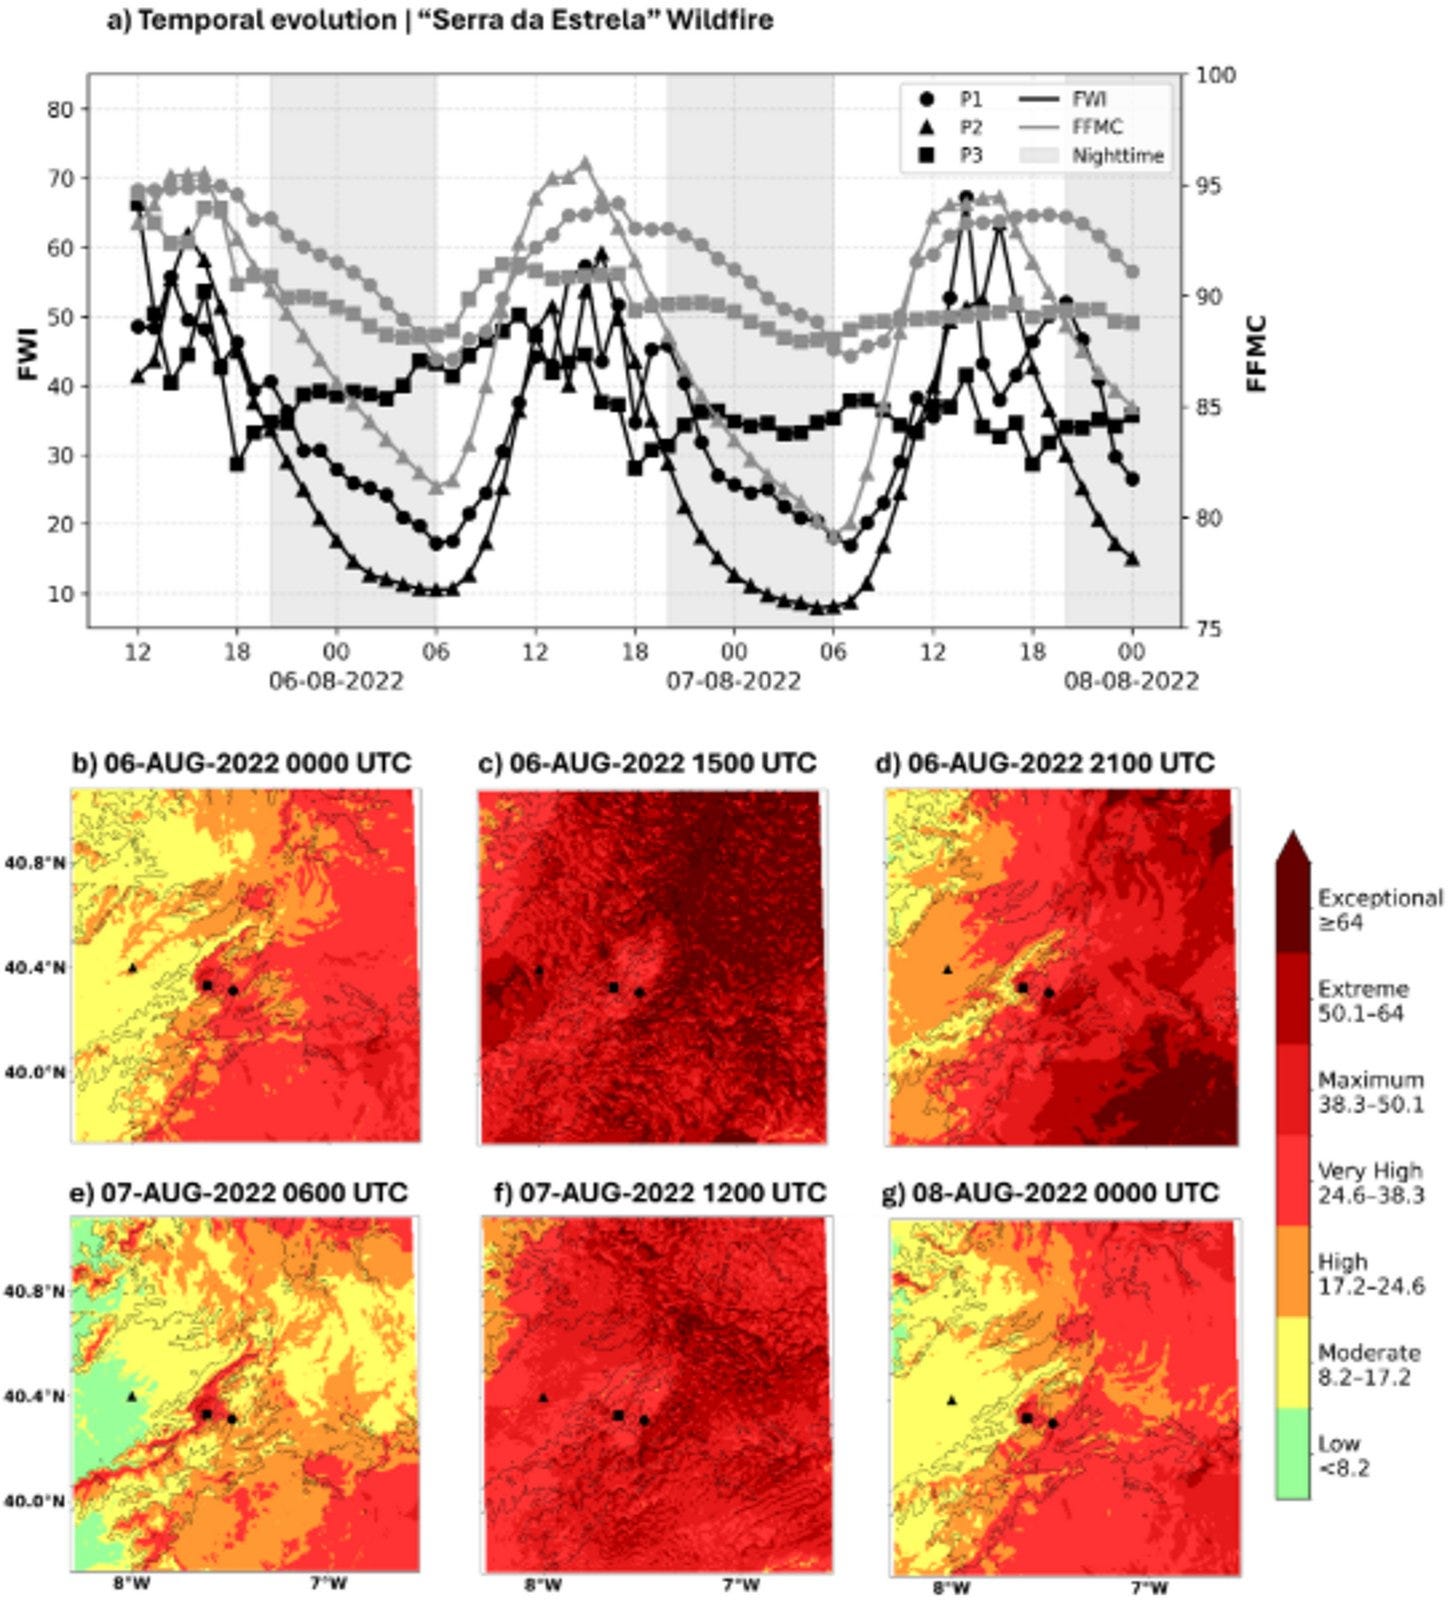
Fire danger ratings usually rely on daily values from coarse weather models, which miss the local, fast-changing conditions that drive how wildfires behave. A new study in Scientific Reports from the University of Évora tests what you gain by computing the Fire Weather Index hourly from high-resolution simulations.
They ran the Meso-NH atmospheric model at 1.5 km and 0.5 km over three periods with active fires in Portugal and Spain, then used the output to calculate an hourly Fire Weather Index. This shows how fire danger shifts within a day, including the Fine Fuel Moisture Code, which tracks how dry surface fuels are.
Hourly fire danger follows a clear daily cycle, and the high-resolution runs capture sea breezes and mountain-driven winds that create sharp local gradients invisible in daily, coarse-resolution products. The authors argue this could be built into Portugal’s operational fire danger system, since its AROME weather model shares the same physics as Meso-NH.
4. An AI agent that balances buildings and terrain in 3D maps
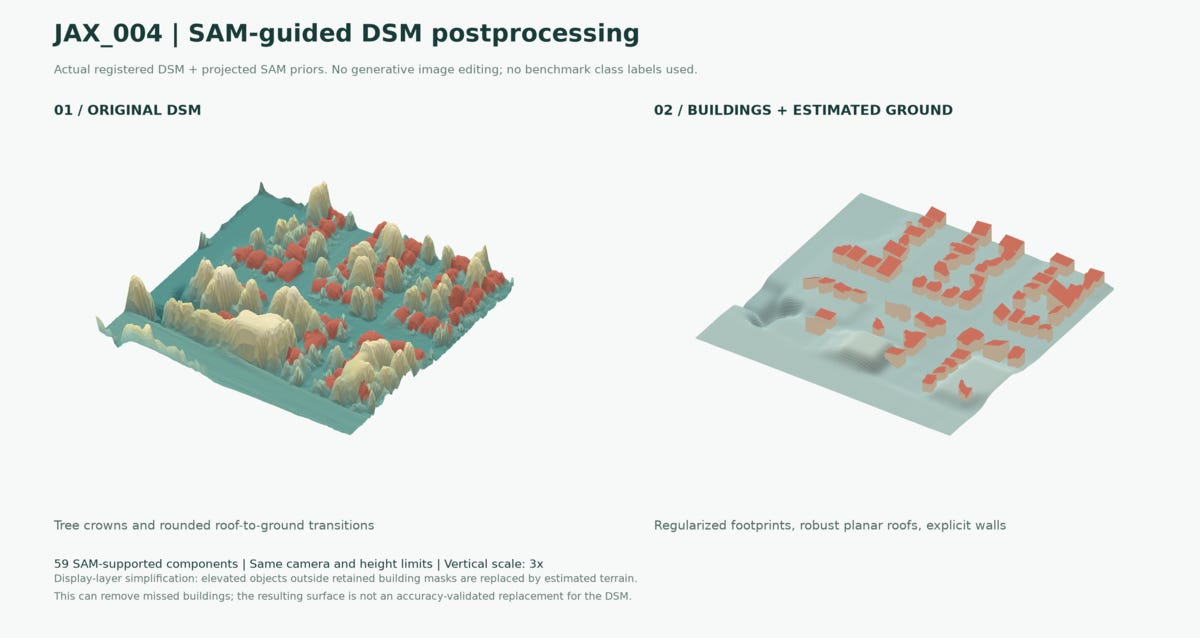
Digital surface models built from satellite images matter for urban planning and digital twins, but there’s a trade-off between getting buildings right and getting the whole scene right. A new study from the University of Waterloo, the University of Calgary and Sun Yat-sen University adds an AI agent to manage that trade-off.
They combined Gaussian splatting for satellite imagery with building masks from the Segment Anything Model, giving building pixels more weight during reconstruction. An agentic controller checks mask quality and validation results, picks between standard and building-focused schedules for each scene, and keeps an audit trail of its decisions. They tested it on four areas from the DFC2019 benchmark.
On the Jacksonville JAX_004 scene, building-focused weighting cut building height error from 0.844 m to 0.806 m (about 4.5%). A staged schedule also nudged full-scene error down from 1.362 m to 1.349 m without losing the building gains. Alongside the surfaces, the system outputs building inventories and decision records, so each reconstruction choice can be checked later.
5. Using Geospatial AI to choose where EV chargers go
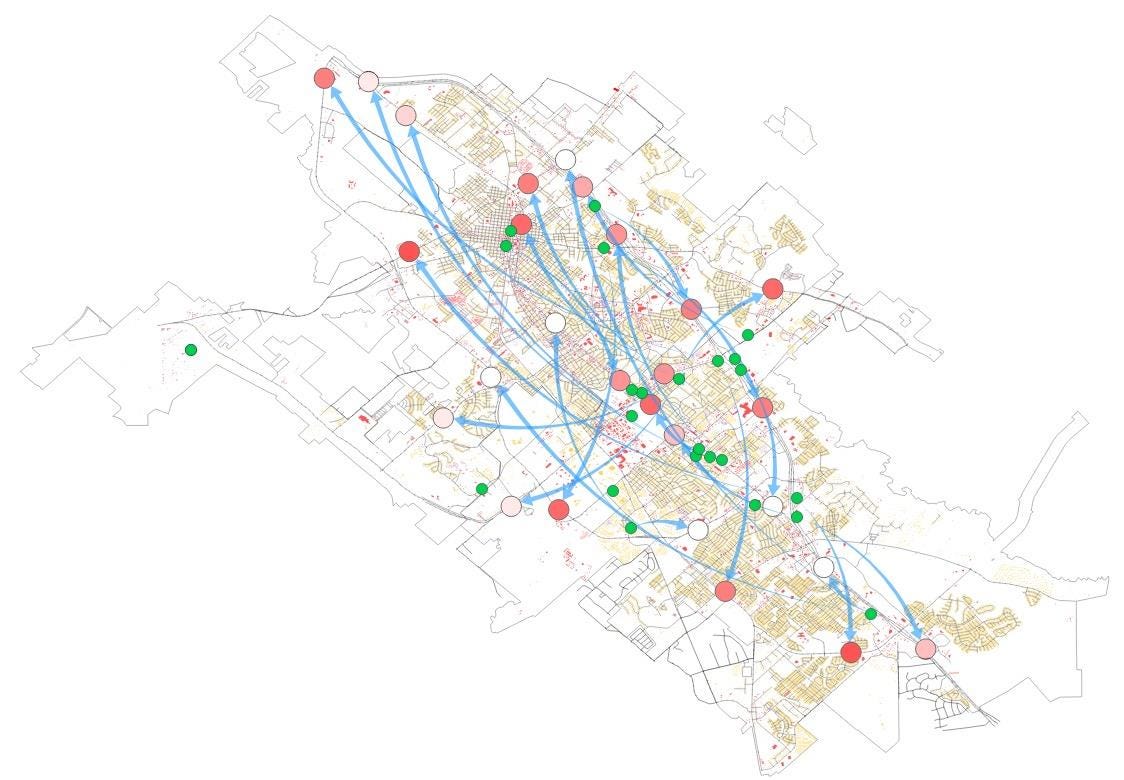
Charging stations are often sited mainly on cost or travel distance, ignoring the land use, population, roads and traffic around them. A new study treats site selection as a geospatial machine learning problem instead.
The authors used a variational autoencoder to compress a large set of EV-related geospatial attributes, then a graph convolutional network to learn how locations relate to one another. Working in Bryan–College Station, Texas, with data on EV usage, land use, population and traffic, the model looks for sites that resemble successful existing stations.
The model separated existing station locations from other sites with an F1-score of 0.87 and identified 27 candidate locations. Two policy scenarios produced different recommendations, which shows the framework can support different planning goals.
Geospatial Datasets
1. A global 30 m flood susceptibility map
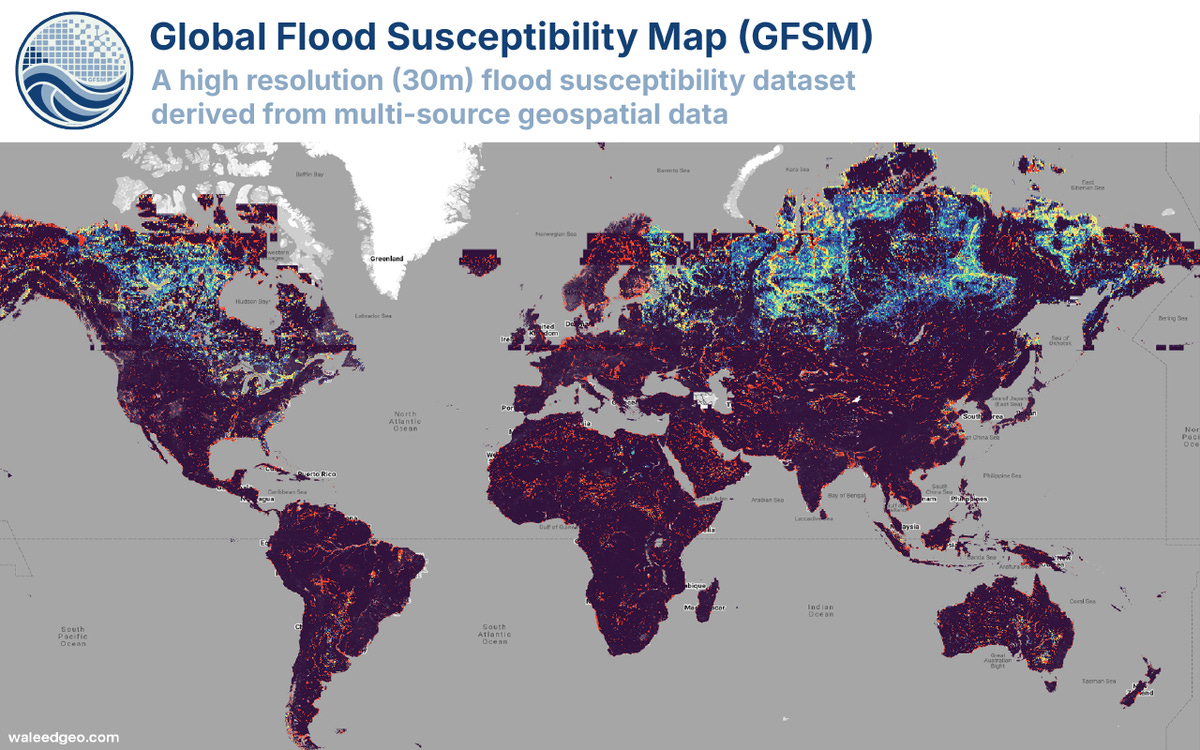
The Global Flood Susceptibility Map (GFSM v1) maps flood susceptibility worldwide at 30 m, using a gradient-boosted tree model trained on about 30 million samples and nine factors like elevation, height above nearest drainage, distance to water and roads, and rainfall frequency. You can access the data here and the code here.
2. Field photos paired with satellite time series across Europe
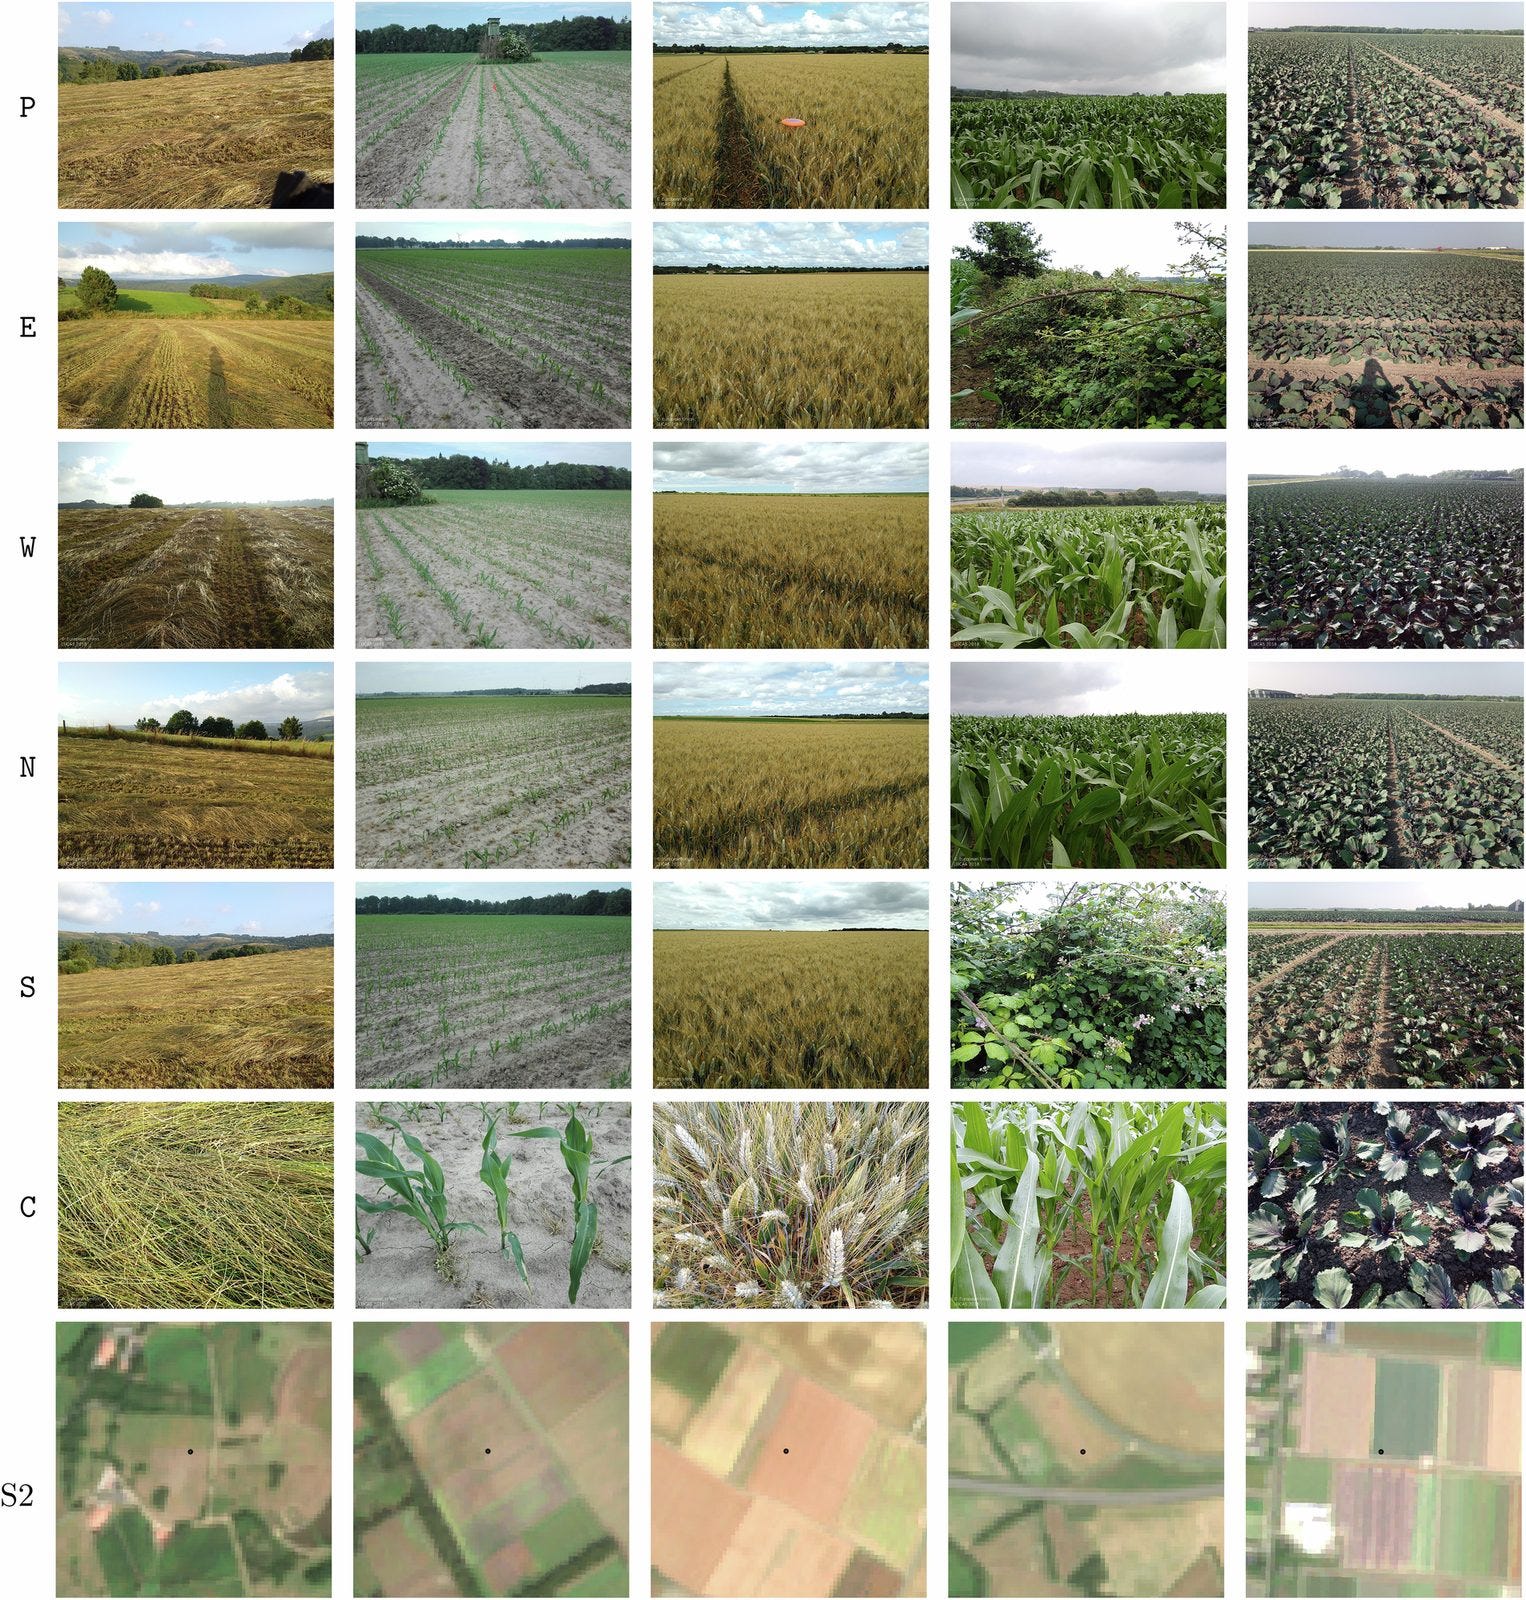
AgroFusion links 211,483 LUCAS field observations from 2018 and 2022 with field photos, monthly Sentinel-2, Sentinel-1 and Landsat-8 time series, ERA5-Land weather, terrain, soil properties and AlphaEarth embeddings. You can access the data here.
3. How intensively US cropland is farmed
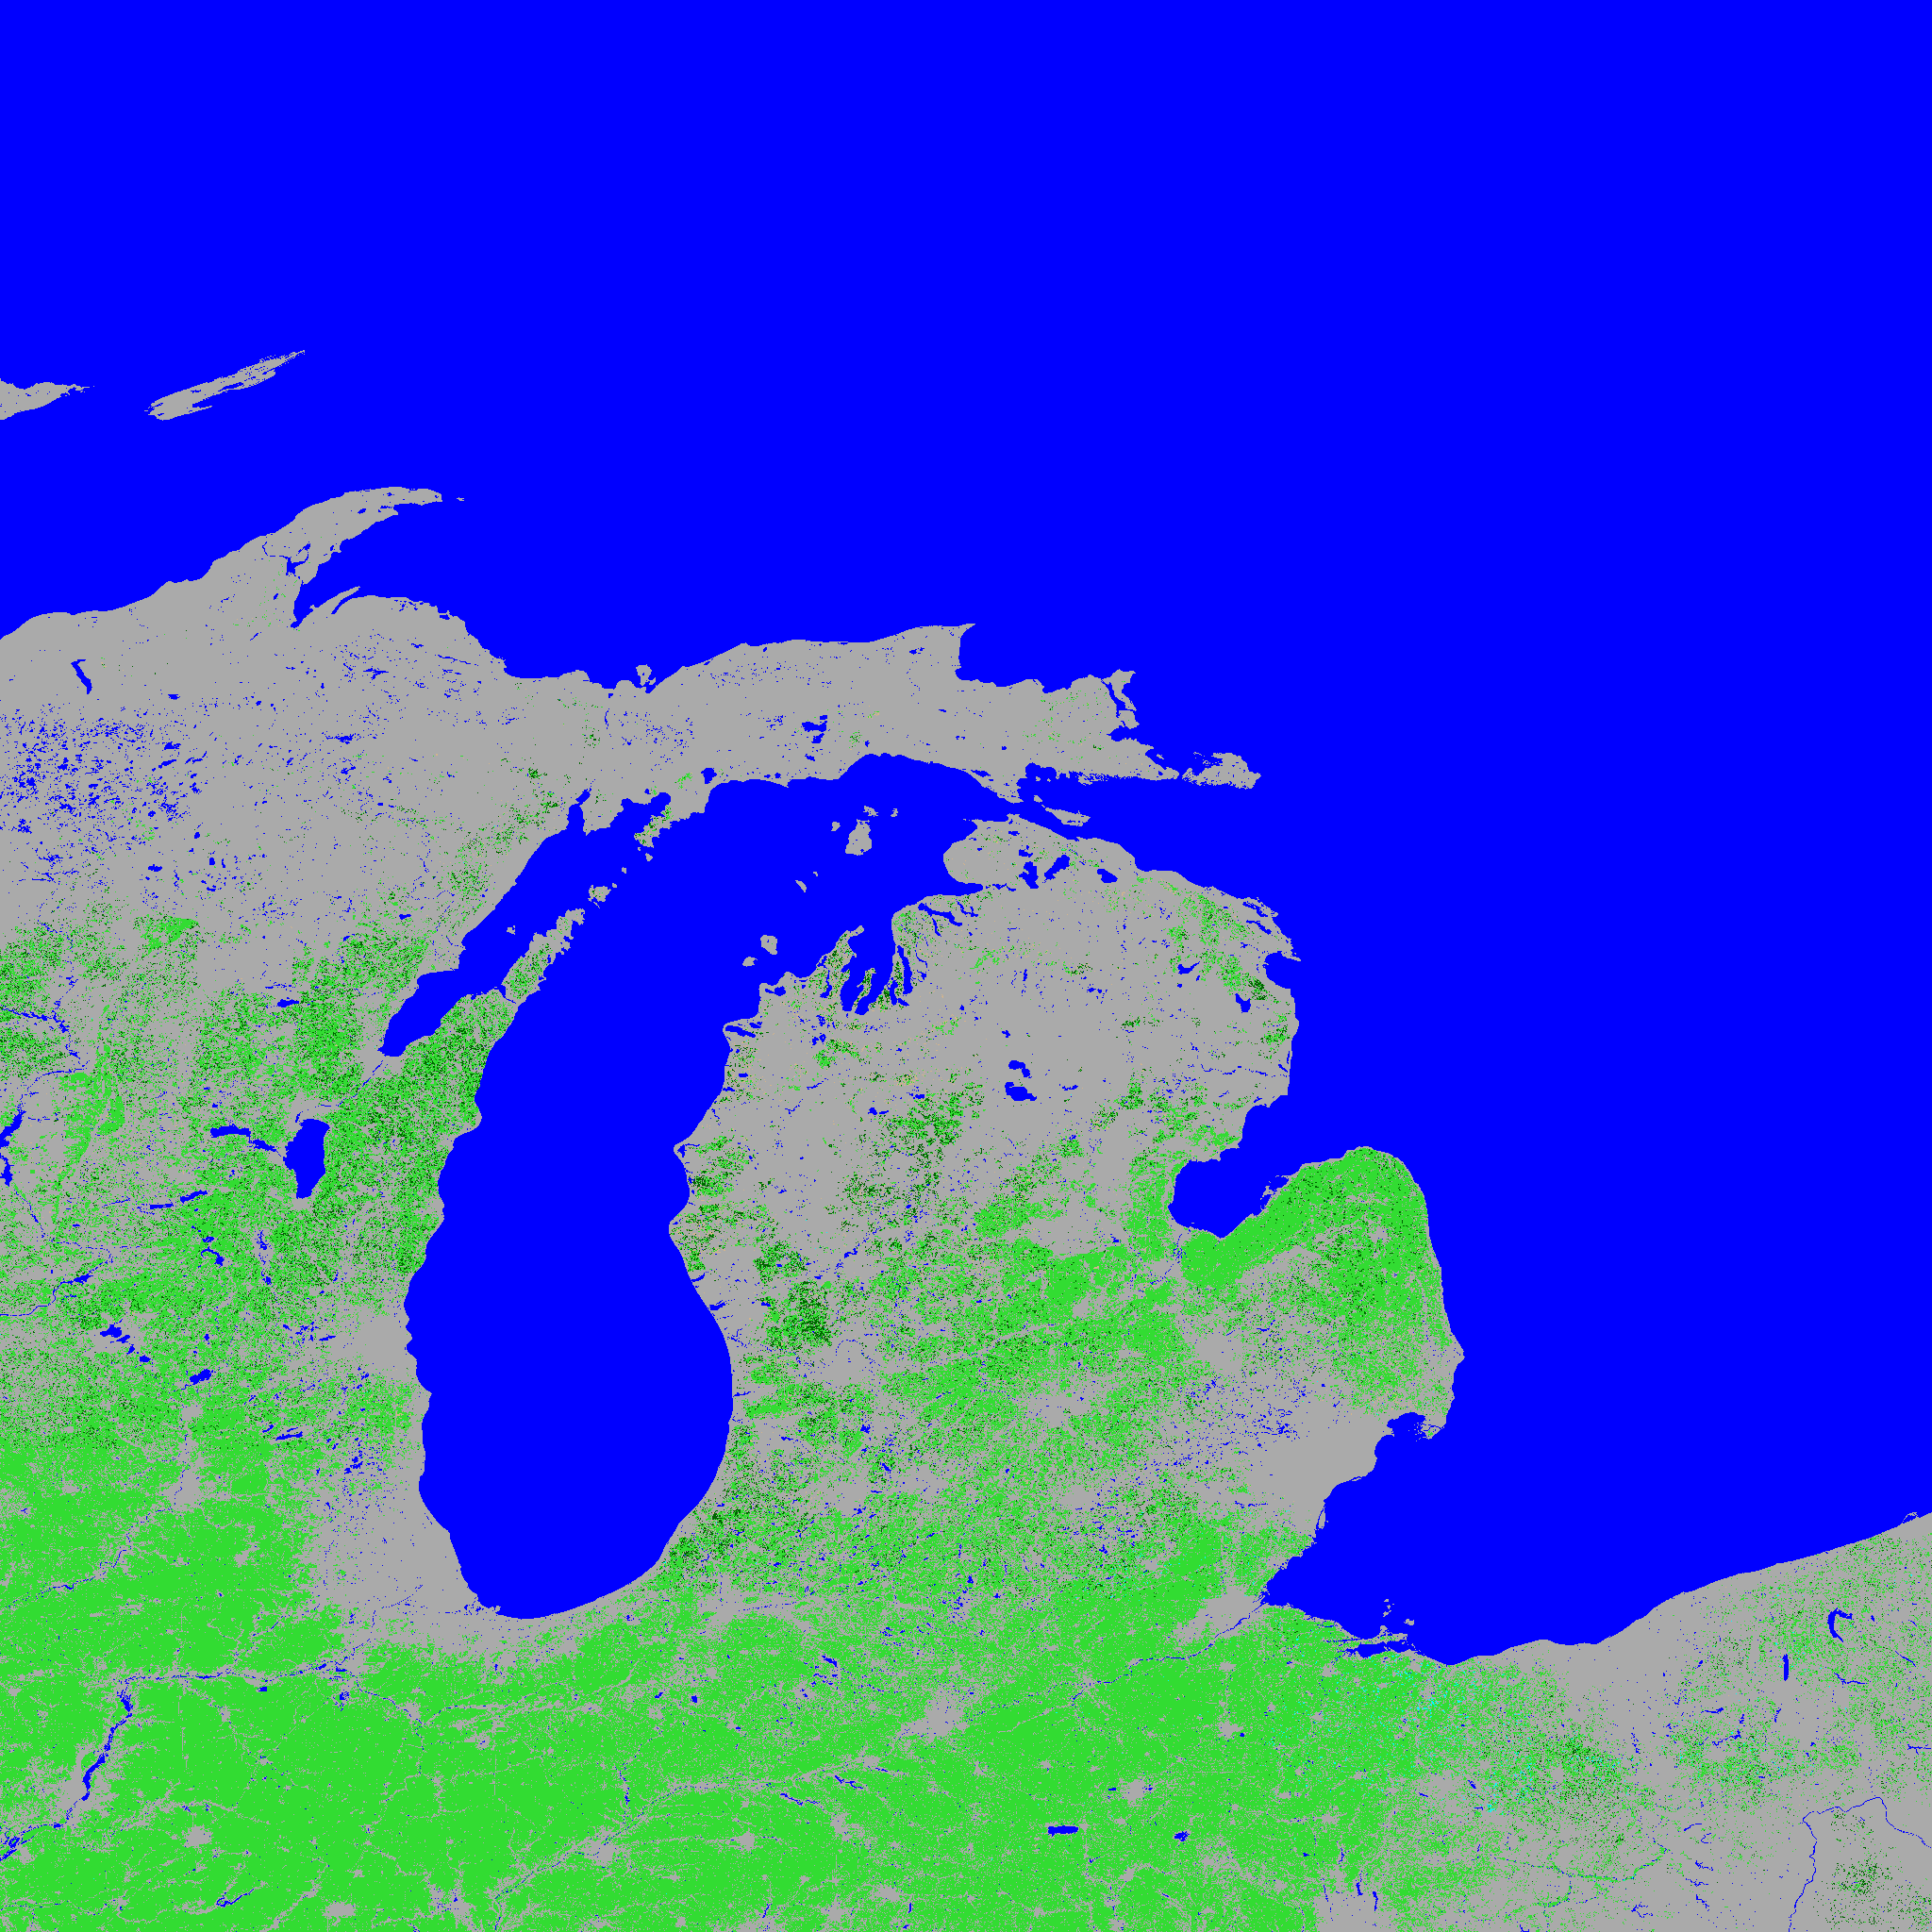
NASA’s LP DAAC and USGS have released the Landsat-derived Global Cropland Intensity Product for the contiguous US, classifying 30 m pixels as single-, double- or triple-cropped, continuous or fallow cropland for a nominal 2020 (2019–2021). You can access the data here.
4. 43 years of hourly European renewables and demand
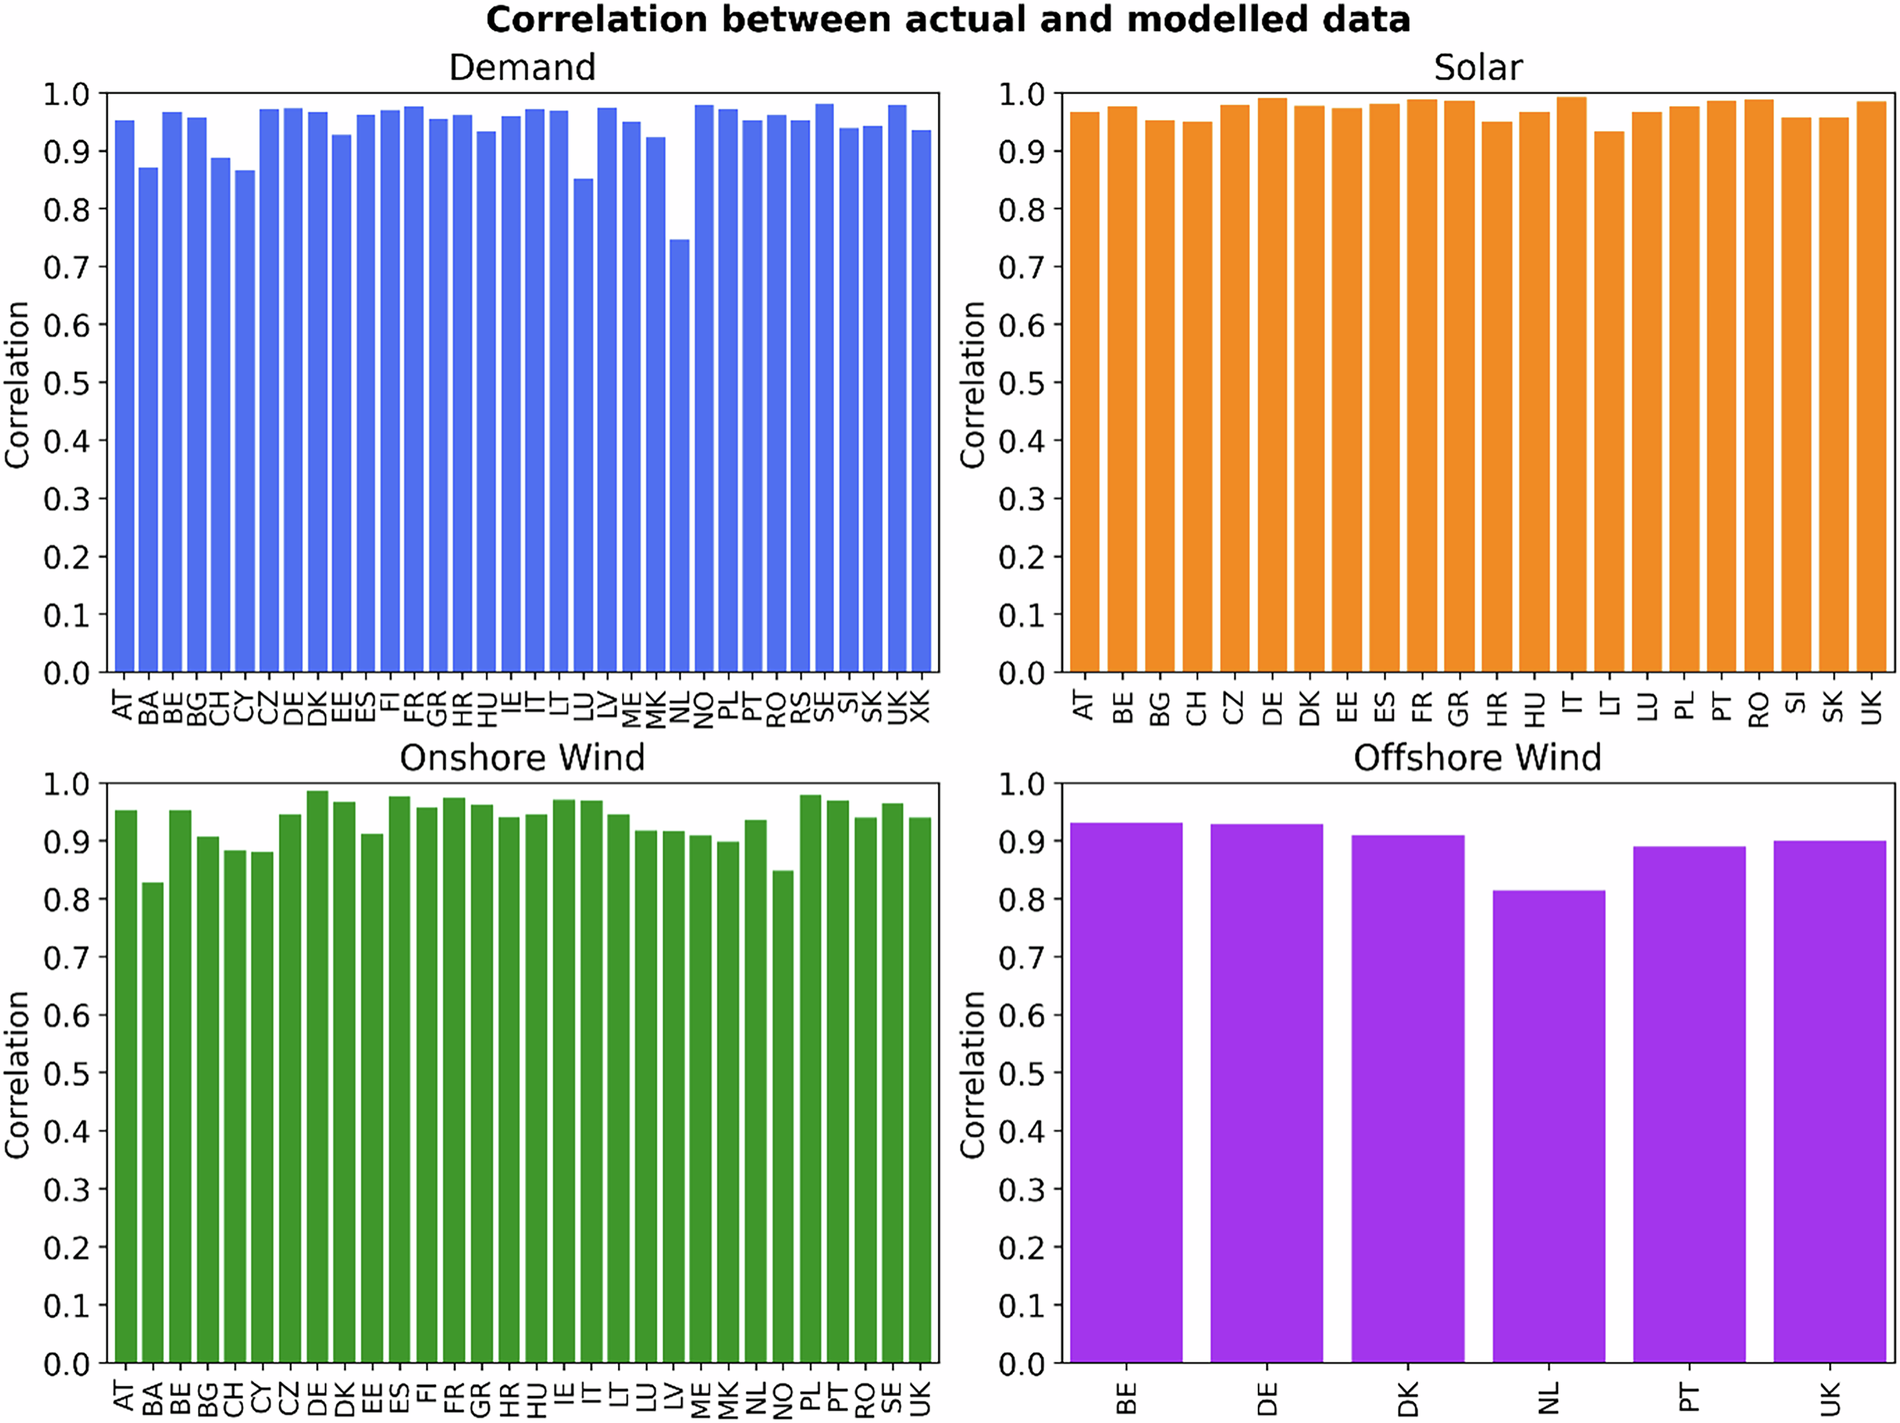
This European renewables and demand dataset uses neural networks to turn 43 years of weather reanalysis into hourly national time series of solar, onshore wind and offshore wind generation and electricity consumption, trained on quality-controlled ENTSO-E data. You can find the paper here.
Other useful bits
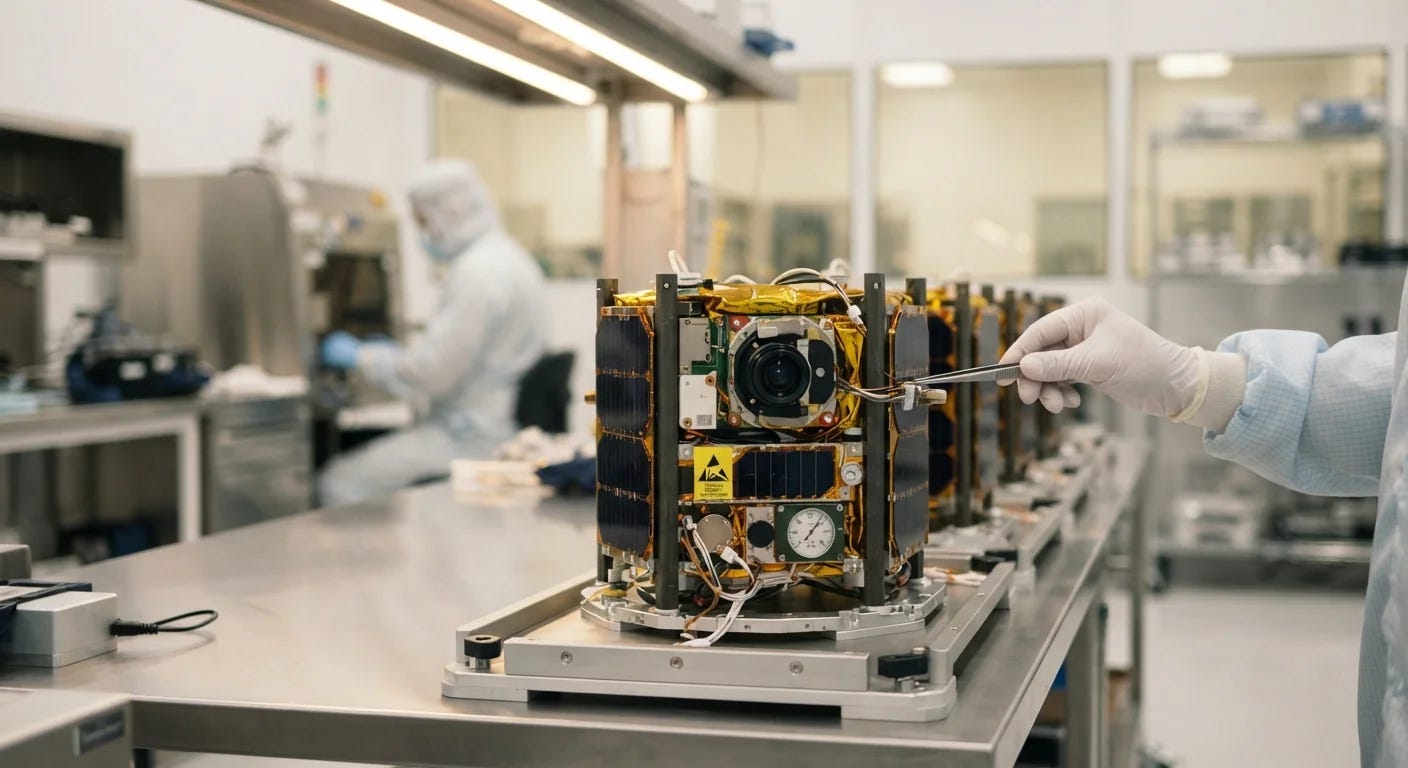
Planet has launched 20 satellites on Transporter-18, including Tanager-2, a hyperspectral satellite built with Carbon Mapper that has 426 bands at about 5 nm spectral and 30 m spatial resolution for spotting methane. The launch also carried 18 SuperDoves and Google’s Project Suncatcher prototype, bringing Planet’s total to 718 satellites delivered to orbit.
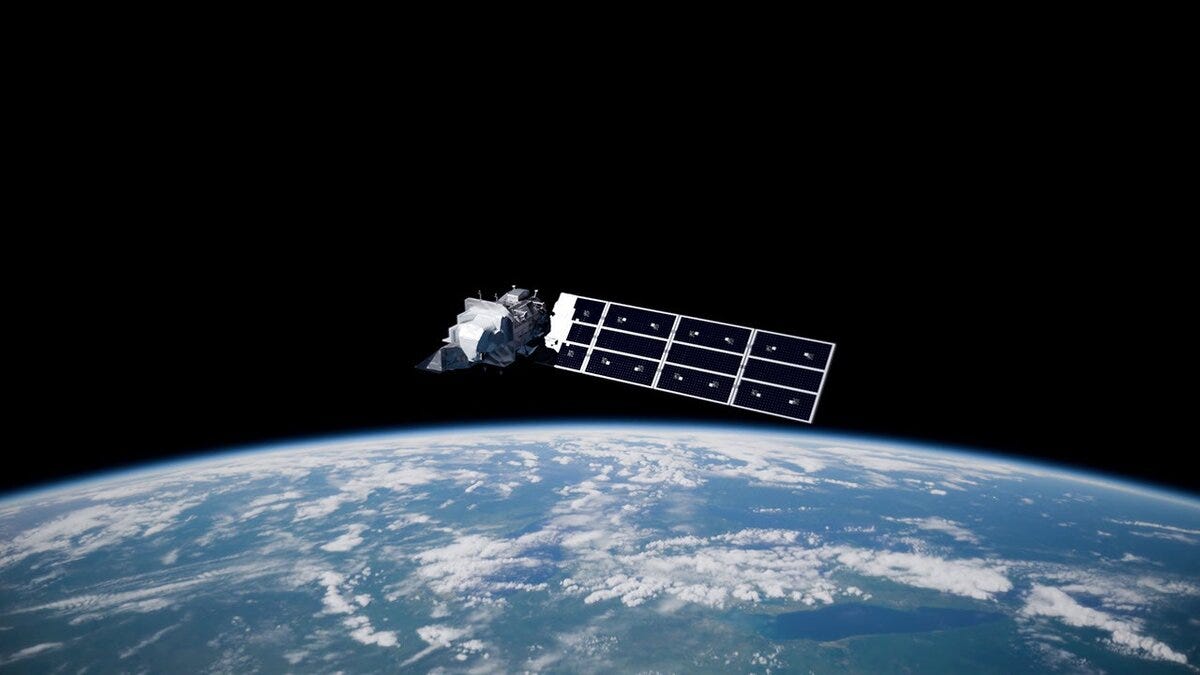
Landsat 9 has completed its five-year design life, reaching the milestone on 27 September, 54 years after Landsat 1 launched. It routinely collects more than 750 images a day, and with Landsat 8 produces about 1,500 scenes daily.
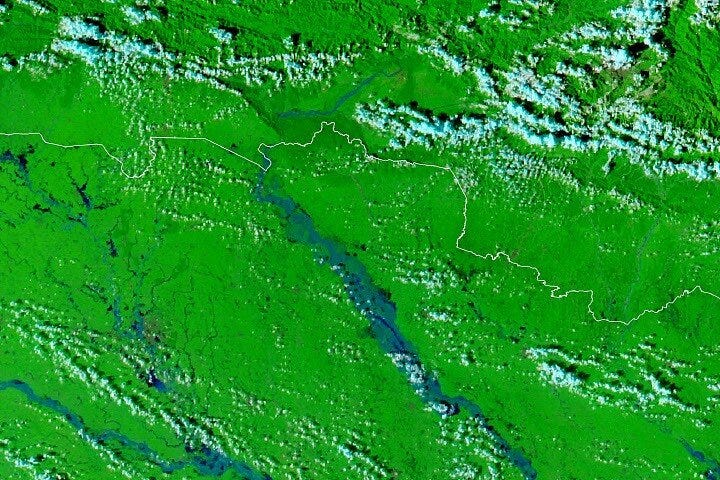
NASA Earth Observatory has mapped record flooding on the Gandak River in Nepal and India, comparing MODIS images from 20 and 29 September. The Devghat gauge in Nepal hit 11.94 m on 27 September, the highest since records began in the 1960s.
NOAA has awarded $67 million over two years to buy commercial radio occultation and ionospheric data for weather and space weather forecasting. Spire receives $33.16 million, PlanetiQ $28.41 million and Ethereal Space $5.48 million, covering 10,000 radio occultation profiles a day.
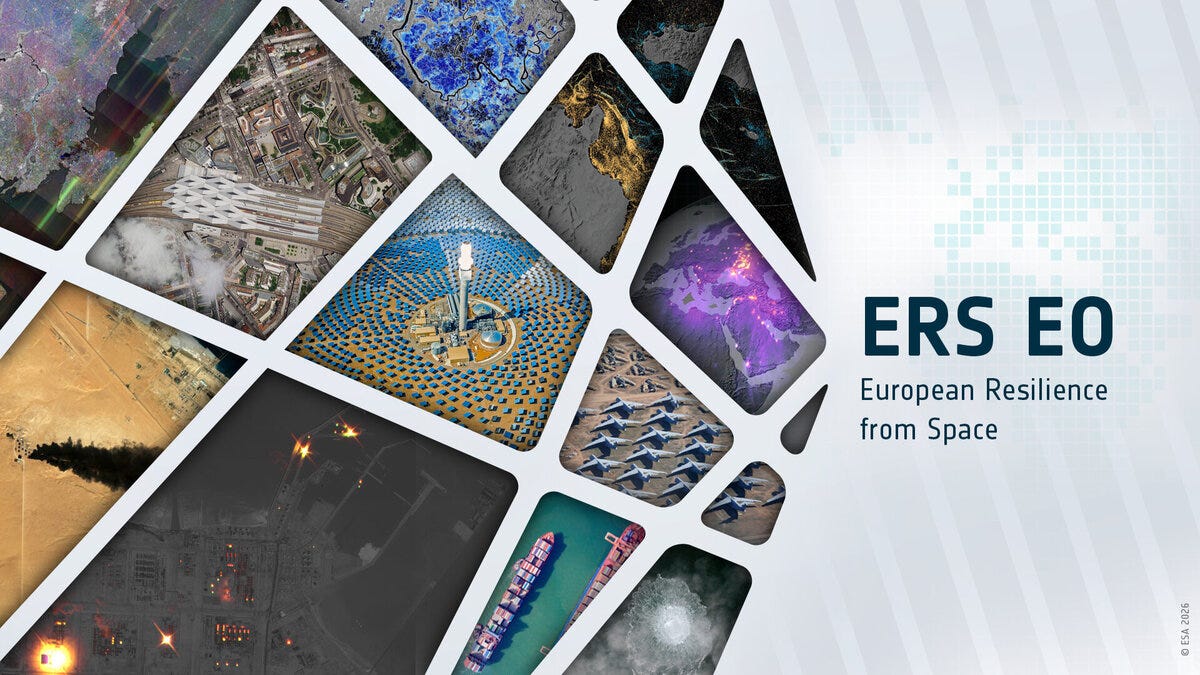
ESA has awarded parallel architecture studies to ICEYE and Leonardo for Europe’s Earth Observation Governmental Service, which is due to start operating in 2028.
Image: ESA.
Jobs
Saint Louis University is looking for a Geospatial Research Scientist based in St. Louis, United States.
VITO is looking for an R&D Professional, AI for Earth Observation based in Mol, Belgium (hybrid).
The Alan Turing Institute is looking for a Senior / Research Associate, AI for Environmental Resilience based in London, United Kingdom.
Institute for the Study of War (ISW) is looking for an ArcGIS Geospatial Researcher based in Washington, DC.
Just for Fun

Max Lenormand, Geospatial Youtube legend, is going all in on making videos on remote sensing data. Make sure you check out his stuff - we’ve gotta get behind all folks trying their heart out to demystify this space!
That’s it for this week.
I’m always keen to hear from you, so please let me know if you have:
new geospatial datasets
newly published papers
geospatial job opportunities
and I’ll do my best to showcase them here.
Yohan