Assessing the accuracy of geospatial foundation models
PLUS: examining the impact of trade agreements, predicting delivery demand for new cities, and more.
Hey guys, welcome to this week’s edition of the Spatial Edge — the only thing on the internet that’s not sponsored by AG1. My goal is to help make you a better geospatial data scientist in less than 5 minutes a week.
In today’s newsletter:
Geospatial foundation models: assessing 50 models for accuracy
Trade agreements: Trade agreements when combined with infrastructure development boost exports by 11.5%.
Predicting delivery demand: New model predicts deliveries in new cities.
Wildfire severity index: Real-time insights from satellite data.
LEAP data catalogue: Earth science data for climate research.
Research you should know about
1. Surveying foundation models in remote sensing
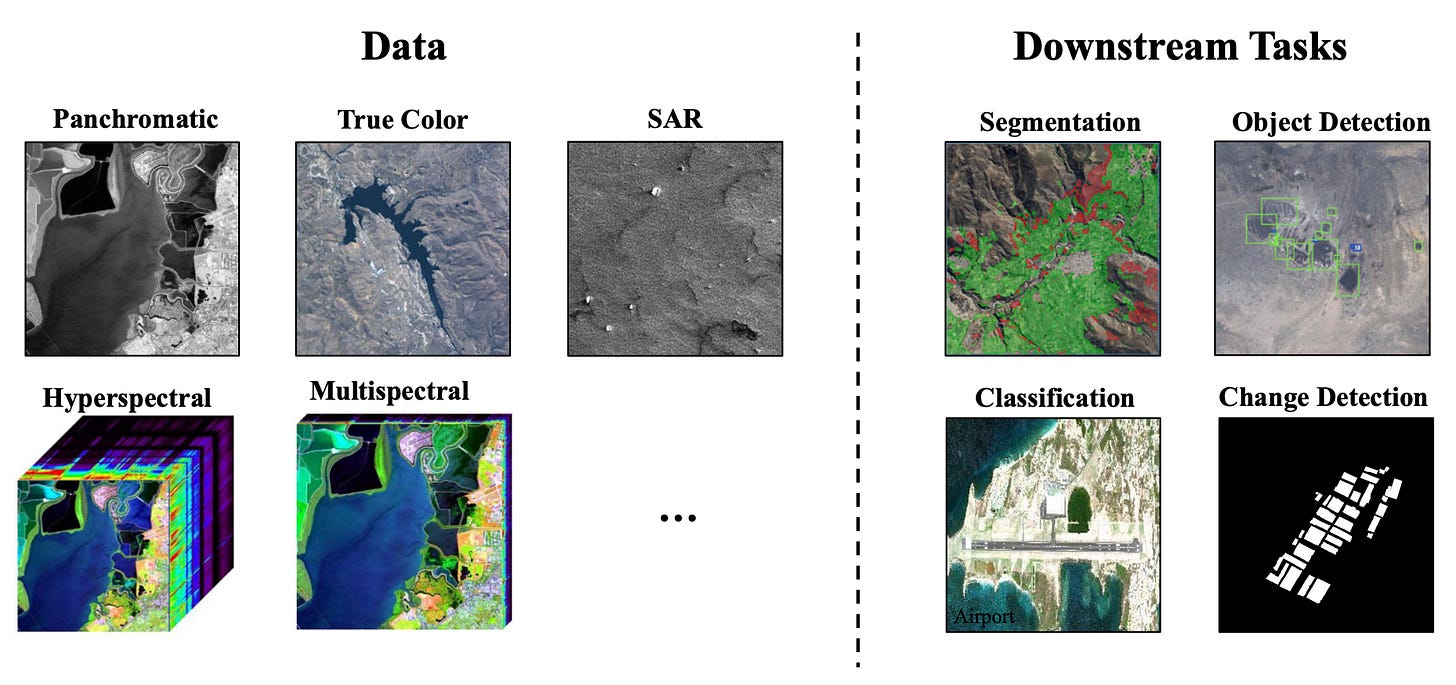
A new study from some folks at Vanderbilt University surveyed the performance of 50 different foundation models in remote sensing that were released between June 2021 - June 2024. Foundation models are all the rage these days—they essentially allow you to do a bunch of things right out of the box (I provide a 101 on foundation models here).
They assess the performance of these foundation models according to:
object detection
change detection
scene classification
semantic segmentation
Some of the better-performing models were:
msGFM (Multisensor Geospatial Foundation Model):
What it does: Excels in scene classification (e.g. identifying different types of land cover like forests, urban areas, and water bodies).
Methodology: Uses a Swin Transformer architecture. This essentially processes images in small patches that can capture both ‘local’ details and the bigger picture of an image.
Training Data: Trained on optical and SAR images from the GeoPile-2 dataset.
Performance: Achieved a mean Average Precision (mAP) of 92.90% on the BigEarthNet dataset, making it one of the best for scene classification.
SkySense:
What it does: Performs really well in both scene classification and semantic segmentation, which involves labelling every pixel in an image with the correct category.
Methodology: It's a multi-modal model, which essentially means it can handle different types of data at the same time—like optical images and radar data. It uses an architecture that processes these different inputs simultaneously.
Training Data: Also trained on GeoPile.
Performance: Achieved an mAP of 92.09% in scene classification on BigEarthNet and a mean F1 score of 93.99% in semantic segmentation on the ISPRS Potsdam dataset.
RVSA (Remote Vision Transformer with Spatial Attention):
What it does: Excels in object detection (e.g. identifying and locating objects like buildings, vehicles, and ships in satellite images).
Methodology: Uses Vision Transformers (ViT) with a spatial attention mechanism. ‘Spatial attention’ essentially helps the model focus on important regions in an image.
Training Data: Trained on the Million AID dataset.
Performance: Reached an mAP of 81.24% on the DOTA dataset, making it one of the best models for object detection.
MTP (Multi-Task Pretraining):
What it does: Performs really well in both object detection and change detection (i.e. identifying changes in images taken at different times).
Methodology: Uses a shared encoder with task-specific decoders. It essentially earns general features from the data and then applies them to specific tasks without needing separate models.
Training Data: Trained on the SAMRS dataset.
Performance: Achieved an Average Precision at 50% overlap (AP50) of 78% on the DIOR dataset for object detection and an F1 Score of 92.67% on the LEVIR-CD dataset for change detection.
CMID (Contrastive Multispectral and Multitemporal Image Denoising):
What it does: Performs well in semantic segmentation and change detection, particularly in handling noisy data like images with clouds or atmospheric interference.
Methodology: Uses contrastive learning, where the model learns to distinguish between similar and different data points. This helps it deal with variations and noise in the data.
Training Data: Trained on the Million AID dataset.
Performance: Achieved a mean Intersection over Union (mIoU) of 87.04% on the ISPRS Potsdam dataset for segmentation.
2. Improving economic integration through trade and infrastructure
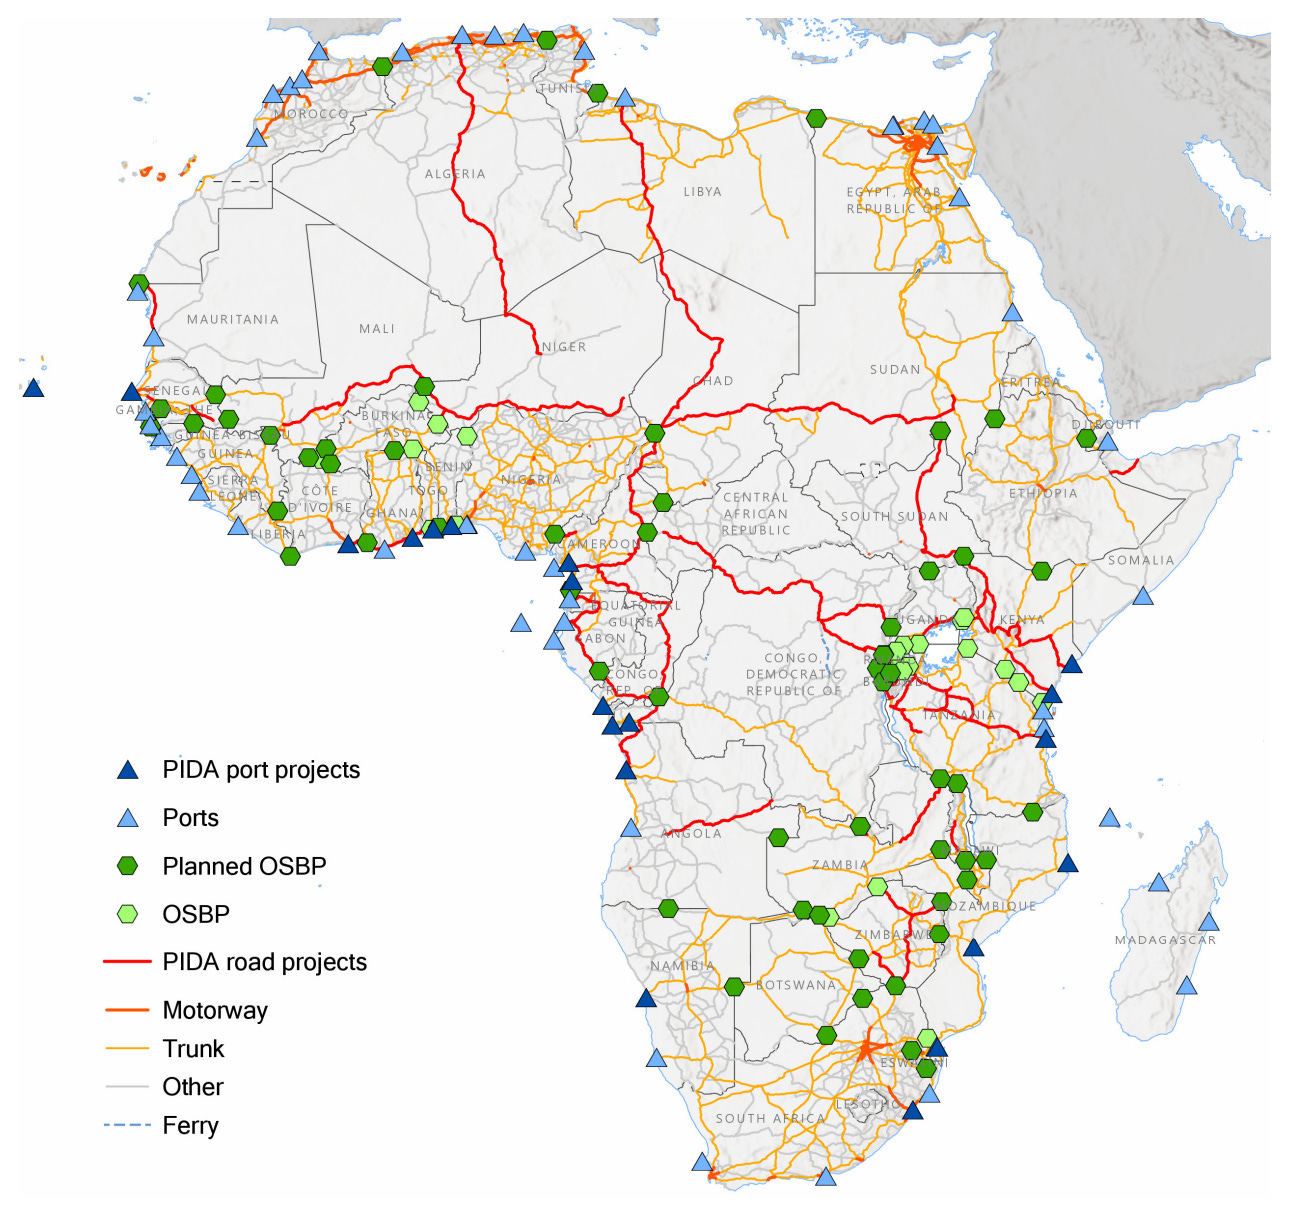
A new study from the World Bank examines how combining trade agreements with infrastructure investments can boost economic integration in Africa. The researchers analyse how improved transportation networks and preferential trade agreements jointly impact trade and GDP across the continent. This is particularly useful for those of us who are interested in modelling and optimising transportation and trade flows.
The team built a detailed city-level database of travel times across Africa, by mapping current infrastructure like roads, ports, and border crossings. This incorporated planned projects from the Program for Infrastructure Development in Africa (PIDA) to assess their impact on reducing transportation times. Data from the World Bank's Deep Trade Agreements database was used to evaluated the depth (i.e. comprehensiveness) of existing trade agreements. They then used a structural gravity model to predict trade flows based on economic size and trade costs. This is used to estimate how changes in infrastructure and trade policies affect trade patterns.
The study found that an ambitious trade agreement alone could increase African exports by 3.6% and GDP by 0.6%. However, when combined with infrastructure improvements that reduce travel times on roads, ports, and borders, exports could rise by 11.5% and GDP by 2%.
All in all, I think it’s a pretty interesting paper that uses geospatial data to discover that infrastructure development unlocks a lot more benefits of trade agreements.
3. Predicting city-wide delivery demand with ML
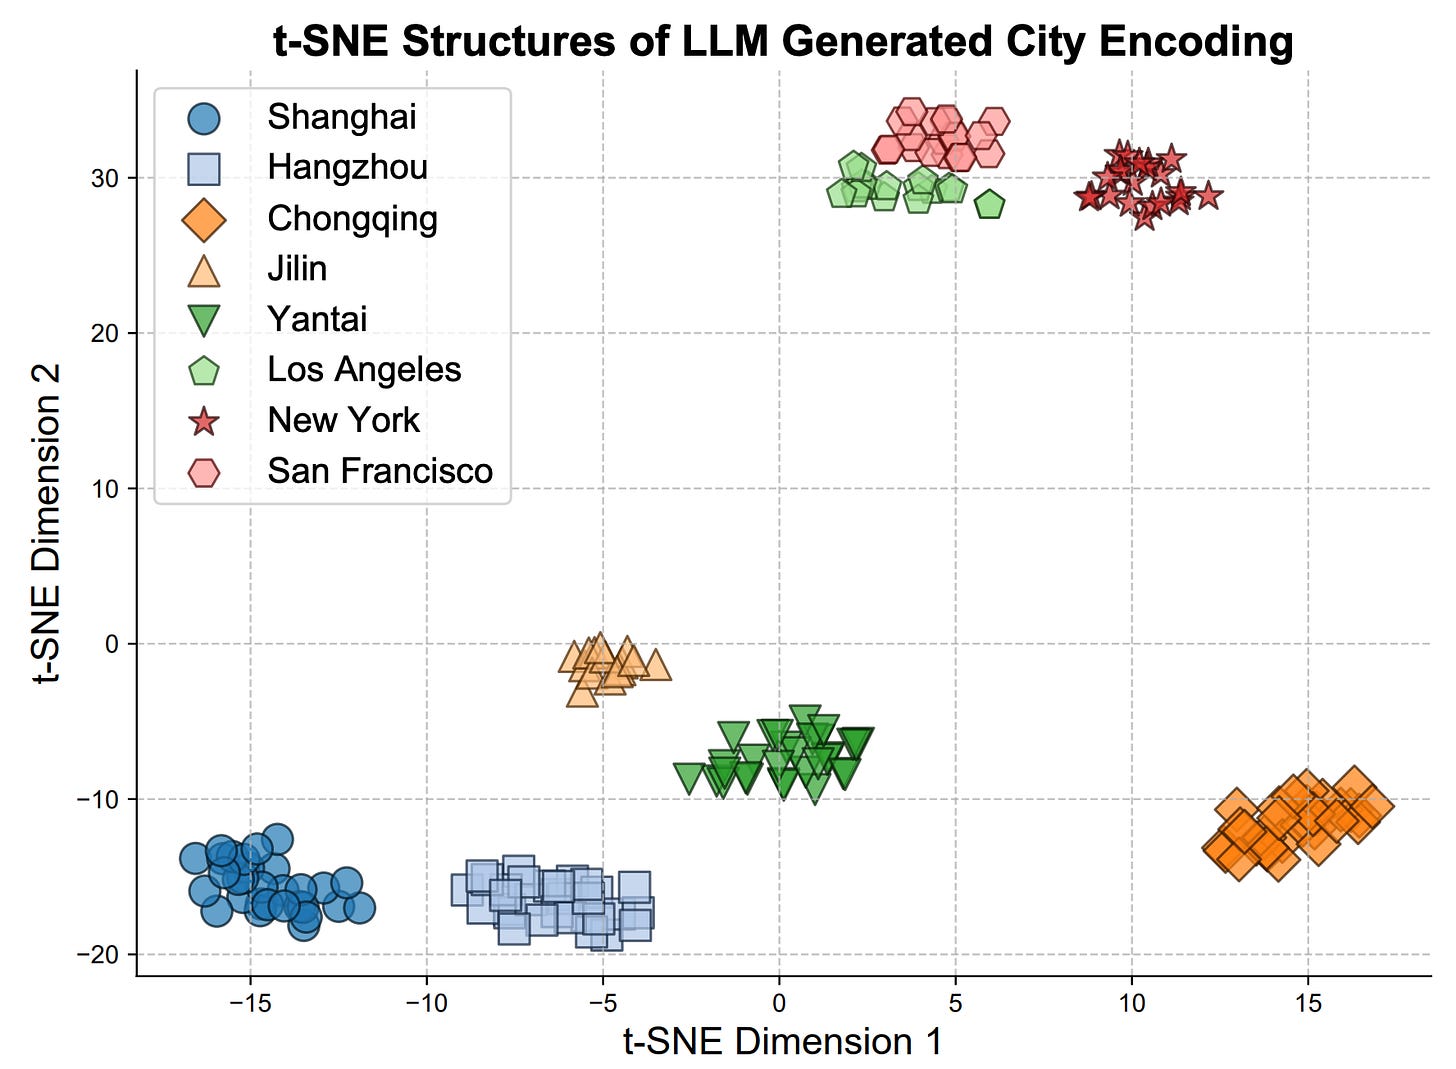
Researchers from The Hong Kong Polytechnic University and Tongji University have introduced a new way of predicting city-wide delivery demand using real-world data from eight cities in China and the US. The researchers tackled the problem of estimating delivery needs in new regions where there aren’t any historical records. As someone who’s previously worked on demand estimation for micromobility companies, I can tell you this is a pretty tough problem to crack.
They developed a graph-based model called a message-passing neural network (MPNN), where each city region is a node, and connections represent how demand in one area affects another. They also incorporated geospatial knowledge from large language models. This essentially allows the model to understand unstructured location information—like addresses or landmarks—and use it to improve predictions. They used an inductive training scheme, whereby the model can generalise to new cities without retraining from scratch. They tested this approach on actual delivery data, including package deliveries in Chinese cities and food deliveries in US cities, with details like pickup times, locations, and courier info.
Their model outperformed existing methods. In Shanghai, it achieved a mean absolute error (MAE) of 3.76 compared to 4.75 from the next best method (a Spatial Aggregation and Temporal Convolutional Network). In Los Angeles, the MAE improved from 0.441 to 0.321. The model also performed really well at predicting demand in new areas without prior data (up to 28% better accuracy when transferred to new cities without retraining).
These findings suggest that blending advanced language models with graph-based systems can be a promising way to improve demand predictions.
Geospatial Datasets
1. NZ coastal change dataset
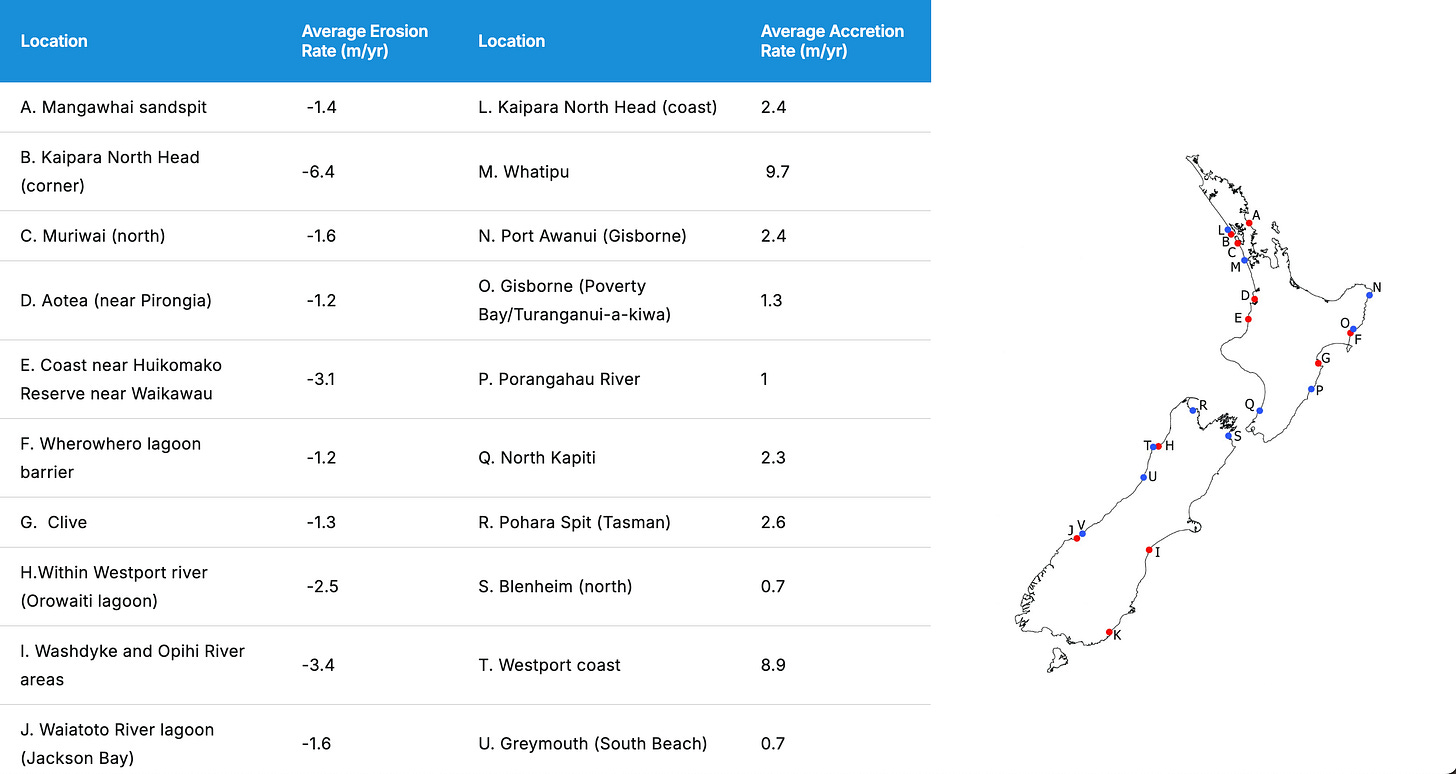
This coastal change dataset offers a bunch of data on coastal erosion, sediment transport, sea-level rise, and the impact of climate change on New Zealand’s coastlines.
It includes high-resolution models, historical shoreline data, and future projections to assist with regional planning, risk assessment, and coastal management strategies.
2. LEAP Data Catalog
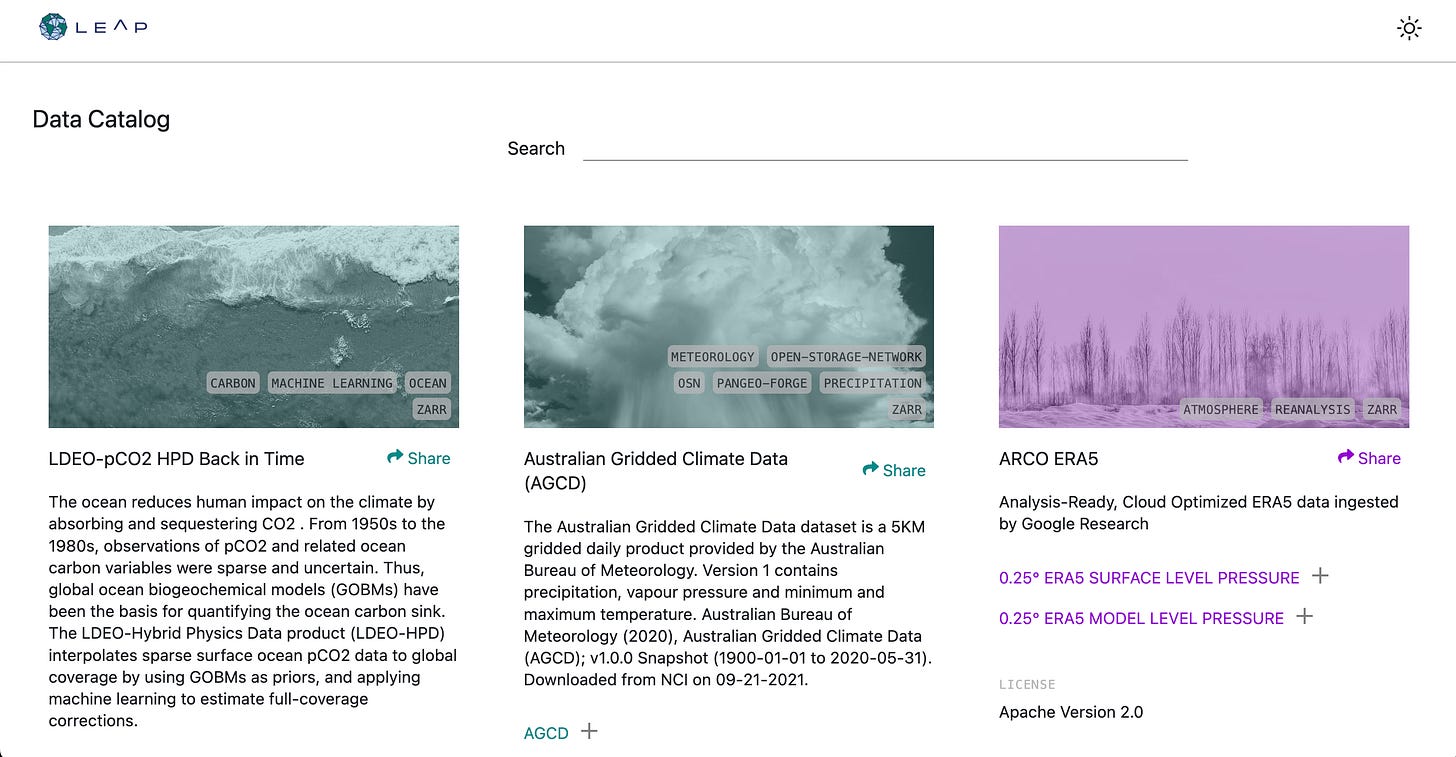
The LEAP (Linked Earth Data for Environmental Research and Decision Making) data catalogue from Columbia University is a comprehensive repository of Earth science data, focused on climate, environmental, and atmospheric research.
It provides access to datasets related such as ERA5 data, gridded climate data, climate projections, volcanic eruptions, and so on.
3. Geoneon wildfire severity index
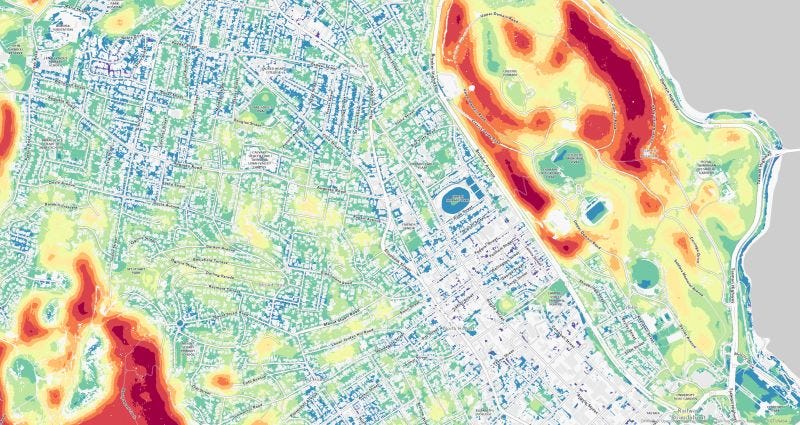
The Geoneon Wildfire Severity Index assesses the intensity and impact of wildfires. It converts satellite imagery into a severity index using a bunch of factors such as temperature, vegetation density, moisture levels, wind patterns, and burn areas captured in satellite data.
The index provides real-time and predictive insights into wildfire behaviour, helping emergency responders, land managers, and communities prepare for and respond to wildfire threats.
4. Global Urban Polygons and Points (GUPPD) dataset
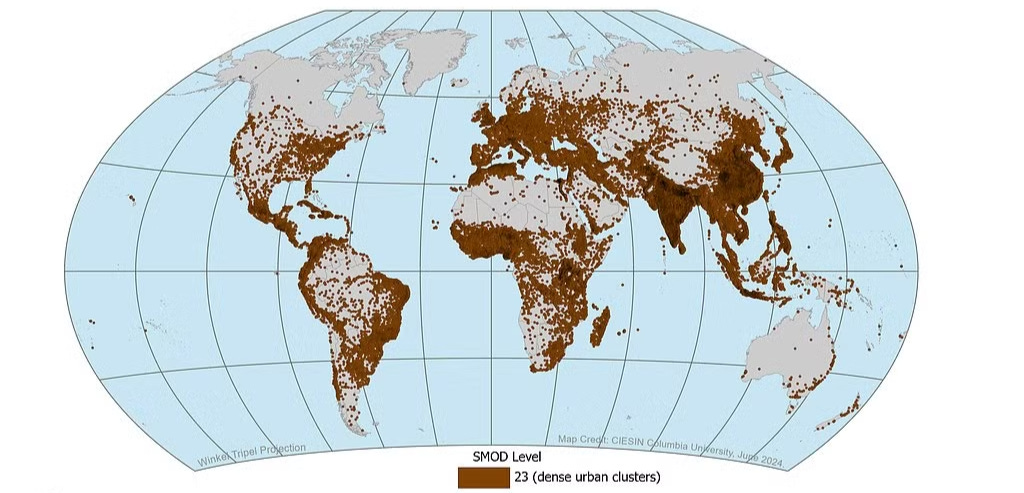
The new Global Urban Polygons and Points Dataset (GUPPD) from NASA SEDAC provides an updated global map of urban areas (as polygons and spatial points), which is derived from satellite images and geospatial population data.
Other useful bits
The World Bank-UNHCR Joint Data Center on Forced Displacement developed the Forced Displacement Microdata, a dashboard where users can view data on FDPs.
Bangladesh is using satellite data to assess the vulnerability of its energy infrastructure to climate risks like floods and cyclones. By identifying high-risk areas, the project aims to improve disaster preparedness and strengthen energy systems to promote reliable and sustainable energy access.
Google Maps now offers an ‘efficient routes’ API by using real-time traffic data and route optimisation to save time, fuel, and money. I much prefer this to their old ‘inefficient routes’ API…
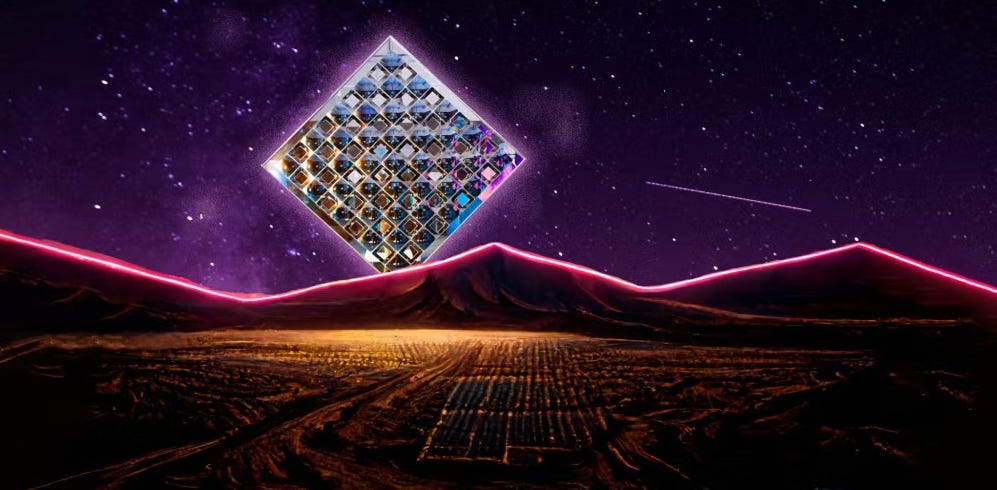
So there’s this new company doing the rounds on geospatial Twitter called Reflect Orbital. Their idea essentially involves putting reflective mirrors into space to redirect sunlight to places at night. I honestly don’t know what to think about this. It sounds like a gimmick, I’m not sure if it’s technically possible, and I have no idea if people want sunlight reflected from the other side of the world given that we have that invention called ‘lighting’. But I’d certainly be happy to be proved wrong…
Jobs
The University of Glasgow has six positions open in their Geospatial Data Science Team: AI Research Scientist, Research Software Engineer (Geo-AI), Research Associate (Urban Analytics), Research Associate (Missing Data), Research Associate (Agent-based Modeling).
Amazon Web Services is looking for a Solutions Architect who will be within the AWS Aerospace and Satellite Services organisation.
The United Nations Environment Program is looking for a data scientist based in Nairobi.
Chapman Tate is looking for 2 GIS Specialists who will be based in Dublin.
Arup is seeking Geospatial graduates for its Geospatial Graduate Development Programme in Dublin, commencing September 2025.
KBR is looking for a Chief Geospatial Data Scientist under its Science and Space (S&S) business unit to lead its data strategy efforts.
The University of Maryland is looking for an Associate Professor in Remote Sensing under the Department of Geographical Sciences.
The European Centre for Medium-Range Weather Forecasts (ECMWF) has four positions open for Machine Learning Scientist, Data Specialist and High-performance Computing Engineer.
Just for fun
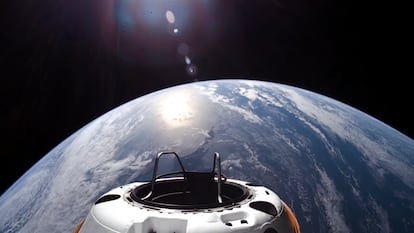
SpaceX’s Polaris Dawn recently reached the highest altitude travelled by a human in 50 years, it completed the first commercial spacewalk, and astronauts Sarah Gillis and Anna Menon became the furthest-traveling women in history.
That’s it for this week.
I’m always keen to hear from you, so please let me know if you have:
new geospatial datasets
newly published papers
geospatial job opportunities
and I’ll do my best to showcase them here.
Yohan


