

🌐 Can we use LLMs to analyse satellite images?
PLUS: The emotional side of walkability, why sharing power grids is three times cheaper, and more.

Hey guys, here’s this week’s edition of the Spatial Edge — a support group for the geospatially-curious. In any case, the aim is to make you a better geospatial data scientist in less than five minutes a week.
In today’s newsletter:
LLMs and Earth Data: Can agents analyse satellite imagery.
Walkability Emotions: Attachment to neighbourhood shapes walking.
Disaster Detection: Training-free model runs directly in orbit.
Energy Cooperation: Coordinated grids cut clean power costs.
Roman Roads: Most detailed digital network of the empire.
Research you should know about
1. Can we use LLMs to analyse satellite images?
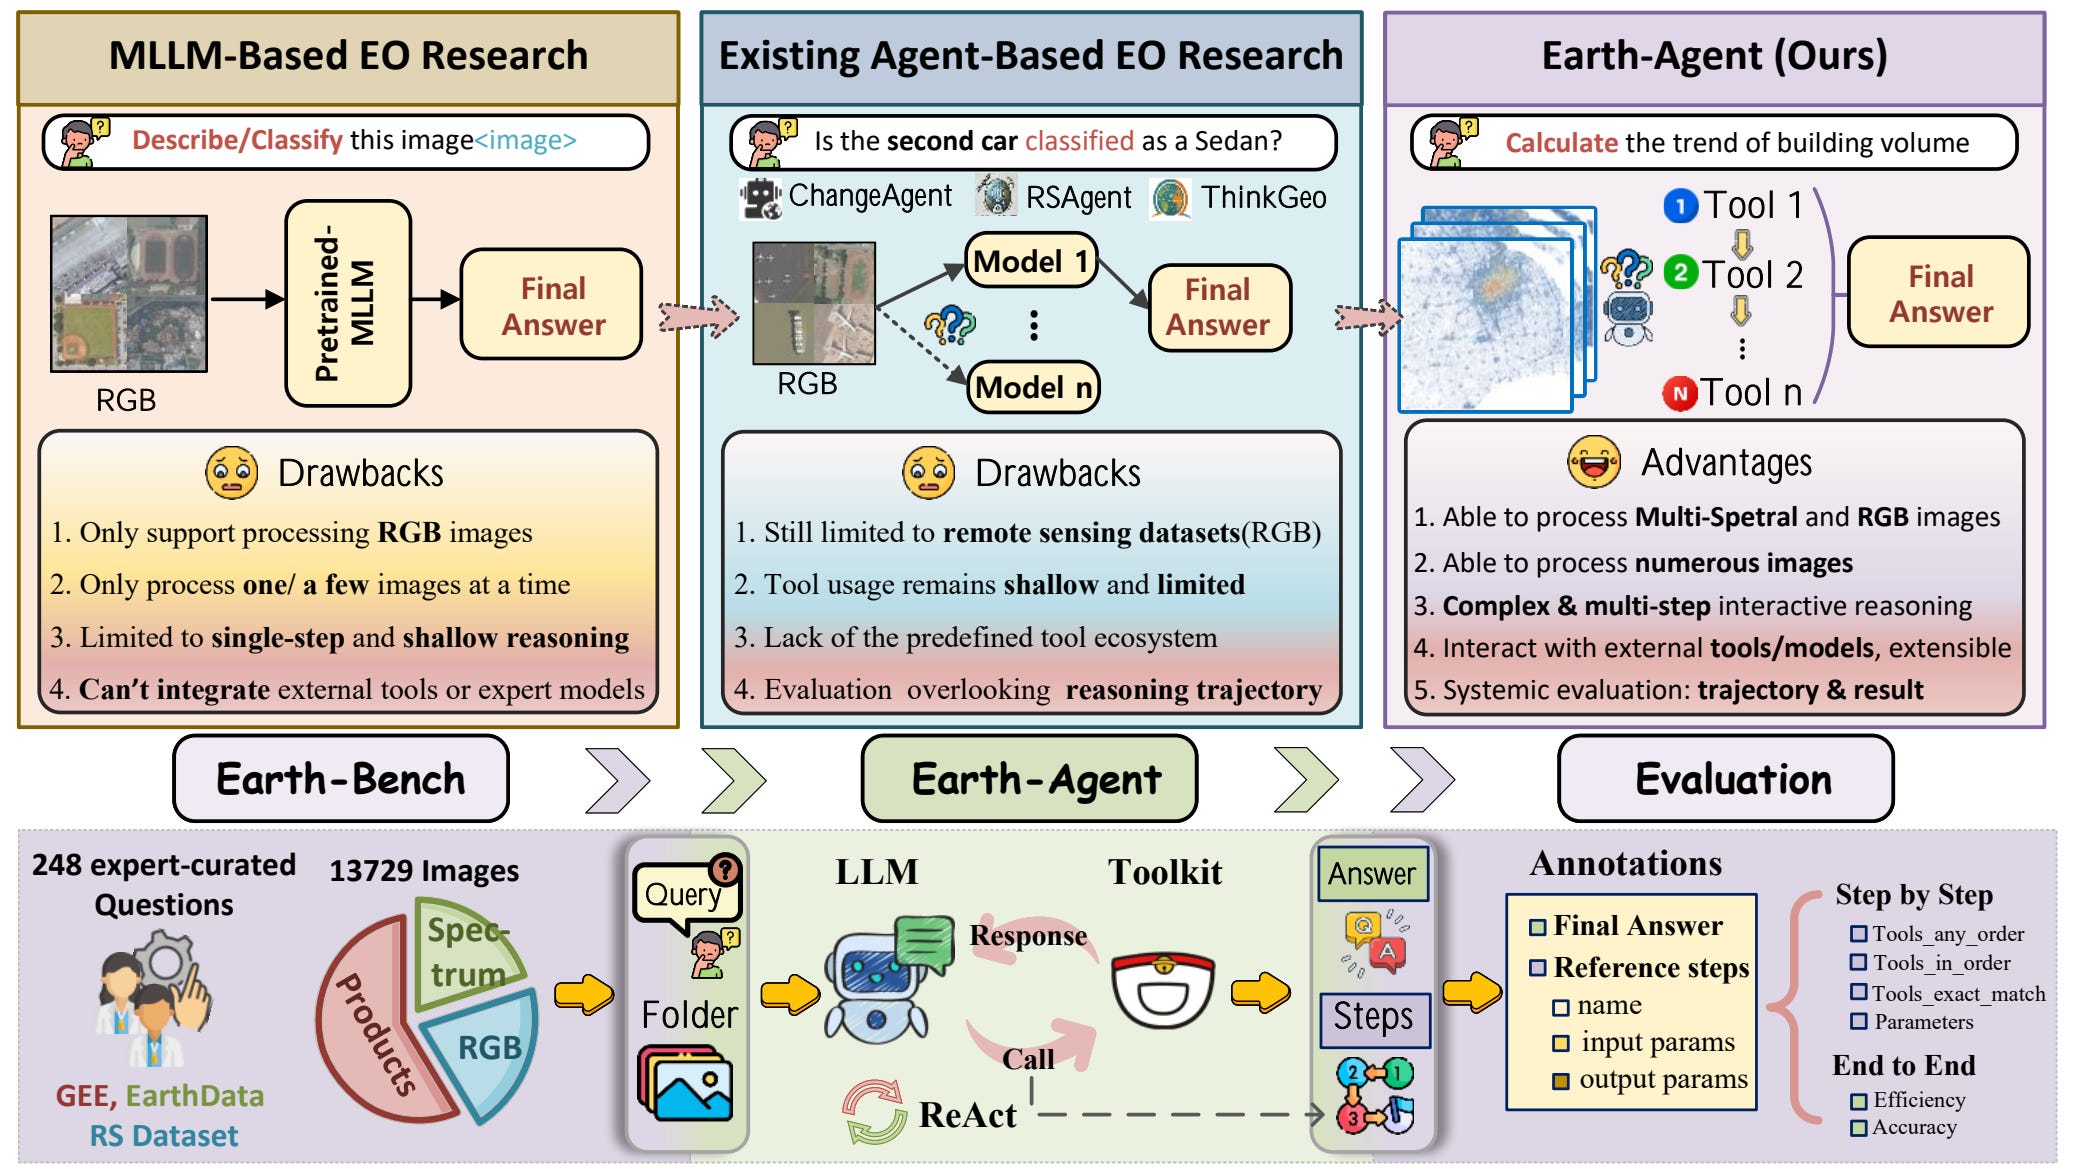
Say you want to figure out how many days last year saw more than 25% of Chicago experiencing surface temperatures above 300K, using Landsat 8 data. That’s not something you can answer by just looking at a satellite image. You need to download the right data, calculate brightness temperatures, apply thresholds across hundreds of images, and aggregate the results. Current multimodal LLMs can describe what’s in a single image, but they can’t actually do this kind of multi-step quantitative analysis. Earth-Agent, introduced in a new study, tackles this by turning the LLM into a controller rather than a doer. Instead of trying to process the data itself, the model decides which specialised tool to call at each step, like calculating NDVI, estimating land surface temperature, or running change detection algorithms. The framework includes 104 domain-specific tools that handle the actual computation, while the LLM figures out the sequence of steps needed to answer the question.
To test how well this actually works, the researchers created Earth-Bench, a dataset of 248 expert-curated problems that require an average of 5.4 reasoning steps to solve. Unlike existing benchmarks that focus on simple perceptual tasks with single images, Earth-Bench includes problems across three modalities (raw spectral data, processed Earth products, and RGB imagery) and demands genuine quantitative analysis. The results are pretty interesting. Even the best-performing models like GPT-5 and DeepSeek-V3.1 only achieve around 50 to 65% accuracy on the final answers. What’s particularly surprising is that models are pretty good at identifying which tools they need to use, but they struggle with executing the exact sequence correctly and getting the parameters right.
The framework does show clear advantages over both general-purpose agents and existing multimodal LLMs though. General agents like those from OpenAI or Coze completely fail on certain modalities (some couldn’t complete a single RGB task), while Earth-Agent with GPT-5 achieves 55.8% accuracy across all modalities. When compared to remote sensing-specific models like LHRS-Bot or VHM on tasks like classification and object detection, Earth-Agent outperforms them substantially. So who knows, this might be yet another step in the ongoing quest to derive insights from satellite images using only natural language.
You can access the data here and the code here. More info on their project page.
2. The emotional side of walkability

The research is in. Urban design isn’t just about streets and sidewalks. It’s about how people feel about where they live. As someone who’s spent a couple of years living in the densest city in the world, I can attest to this… Anyway, a study published in Scientific Reports looks at whether feeling attached to your neighbourhood actually makes you walk more. The researchers surveyed over 2,000 adults in Calgary, Canada, measuring two types of place attachment:
place identity (the emotional bond you have with your neighbourhood) and
place dependence (how much you rely on it for activities).
They then matched this data with objective neighbourhood walkability, categorising areas by street pattern into grid (high walkability), warped grid (medium), and curvilinear (low walkability). The results show that both place identity and place dependence are positively associated with walking for transportation and recreation, regardless of neighbourhood type. People with stronger attachment to their neighbourhood were more likely to hit the recommended 150 minutes per week of walking and walked more frequently overall.
The really interesting bit is how neighbourhood design modifies these relationships. The associations between place attachment and walking were strongest in grid neighbourhoods (those with high connectivity, mixed land use, and lots of destinations). For instance, the link between place identity and sufficient recreational walking was strongest in grid neighbourhoods (OR 1.82), followed by curvilinear (OR 1.58), with no significant association in warped grid areas. One surprising finding: place dependence had its strongest association with sufficient transportation walking in curvilinear (low walkability) neighbourhoods (OR 1.92), suggesting that people in car-oriented suburbs need a particularly strong attachment to their area to overcome built environment barriers and still walk for transport.
Grid neighbourhoods, with their high pedestrian connectivity and destination density, seem to amplify the walking benefits of place attachment. But even in less walkable areas, stronger emotional and functional connections to the neighbourhood can encourage more walking.
3. Training-free AI for disaster detection in orbit

One of the biggest bottlenecks in using satellite imagery for disaster response is getting the data from space down to Earth. There’s limited bandwidth, and you can’t just beam everything down instantly. So researchers are increasingly interested in processing data on-board the satellite itself, prioritising the most important stuff for downlinking. The problem, though is that most AI models require massive computational resources for training, which you simply don’t have on a satellite. A new study published in Scientific Reports introduces something called a Physics Aware Neuromorphic Network (PANN) that sidesteps this entirely. It’s a training-free model that can detect changes caused by natural disasters in satellite imagery without ever needing traditional ground-based training.
The PANN is inspired by physical neural networks made of memristors (basically resistors with memory). Unlike conventional deep learning models where weights are trained through computationally expensive backpropagation, the PANN’s weights continuously update in response to new inputs according to physical laws. So instead of pre-training the model on the ground and then uploading it to the satellite, the PANN actively learns as new images come in from the sensor. The researchers tested it on Sentinel-2 imagery covering four types of natural disasters: fires, floods, hurricanes and landslides. For each disaster event, the model takes a sequence of five images (four before, one after) and produces a change map highlighting affected regions.
The results are pretty impressive. When benchmarked against RaVAEn (a state-of-the-art model specifically designed for on-board satellite use), the PANN achieved comparable or better performance across all disaster categories. It was especially strong for floods, scoring 14% higher than RaVAEn. The model also generalised reasonably well when tested on LandSat-8 data, despite never being trained on it. The whole thing runs on CPUs with about 1GB of memory, processing a 25 km² region in around 19 seconds. Since there’s no training overhead, you avoid the usual cycle of downlinking data, retraining models on the ground, and uplinking updated versions.
The code is available here and the data used to train the model is here.
4. Turns out sharing power grids is three times cheaper

A new study in Nature Communications looks at whether South American countries would be better off coordinating their electricity grids as they transition to low-carbon systems. The researchers used an optimisation model to simulate 80 different future scenarios for five countries (Argentina, Brazil, Chile, Paraguay, and Uruguay) under various technology assumptions and emissions targets. The headline finding is pretty nuts: achieving a 90% cut in electricity emissions by 2050 is totally doable with only modest cost increases (around 5 to 18%), and these costs drop substantially when countries coordinate their grids rather than planning independently. The study finds that limiting coordination forces countries to overbuild generation capacity, costing over three times more than simply expanding cross-border transmission lines (14.7 to 22.8 billion USD versus 3.5 to 7.0 billion USD).
The main reason coordination works so well comes down to complementary resources and grid balancing. Chile has excellent solar potential but struggles with nighttime power needs, while Argentina has strong wind resources and natural gas for backup. Under full coordination, Chile can import wind and hydropower from Argentina at night instead of installing its own (lower quality) wind turbines or relying heavily on battery storage. This kind of trade smooths out the daily and seasonal swings of intermittent renewables across the region. The model shows that coordinated scenarios actually deploy less total wind capacity but generate more wind power, because they’re cherry-picking only the highest quality sites rather than each country building suboptimal projects domestically.
The benefits don’t distribute evenly across countries though. Argentina and Paraguay emerge as net exporters (mainly wind and hydropower), while Brazil becomes increasingly reliant on imports to meet its growing demand. Paraguay continues its historical role exporting hydropower to Brazil, while Argentina’s central position and mix of wind and gas makes it crucial for balancing the regional grid. Chile’s pathway shifts dramatically depending on coordination: under limited coordination, it must build domestic wind capacity to complement its solar; under full coordination, it focuses purely on solar while importing power for nighttime needs. Clearly this creates energy interdependence risks, and political and institutional barriers aren’t modelled here. But for regions with geographically variable renewable resources, the economic case for coordination looks compelling.
Geospatial Datasets
1. Crop yield impact dataset
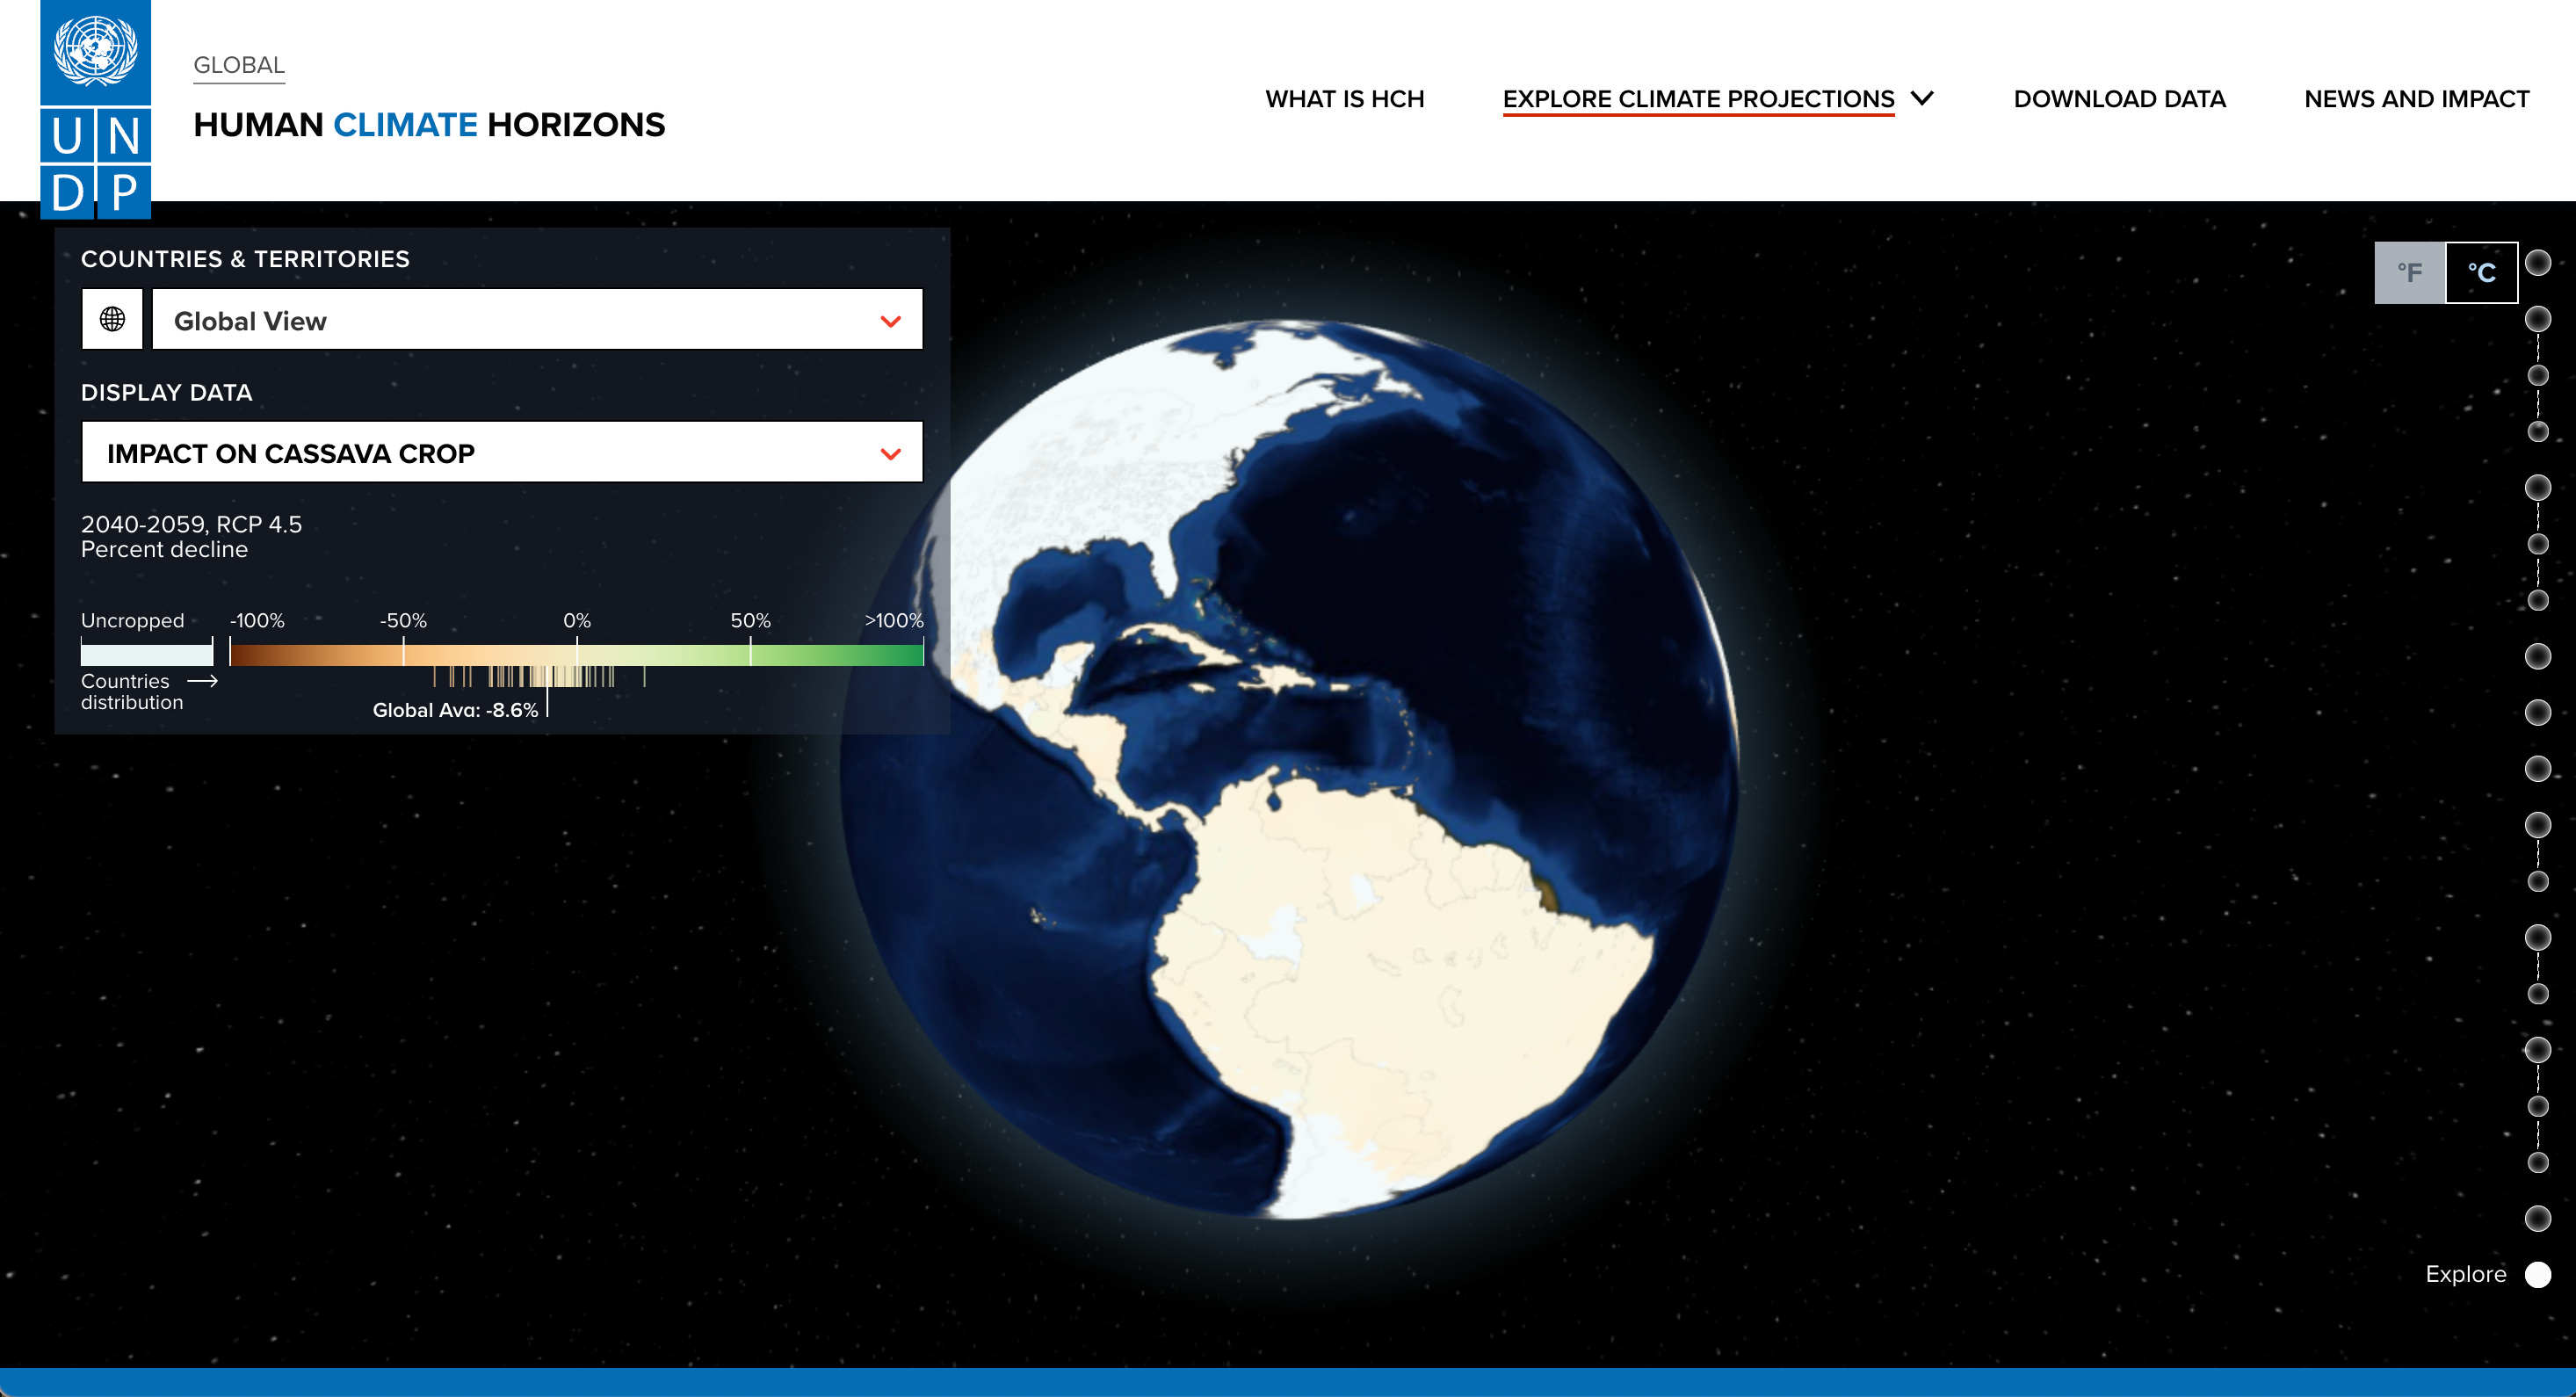
This new Human Climate Horizons (HCH) dataset provides high-resolution global projections of climate-driven changes in agricultural yields for six staple crops across 19,000+ subnational regions. You can access the data via the HCH data platform.
2. Human footprint map

HIBR-10 is a new 10-m resolution human footprint map for all of Brazil, designed to match the fine spatial scales at which species like primates actually use their habitats. It combines Sentinel-2 land cover, Microsoft building footprints, transport networks and waterways into a single human impact index across 86.5 billion grid cells. You can access the data and code here.
3. Building morphology dataset

The Gauntlet dataset provides a rich set of 65 building-morphology features for more than 131 million structures across the United States. It’s derived from FEMA’s USA Structures footprints dataset. You can access the data here and the code here.
4. Roman Empire road dataset

You Roman map fetishists are in for a treat. Itiner-e is the most comprehensive and spatially detailed digital dataset of Roman roads ever created. Each road segment is digitised at high resolution using archaeological evidence, historical maps, milestones, remote sensing and topographic data, and tagged with certainty levels. You can access the data and code here.
Other useful bits

NASA’s ECOSTRESS mission has produced the first detailed map of Los Angeles’ street-level temperatures, using 10-metre thermal data collected from the ISS. The work is now helping the LA28 Olympics team plan heat-mitigation strategies for venues and transport routes.
Google Maps is adding Gemini as a conversational “copilot”, letting users ask natural language questions about routes, nearby places, and landmarks directly within the app.
A new global satellite survey of 151 waste sites shows that methane emissions are far more uncertain than existing reports suggest, with little correlation between satellite-based estimates and official figures. The study also finds that unmanaged dumps emit far more methane per area than managed landfills, highlighting how high-resolution satellites can guide more accurate monitoring and targeted mitigation.
Jobs
UNEP’s International Methane Emissions Observatory (IMEO) is looking for a Lead Developer for their data platform based in Paris.
UNOPS is looking for a Data Scientist based in Luxembourg.
West Virginia University is looking for a Teaching Assistant Professor of Forensic GIS at their Department of Geology and Geography.
Esri is looking for a Global Operations Sustainability Intern based in Redlands.
Just for Fun

Scientists are rushing to study 3I/ATLAS, only the third known interstellar object to pass through our solar system, as it speeds past the Sun and towards its closest approach to Earth. Observatories and spacecraft from Hubble to Perseverance are tracking the comet to understand its size, composition, and origins.
That’s it for this week.
I’m always keen to hear from you, so please let me know if you have:
new geospatial datasets
newly published papers
geospatial job opportunities
and I’ll do my best to showcase them here.
Yohan