Detecting Marine Litter from Space
PLUS: measuring energy poverty, how NASA found methane emissions are being under-reported, identifying illegal mining in the Amazon, and more.
Hey guys, here’s this week’s edition of Spatial Edge — a weekly round-up of geospatial news. The goal is to help make you a better geospatial data scientist quicker than you can say ‘bidirectional reflectance distribution function’.
In today’s newsletter:
Spotting Ocean Trash: Sentinel-2 reveals marine debris piles.
Tracking Displacement: Armed conflict driving rising numbers.
Methane Underestimated: NASA finds 13% more emissions than official data.
Illegal Mining in the Amazon: Satellites map rapid expansion.
Energy Poverty: Night-time images show 1.18 billion people affected.
Research you should know about
1. Detecting Marine Litter from Space
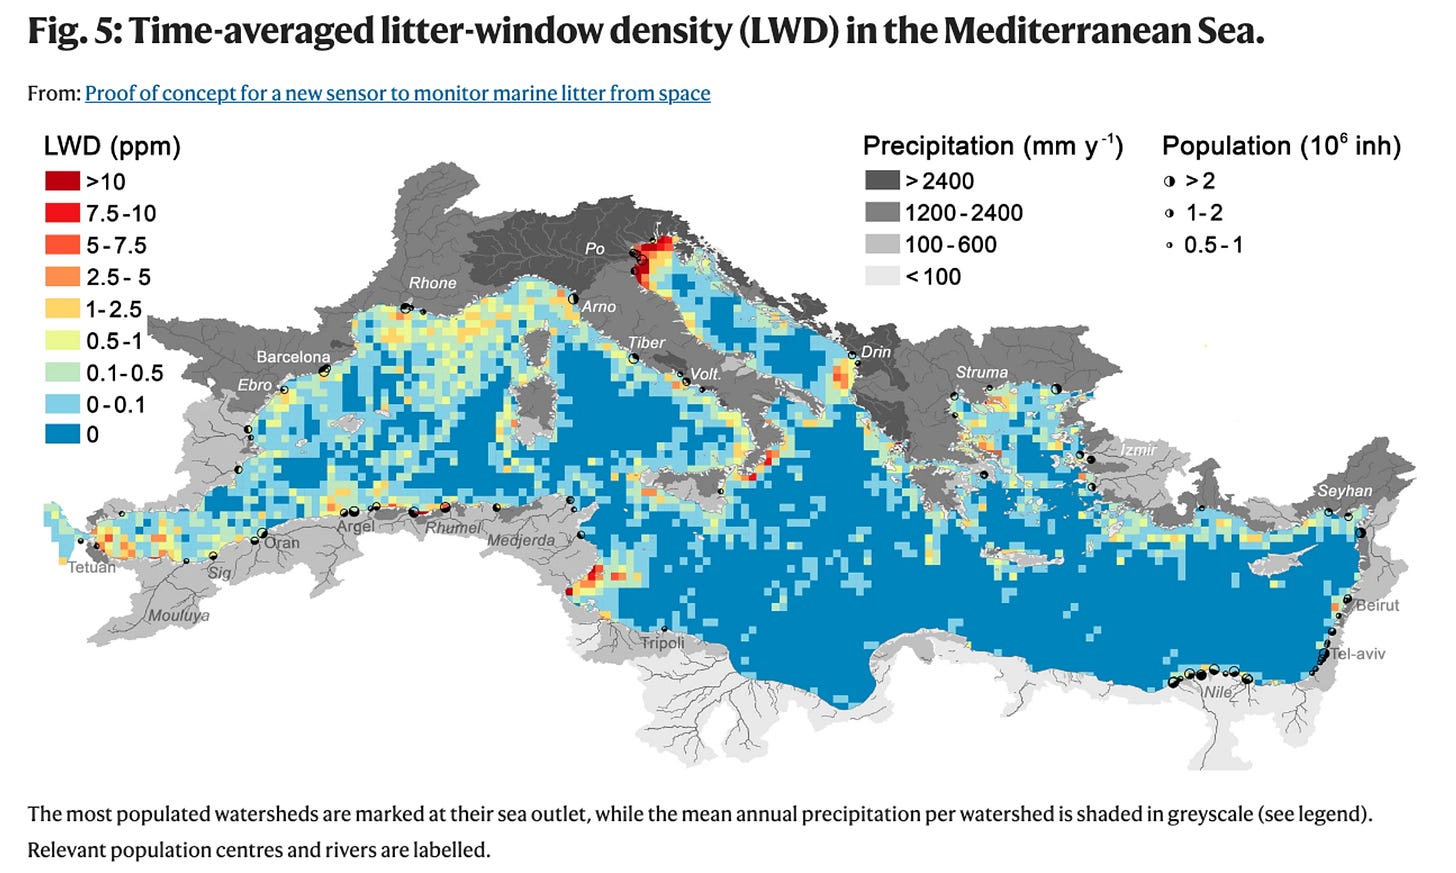
A new paper published in Nature Communications describes a novel way of measuring marine litter using satellite images.
They use data from Sentinel-2 to detect ‘litter windrows’. These are long, narrow bands of floating junk formed by ocean currents and winds. These windrows are easier to spot than scattered litter because they create dense, noticeable lines on the ocean surface.
They do this by creating a specific spectral index for the trash using infrared bands. This is because plastics have specific reflectance features in the infrared spectrum.
2. Mapping Internally Displaced Persons Using Geospatial Data
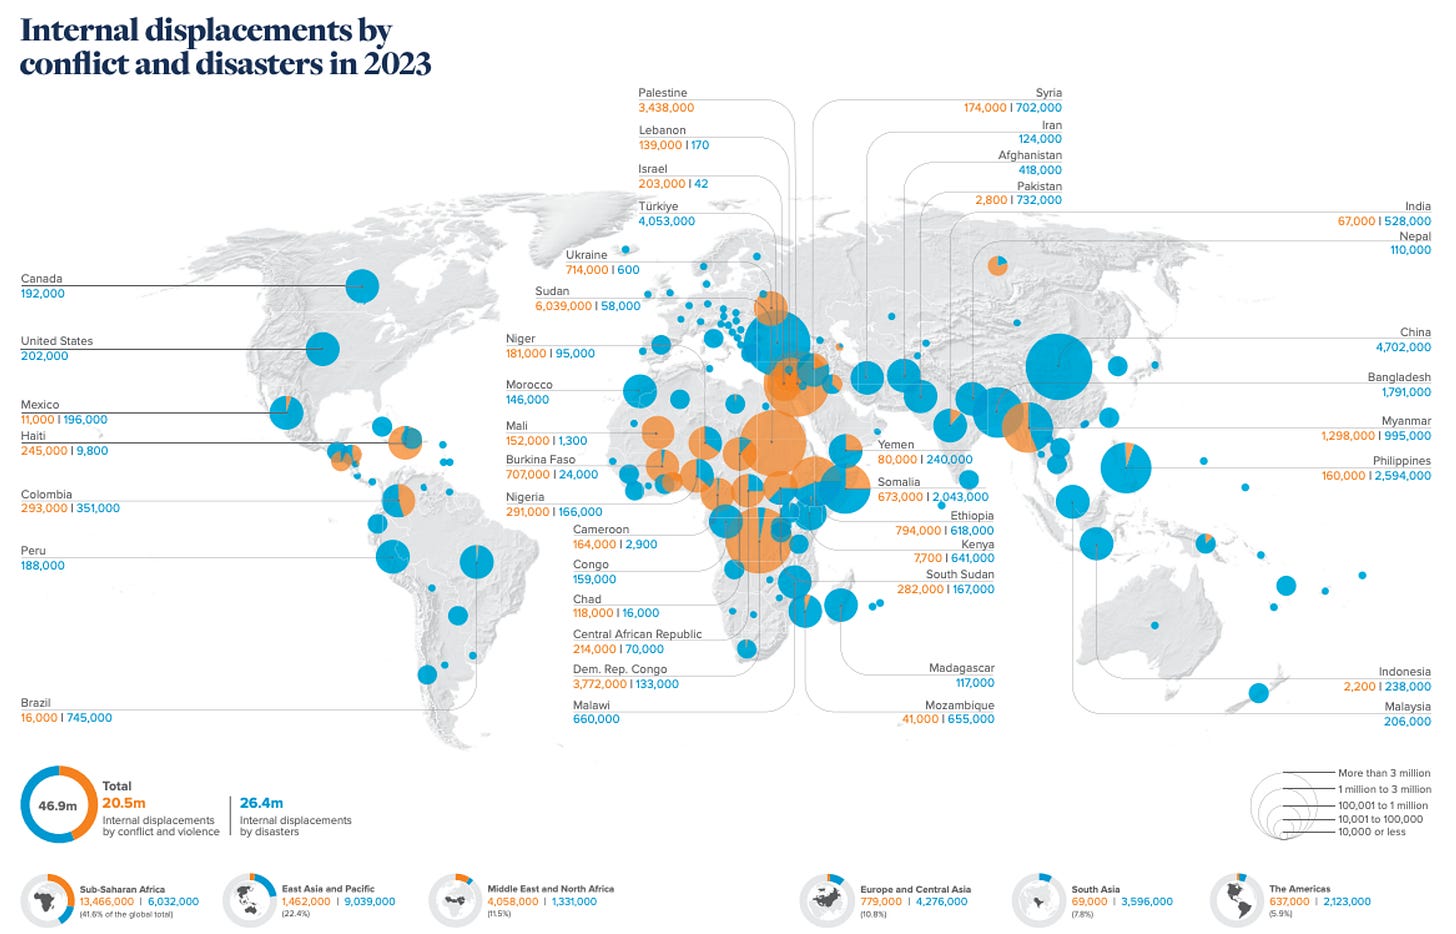
A new report from the Internal Displacement and Monitoring Centre has found some concerning trends: 75.9m people were living in internal displacement in 2023, which is an increase from 71.1m in 2022.
68.3m of these people were in this situation due to conflict and violence. Nearly half of the world's internally displaced people are in Sudan, Syria, the Democratic Republic of the Congo (DRC), Colombia, and Yemen. The number of conflict-related displacements has increased by 49% over the past five years, due in large part by conflicts in Ethiopia, DRC, Sudan, and Ukraine.
However, some better news is that displacements from weather-related disasters dropped by a third compared to 2022.
3. Satellite Data Suggests Methane Emissions are Under-reported
Research from NASA and Harvard found that based on satellite data analysis, methane emissions for 2019 were 13% higher than estimates from the US’s Environmental Protection Agency.
They combined data from TROPOMI satellite observations with the GEOS-Chem atmospheric transport model to create a high-resolution map of U.S. methane emissions.
They found that emissions from oil and gas operations and livestock were higher by 12% and 11%, respectively. However, methane emissions from coal mining were 28% lower than EPA estimates.
4. Detecting Illegal Mining in the Amazon
A collaboration between Earth Genome, Pulitzer Center, and Amazon Conservation, uses satellite data and deep learning to map illegal mining in the Amazon. They found that from 2018 to 2023, the area of mining in the Amazon nearly doubled to 3.2 million acres.
In 2023, 7,163 distinct mining locations were detected, with an average area of 450 acres and a maximum of 35,000 acres.
The data and codebase have now been open-sourced. You can access it here.
5. Estimating Energy Poverty Using Nightlights
A new paper, which uses satellite and geospatial data, has found that 1.18 billion people are ‘energy poor’ across the globe. Energy poverty is essentially the lack of adequate, reliable and affordable energy for essential daily activities. Shockingly, these results were 60% higher than official estimates for energy poverty.
The data and methodology is available here.
6. Using Facebook Data to Measure ‘Counter-Urbanism’
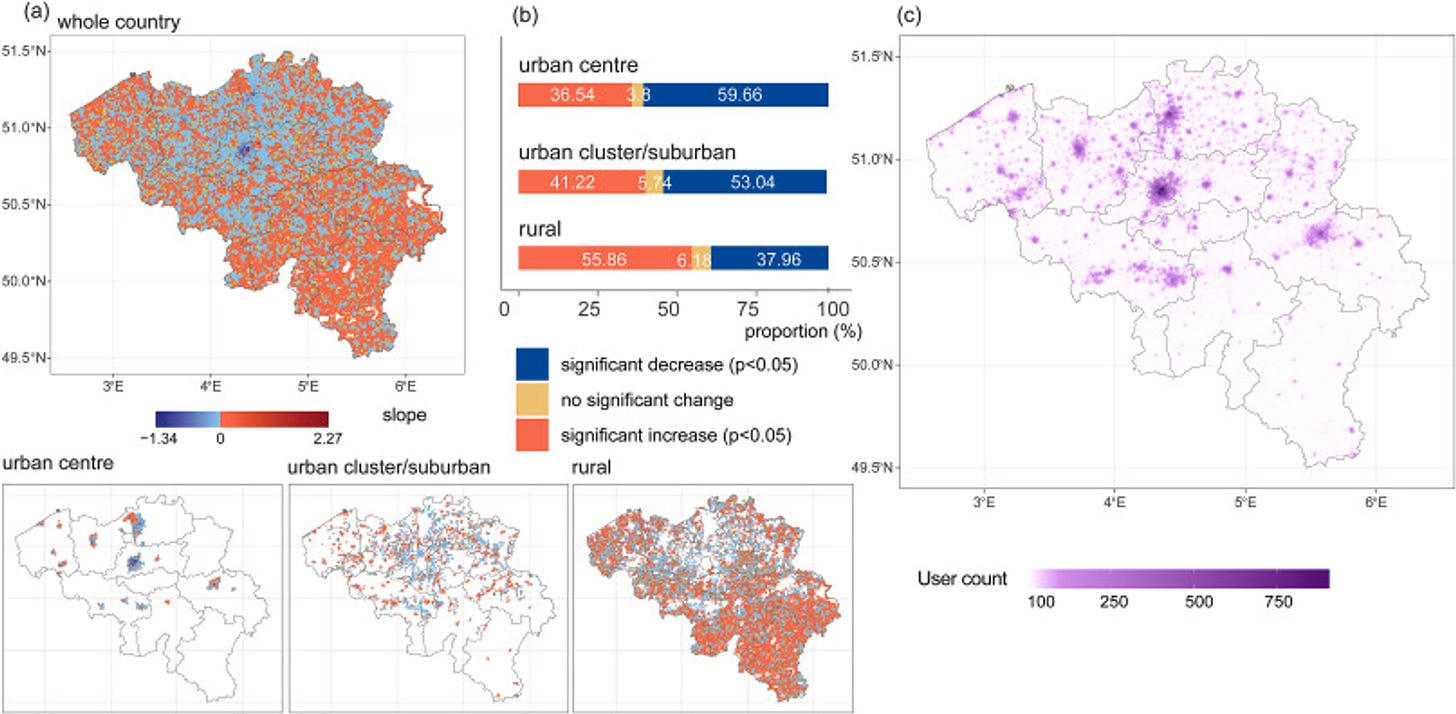
Researchers from the University of Southampton used Facebook data to analyse ‘counter-urbanism’ in Belgium and Thailand from 2020-2022. This essentially happens when people move from urban to rural areas — a trend that started getting popular during the pandemic.
In Belgium, they found that rural residents increased by 1.80%, while in Thailand it increased by 2.14% over the period. They measured ‘place of residency’ by analysing people’s location at night time, whereas their ‘commuting’ destinations were determined by looking at where they travelled during the day.
On the whole, it’s a pretty interesting use case for big data and provides more real-time estimates of residency compared with more traditional census-based methods.
7. Mapping fossil fuel production by identifying methane plumes
ESA has funded a project to detect methane plumes from hyperspectral data. Using PRISMA and EnMAP data, they focussed on the 2300nm wavelength. This specific wavelength shows where methane has strong absorption features.
In simple terms, this means that when light passes through methane, some of the light is absorbed by methane at the 2300nm wavelength. This then creates a distinct pattern that we can detect from satellites.
So with this in mind, they’re able to detect a bunch of emissions from oil and gas fields in Turkmenistan, coal mines in China and oil platforms in the Gulf of Mexico.
Geospatial Datasets
1. SeeFar — a large dataset of public and commercial satellite images
SeeFar is a collection of commercial and public satellite images curated for training geospatial models. It contains images at a resolution of 384x384 pixels and four spectral bands. The data is at 30, 10, 1.5 and 1.0 metres resolution in Cloud Optimised Geotiff Format.
2. RSG Dataset of Very High Resolution Satellite Images
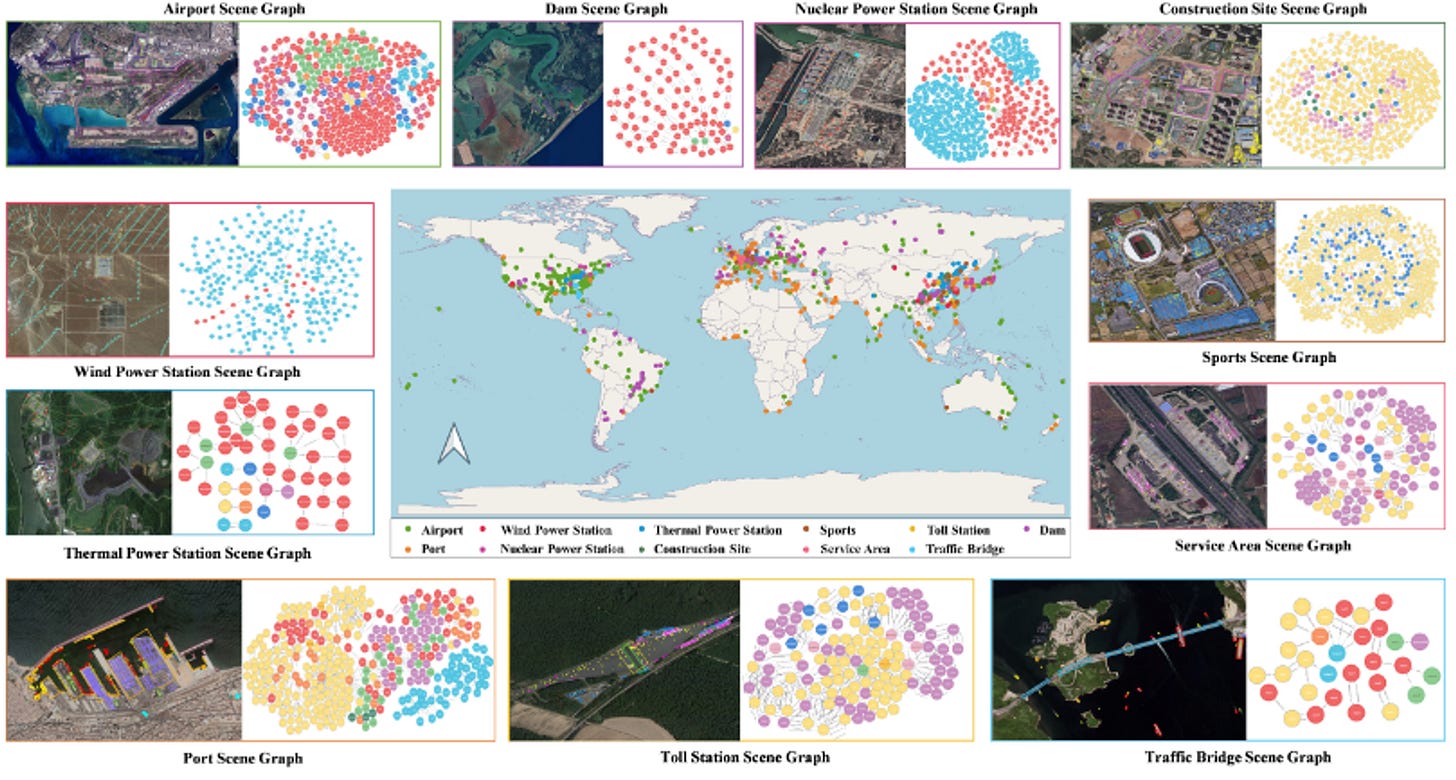
RSG is a large-scale dataset specifically designed for Scene Graph Generation (SGG). SGG helps in understanding geospatial scenarios by identifying objects, their relationship and how they interact within satellite imagery.
The dataset, which will soon be made available, contains over 210,000 objects from images ranging in size from 512x768 to 27,860x31,096 pixels. The spatial resolution will be 0.15m to 1m.
3. PASTIS Dataset for Agricultural Parcel Segmentation
The French love pastis, so of course they decided to name this dataset of agricultural parcels after the famous beverage. This dataset provides 2,433 patches of data on agricultural parcels within France. It contains data from SPOT 6-7, Sentinel-1 and Sentinel-2.
Other interesting bits
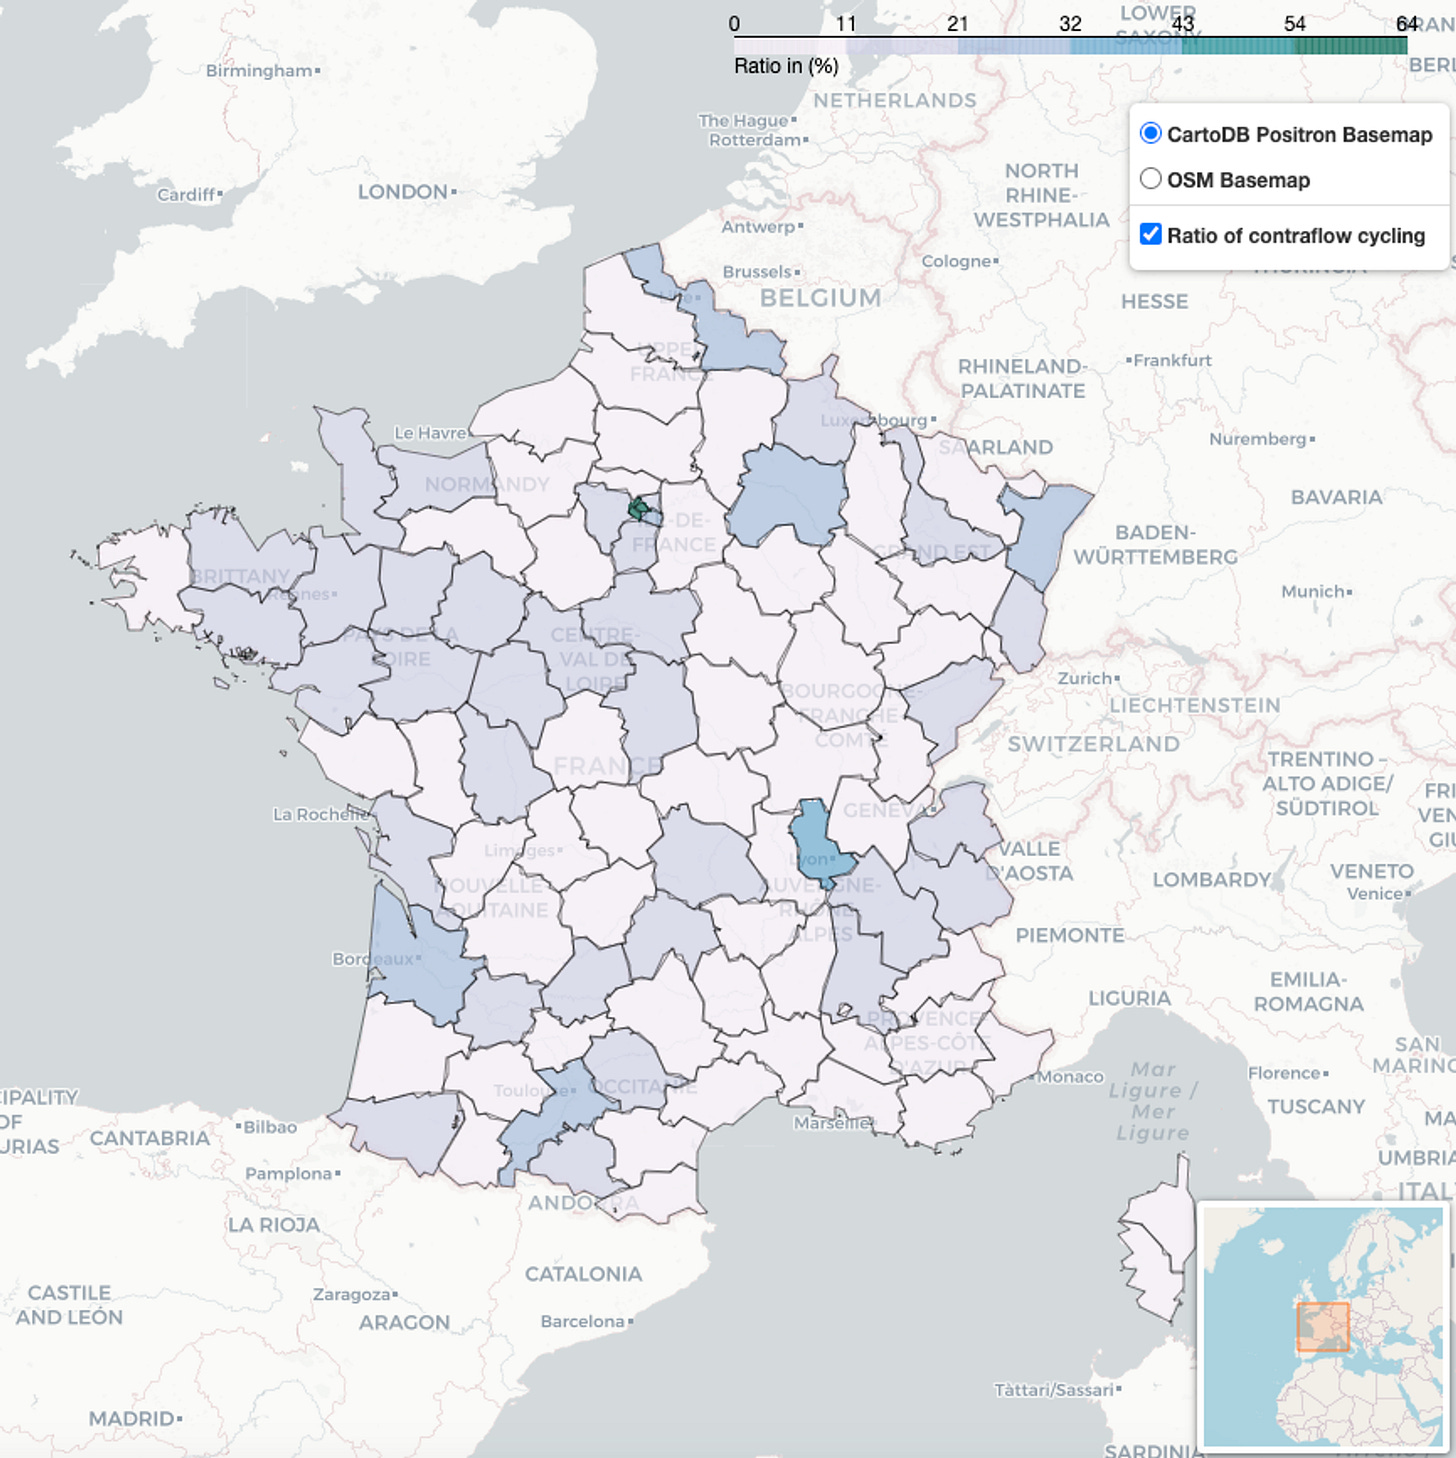
This dashboard analyzes the uptake of contraflow cycling in Europe. Contraflow cycling measures the percentage of one-way streets that allow cycling in both directions. This is a low-cost, safety-promoting measure that enables more direct cycling routes and helps avoid main roads.
ESA is funding JupyterGIS, which aims to develop a web-based user interface for collaborative editing of QGIS project files within JupyterLab.
Planet will be the first space company to use an NVIDIA GPU on board its Pelican Satellite. They say this will result in “intelligent imaging and faster insights”. What this means isn’t really clear to me, but I suppose I am in favour of more intelligent stuff.
According to UNOSAT approximately 65% of the Gaza Strip’s total road network has been damaged as of 29 May 2024. They identified roughly 1,100km of destroyed roads, 350km of severely affected roads, and 1,470km of moderately affected roads.
Apparently 604 out of 650 constituencies in the UK have a Greggs: I’m ashamed to admit that despite having lived in the UK for 5 years, I never ate there. But then again, I have infamously bad taste.
YC is looking to fund space companies: this is further evidence that this sector is becoming more mainstreamed, and will continue growing.
Google Maps have made their route optimisation API generally available: this helps businesses with fleets (e.g. delivery companies), to plan their routes and optimise for things like travel time, distance, on-time arrivals and workload balance.
Geospatial Jobs
The United States Geological Service is looking for a Fellow specialising in remote sensing of agricultural practices.
The United Nations Department of Economic and Social Affairs are looking for two geospatial information offices to be a part of the Secretariat for the Committee of Experts on Global Geospatial Information Management. You can check out the opportunities here and here.
The University of Edinburgh is looking for a couple of lecturers in Physical Geography.
That’s it for this week.
I’m always keen to hear from you, so please let me know if you have:
new geospatial datasets
newly published papers
geospatial job opportunities
and I’ll do my best to showcase them here.


