

🌐 Earthquakes have a huge carbon footprint
PLUS: Giving drones a sense of depth, the economics of good design and more.

Hey guys, here’s this week’s edition of the Spatial Edge — a newsletter that’s just as rivetting as a Lex Fridman podcast. In any case, the aim is to make you a better geospatial data scientist in less than five minutes a week.
In today’s newsletter:
Hidden Carbon: Earthquake repairs generate massive CO2 emissions.
Spatial AI: Drones learn to measure 3D dimensions.
Design Economics: Distinctive buildings boost surrounding property values.
Location Data: Mobility patterns reveal true venue functions.
Building Atlas: Open dataset provides global 3D models.
Research you should know about
1. Earthquakes have a huge carbon footprint

When we talk about the environmental cost of buildings, we usually focus on the materials used to build them or the energy they consume. But a new study in Nature Communications shines a light on a hidden carbon cost: the emissions generated by repairing and rebuilding structures after earthquakes. By integrating seismic risk models with a massive database of construction materials, researchers have estimated that Europe’s building stock embodies nearly 14 billion tonnes of CO2 equivalent. More strikingly, the damage caused by earthquakes across the continent generates an average of 6.6 million tonnes of carbon emissions every single year— roughly the same as the annual emissions of 3.9 million cars.
The study introduces a new metric called ‘Average Annual Embodied Carbon’ (AAEC) to quantify this risk. Instead of just looking at financial losses, this measures the expected yearly carbon footprint of seismic damage. The results show a heavy concentration of this environmental burden in just a few countries. Türkiye tops the list, accounting for over half of the total annual emissions due to its high seismic activity and large number of vulnerable buildings. Italy, Romania, Greece, Spain and Bulgaria also feature prominently, meaning just six nations are responsible for about 90 per cent of Europe’s earthquake-related carbon emissions.
This research highlights a critical blind spot in our current sustainability strategies. While we are busy making buildings more energy-efficient, we often ignore the ‘embodied carbon’ that gets released when we have to fix or replace them after a disaster. The authors argue that seismic resilience is actually a form of climate action. By retrofitting buildings to withstand shocks, we aren’t just saving lives and money; we are also preventing millions of tonnes of CO2 from being pumped into the atmosphere during reconstruction. The team has released their datasets and models publicly, hoping to help policymakers integrate these hidden environmental costs into their disaster risk planning.
2. Giving drones a sense of depth
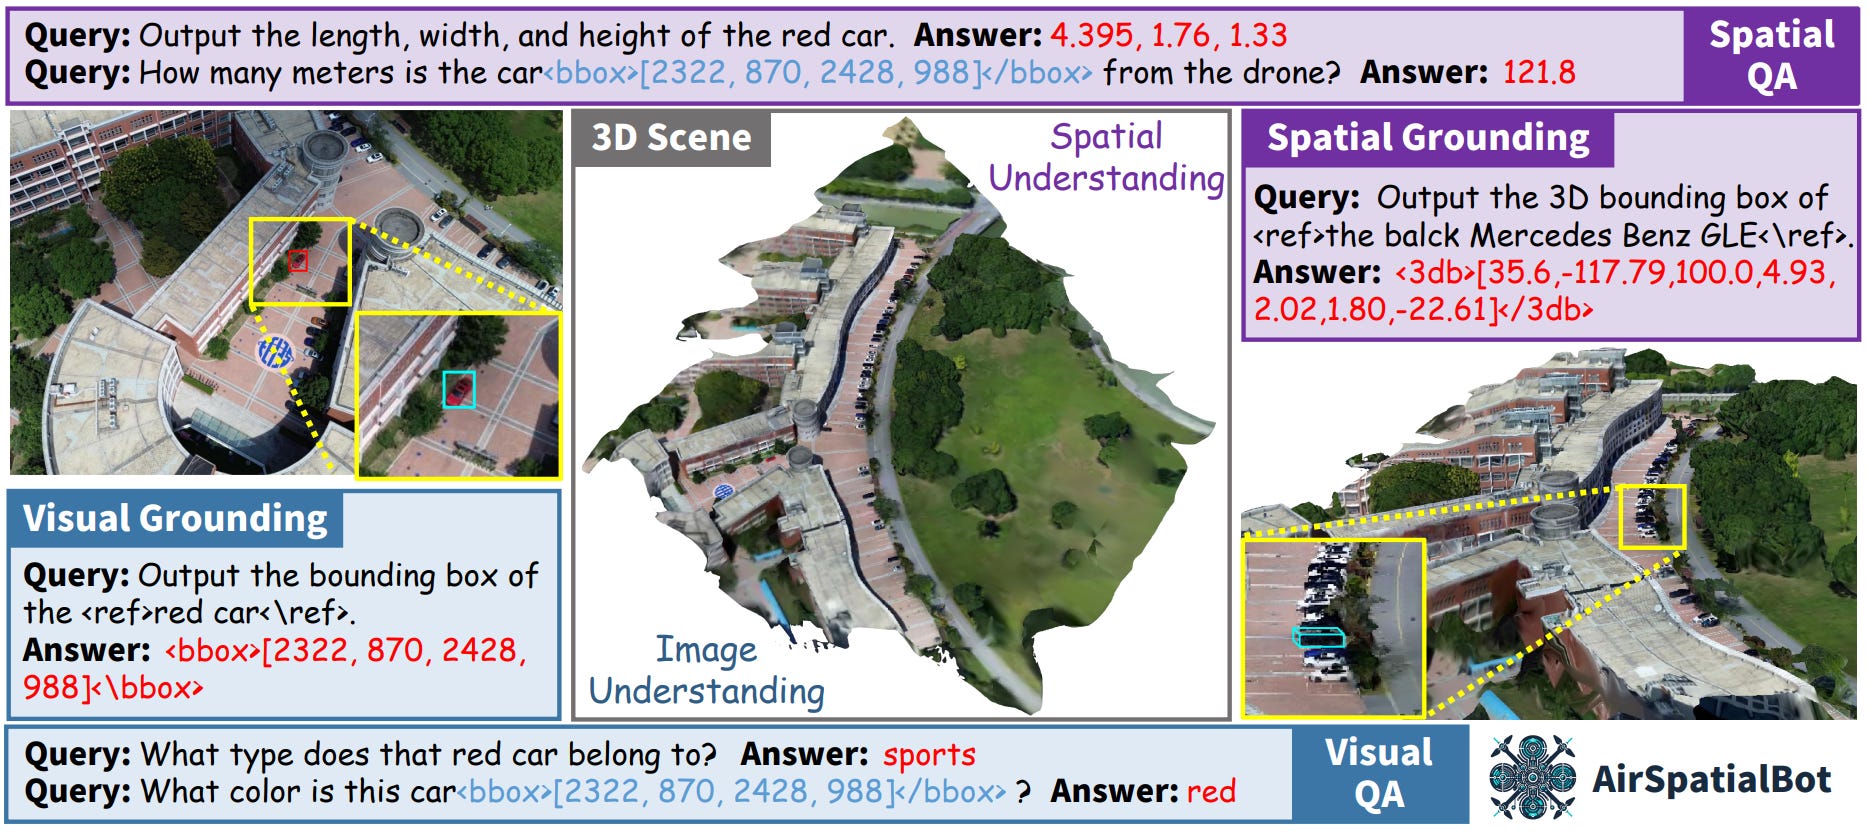
Remote sensing AI is getting sharper, yet it still struggles with a fundamental human skill: understanding 3D space. Most current models look at 2D pixels and can identify a ‘red car’, but they can’t reliably tell you its actual dimensions or how far away it is from the sensor. To bridge this gap, researchers have developed AirSpatial, a massive dataset derived from drone imagery that introduces 3D bounding boxes to the mix. By combining aerial photos with ground-level video, they have annotated thousands of vehicles with precise spatial data, allowing models to move beyond simple visual recognition to true spatial grounding where an AI can understand depth and scale.
The team used this data to train AirSpatialBot, an agent designed to recognise fine-grained vehicle attributes from the sky. The system uses a clever two-stage training strategy: it starts by learning standard 2D image understanding before fine-tuning on spatial tasks using techniques like Geometric Mapping Learning. Instead of just memorising what a specific car model looks like from above, the bot actually measures the vehicle’s length, width and height in the 3D scene. It then acts like a detective, cross-referencing these physical dimensions with a database to determine the exact make, model and even the price of the car, managing to distinguish between vehicles that look visually similar but differ in size.
In testing, AirSpatialBot significantly outperformed existing models like GeoChat, particularly in tasks requiring depth estimation and dimension measuring. The system excels at ‘target retrieval’, where a user can ask it to find a specific car (e.g. ‘white Mercedes-Benz C-Class’) and the bot locates it by calculating 3D coordinates. This approach is particularly flexible because it doesn’t require retraining when new car models come out; you simply update the reference table with the new dimensions. It’s a compelling step forward for drone-based embodied intelligence, suggesting that future aerial agents won’t just see the world as a flat image, but will navigate and understand it in full 3D.
3. The economics of good design
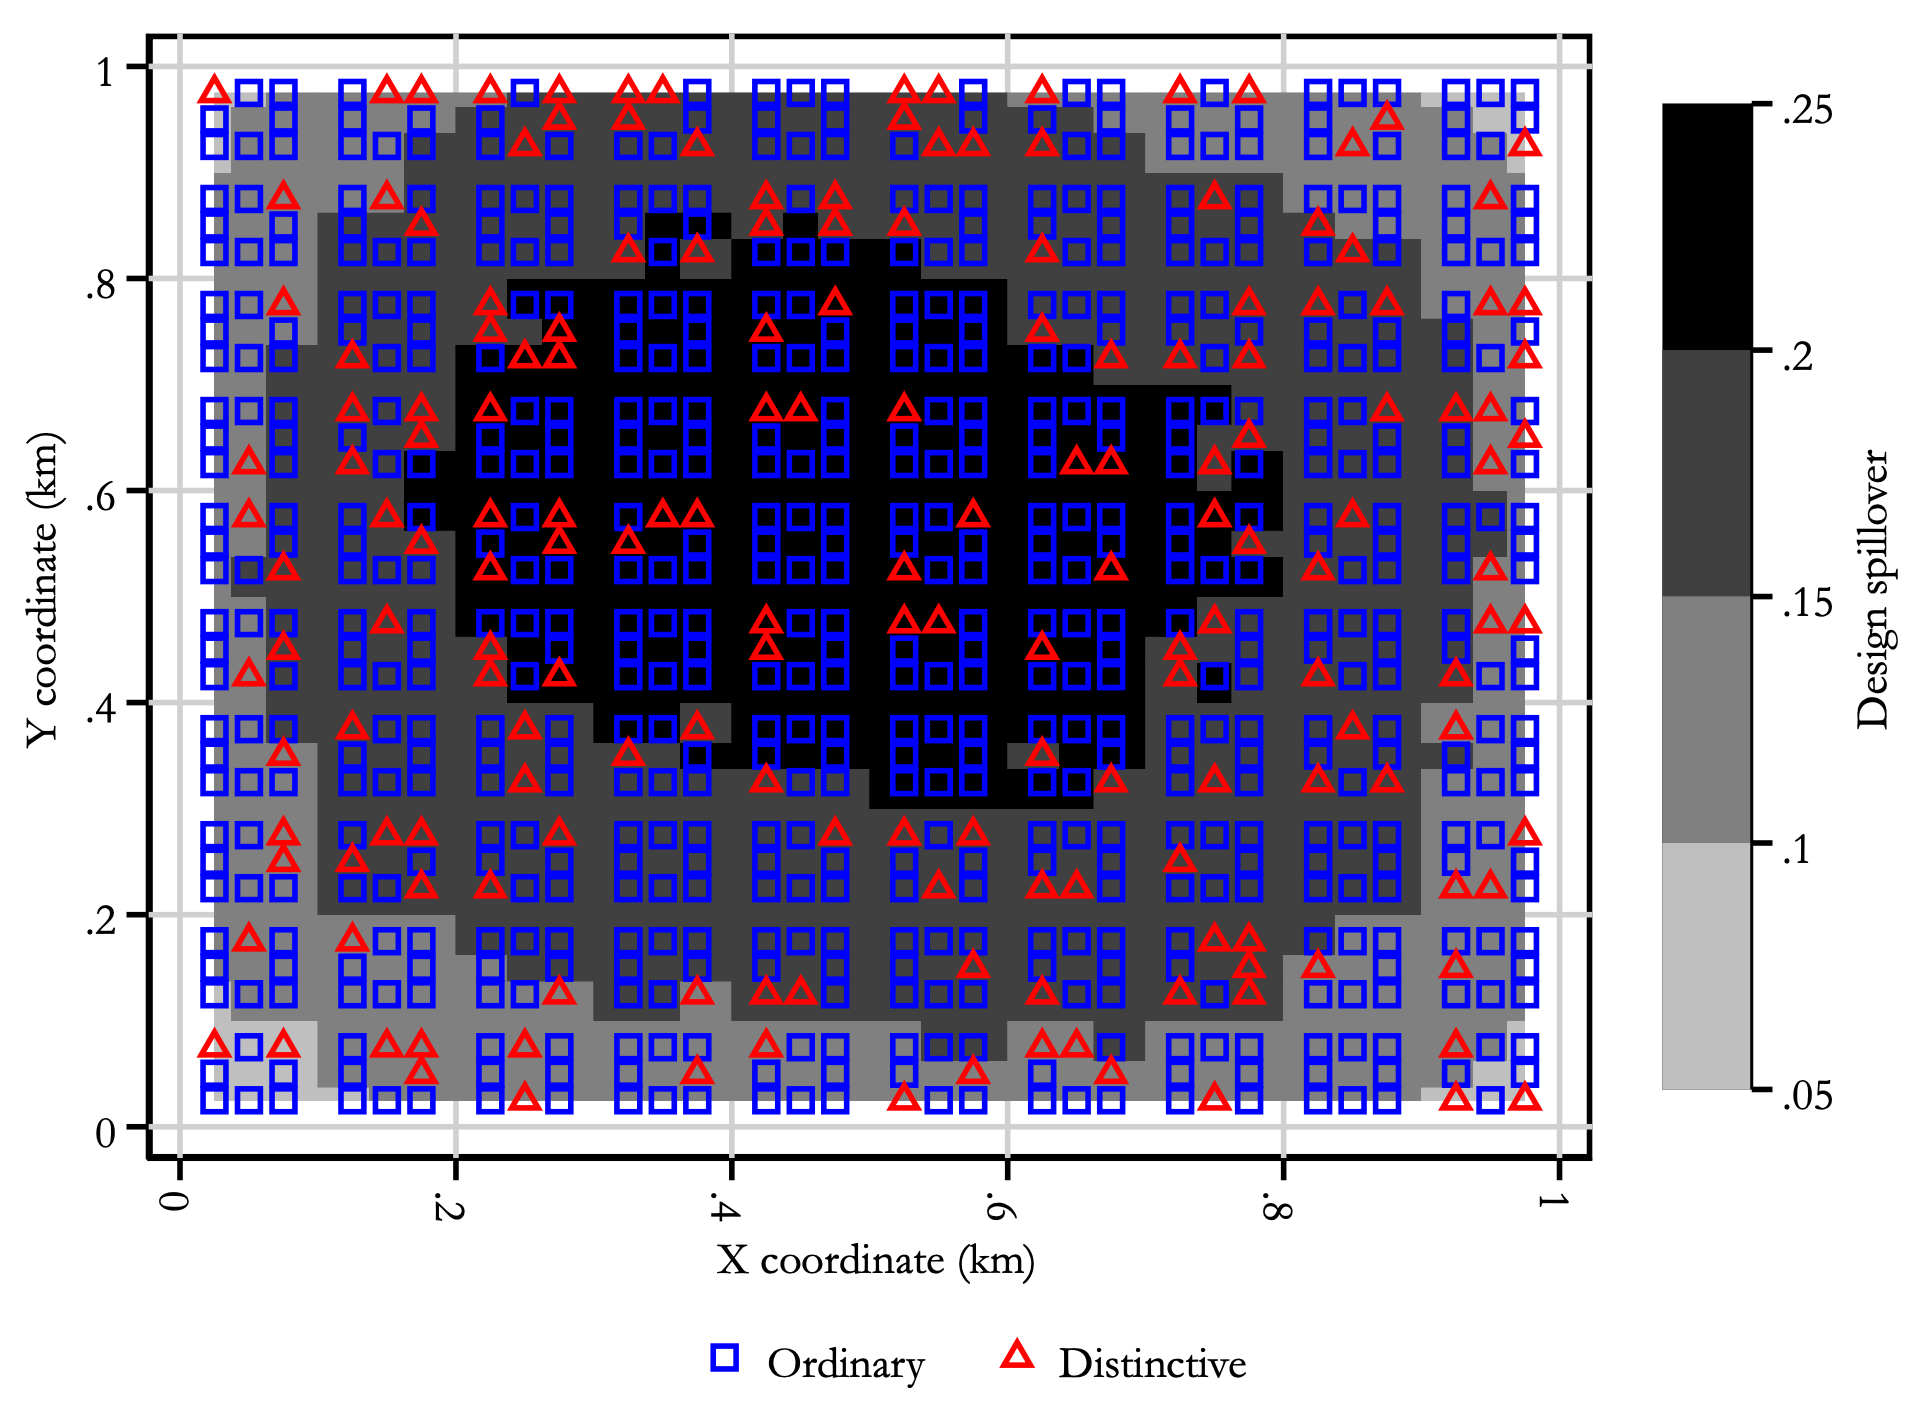
We all know that walking through a neighbourhood with stunning architecture feels better than walking through a sea of bland concrete, but quantifying that feeling has always been tricky. A new working paper takes a deep dive into the economics of architecture by combining a massive literature review with a new quantitative model. They found that distinctive buildings sell for about a 15 per cent premium compared to ordinary ones, confirming that people are willing to pay for good design. Perhaps more interestingly, they found a significant positive spillover effect where distinctive buildings boost the value of nearby properties by around 9 per cent. The catch is that building something unique is expensive, costing about 25 per cent more than a standard structure. This creates a classic coordination problem where developers under-invest in good design because they bear all the costs but only capture some of the value.
To understand how to fix this, the researchers modelled a neighbourhood where residents have different tastes for architecture. They ran a survey and discovered that people’s preferences for design are quite varied, roughly as diverse as their preferences for where to live within a city. This heterogeneity means that as you build more distinctive buildings, the premium people are willing to pay for them drops because you run out of ‘super-fans’ for that style. The model shows that without intervention, the market provides less distinctive architecture than is socially optimal. It turns out that the best way to solve this isn’t through complex zoning rules but through a direct Pigovian subsidy. Their simulations suggest that subsidising about 10 per cent of the construction costs for distinctive buildings creates the maximum welfare gain, balancing the extra cost against the aesthetic benefits for the community.
The study also throws cold water on some common planning tools. For instance, offering Floor Area Ratio (FAR) bonuses—letting developers build taller if they include good design—often backfires. Unless the city is already severely height-constrained, these bonuses tend to reduce welfare by distorting the housing supply. Similarly, relying on a ‘super-developer’ to build a whole district doesn’t necessarily help because they might restrict the supply of distinctive buildings to keep prices high. Designating small ‘distinctive districts’ (like conservation areas) can work well if they cover a small chunk of the neighbourhood, around 4 per cent, but expanding them too much leads to diminishing returns. The takeaway is that if we want better-looking cities, we should probably just pay for them directly rather than trying to engineer them through complex planning loop-holes.
4. Your location data knows more than you think
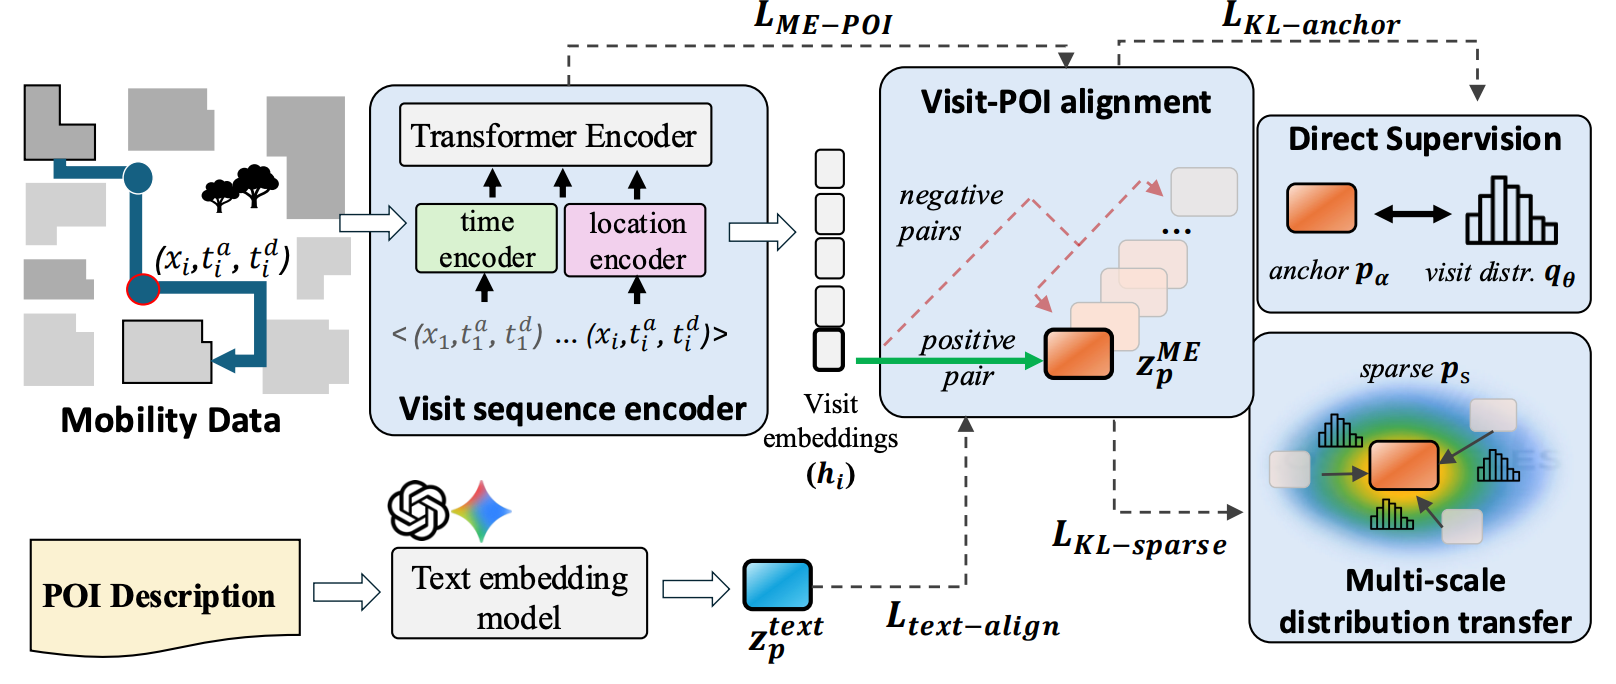
In the world of digital mapping, a point of interest (POI) is usually defined by static data: its name, category and coordinates. But as anyone who has ever visited a ‘quiet’ cafe that turned out to be a bustling co-working hub knows, a label doesn’t tell the whole story. To capture this nuance, researchers have introduced ME-POIs, a framework that enriches static POI data with patterns from large-scale human mobility. Instead of just knowing a place is a ‘restaurant’, the model learns its function by analysing visit sequences (whether it’s a quick lunch spot or a long-stay dinner venue).
The system uses a contrastive learning approach to align individual visit patterns with a global representation for each POI. One clever trick they employ is a ‘multi-scale distribution transfer’ mechanism. Since most places don’t get enough visits to generate robust data on their own, the model borrows insights from nearby, popular spots to fill in the gaps for less-frequented locations. This allows it to generate meaningful insights even for the ‘long tail’ of rarely visited businesses that usually get overlooked by data-hungry algorithms.
When tested on tasks like predicting opening hours, price levels and visit intent in Los Angeles and Houston, the mobility-augmented model consistently outperformed text-only baselines. For instance, adding mobility data boosted the accuracy of predicting a venue’s price level by over 75 per cent in some cases. It turns out that how people move through a city—when they arrive, how long they stay, and where they go next—reveals as much about a place’s identity as its official description does.
Geospatial Datasets
1. Global building dataset
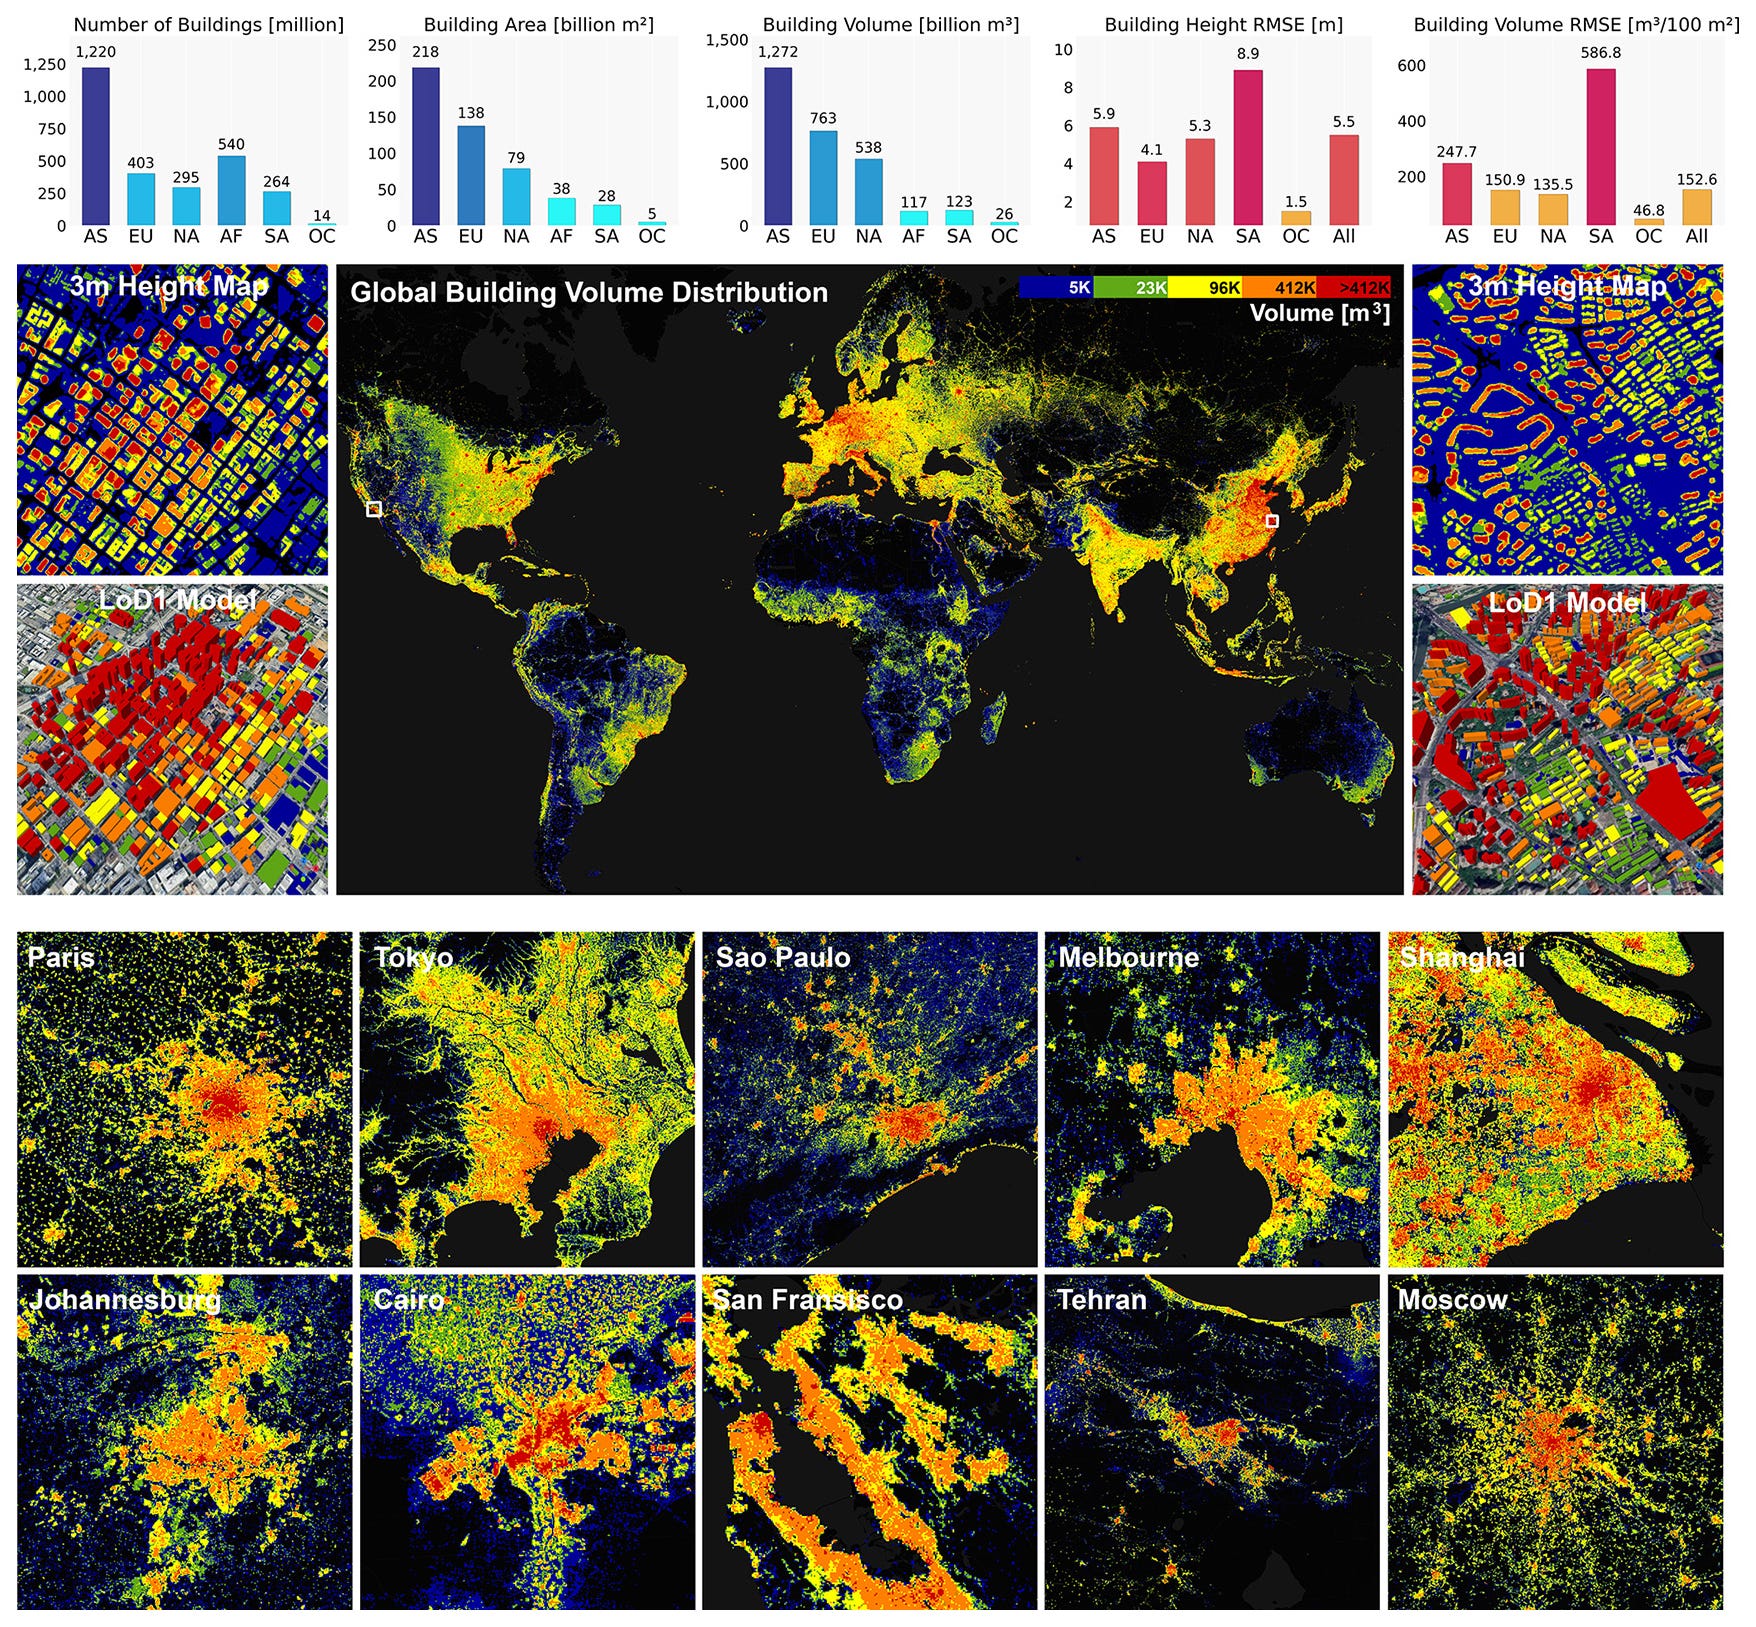
GlobalBuildingAtlas presents the first open, globally complete dataset comprising building polygons, heights, and Level of Detail 1 (LoD1) 3D models. You can access the data here and the code here.
2. Semantic vehicle trajectory dataset

Captured via Unmanned Aerial Vehicles (UAVs) over the busy Guangzhou Bridge, the High-Density Semantic Vehicle Trajectory (HDSVT) dataset fills a gap in autonomous driving resources by providing long-duration tracking in high-density scenarios. You can access the data here.
3. Transport systems database

The African Transport Systems Database (AfTS-Db) stands as the first comprehensive, geolocated multi-modal transport database for the entire African continent. You can access the dataset here and the code here.
4. Global leaf chlorophyll content dataset

The MuSyQ Global LCC product revolutionises ecosystem monitoring by leveraging Sentinel-2 imagery to map leaf chlorophyll content at an impressive 10-m resolution. You can access the data here and the code here.
Other useful bits
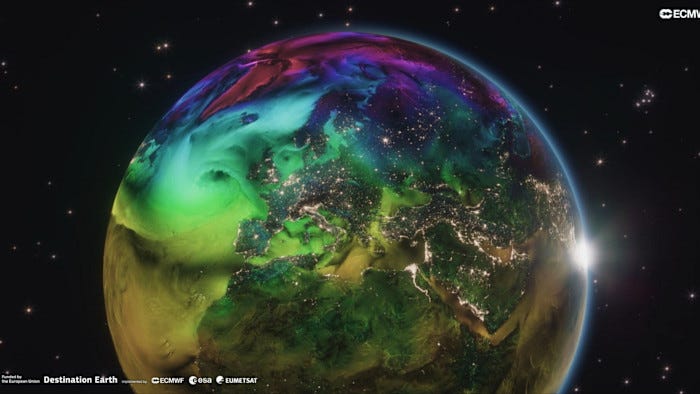
Europe’s Destination Earth project is taking climate modelling to the next level with a high-resolution ‘digital twin’ of our planet. This AI-powered simulation isn’t just about sharper weather forecasts; it’s already helping to optimise renewable energy and map urban heat, providing a crucial dashboard for understanding Earth’s complex systems.
In its latest impact report, Planet Labs reveals how its daily Earth imagery is driving real-world change, from helping conservationists protect endangered species to spotting massive methane leaks in Texas.
Albedo has shared a candid look at its Clarity-1 mission, proving that satellites can indeed thrive in the harsh environment of Very Low Earth Orbit (VLEO). Although the mission ended early due to hardware issues, it successfully validated the platform’s core tech, paving the way for ultra-high-resolution 10 cm imagery in the future.
Data Center GeoSniffer is a fascinating new tool that merges AI permit scraping with satellite imagery to track critical infrastructure expansion across the US. By providing a ‘neural sniff’ of the grid, it allows users to look past the paper trail and spot physical changes like new substations and generator pads.
Jobs
Center for International Forestry Research (CIFOR) is looking for a remote Spatial Data Scientist
International Water Management Institute (IWMI) is looking for a Senior Geospatial Data Engineer based in Colombo, Sri Lanka
Impact Initiatives is looking for a Senior Assessment officer based in Geneva, Switzerland.
CERN is looking for a GIS Specialist based in Geneva, Switzerland
Just for Fun

New research reveals that space travel can actually cause an astronaut's brain to shift upwards in the skull, leading to disorientation that lingers long after they return to Earth. Understanding these ‘sensory conflicts’ is now seen as a vital step before we embark on longer missions to the Moon or Mars.
That’s it for this week.
I’m always keen to hear from you, so please let me know if you have:
new geospatial datasets
newly published papers
geospatial job opportunities
and I’ll do my best to showcase them here.
Yohan