Estimating historical GDP from geospatial data on famous figures
PLUS: concerning issues with EO data accuracy, foundation models for crop mapping, Google Flood data, and more.
Hey guys, here’s this week’s edition of the Spatial Edge — a weekly round-up of geospatial news. The aim is to make you a better geospatial data scientist in less than 5 minutes a week.
I’m happy to say that Professor Neil Lee has sent the first testimonial for this newsletter, calling it " life-changing” (before adding, “I was actually talking about the Economist”). Anyway, we’ll take what we can get…
In today’s newsletter:
Estimating Historical GDP: Using geocoded data on famous figures.
EO Data Variability: Different datasets impact the accuracy of economic analyses.
Crop Mapping Models: Foundation models improve global crop mapping.
Flood Forecasts: Google Flood Hub offers 7-day forecasts.
New foundation model: IBM and NASA introduce Prithvi WxC model
Research you should know about
1. Estimating historical GDP from data on historical figures
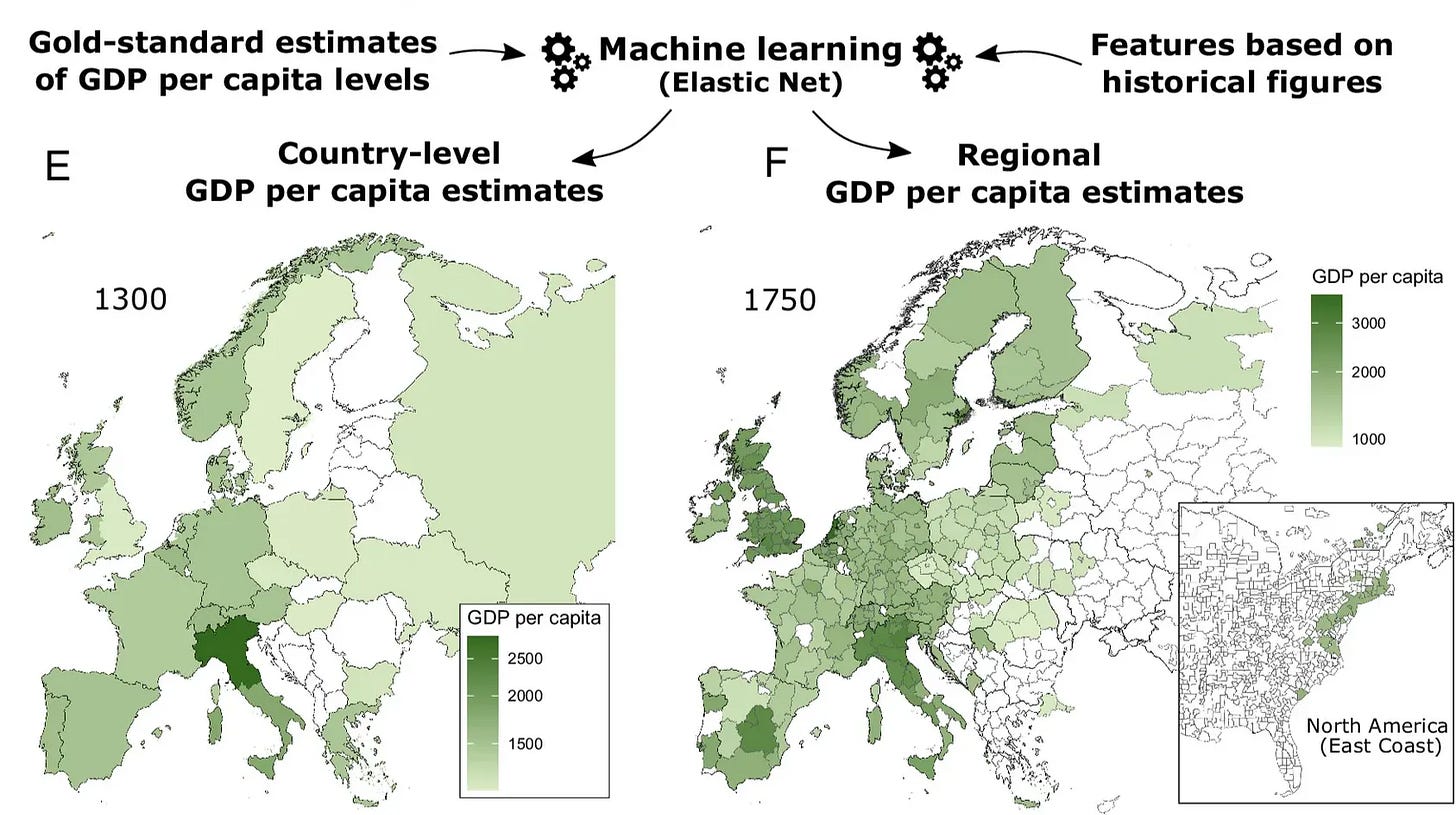
A new study by researchers from the University of Toulouse has found a way to estimate historical GDP per capita for European and North American regions over the past 700 years. Since we don’t have precise historical economic data from these times, the team used information about where famous historical figures were born and died to model economic development.
They compiled data on over 560,000 historical figures from Wikipedia and Wikidata. They captured a bunch of info like birthplaces, death places, occupations, and levels of fame. By mapping this information, they created a geospatial picture of cultural and economic activity. They then used elastic net regression to predict GDP per capita, and validated their results against existing historical GDP data.
Now, you’re probably wondering how this all works. Well, the argument for using this as a proxy for historical economic activity is that inventors like James Watt were able to improve productivity and reduce disease burdens. Many inventors were also fairly mobile, so more ‘economically active’ regions were able to attract talent, which led to further economic activity being created.
Their model was supposedly pretty accurate, explaining over 90% of the variation in GDP per capita. Their estimates matched known historical trends, such as Northern Europe's economic rise and the Atlantic trade routes' impact.
In any case, the study is equal parts interesting, novel, and wild. But I do find it a bit hard to believe…
P.S. The data and code are available via Github.
2. Examining the issue of inaccurate EO datasets in economic analyses
New research from the University of Arizona and the World Bank shows that different weather datasets, despite supposedly measuring the same thing, often give very different results—raising questions about their accuracy.
This issue really frustrates me in the EO space. Datasets measuring the same thing often produce wildly different outcomes, leading to cherry-picking datasets for favourable econometric results. I've often wondered how big this problem is, and this study offers a bit of clarity.
The researchers combined nine EO datasets (including ARC2, CHIRPS, CPC, ERA5, and MERRA-2) with georeferenced household survey data from six Sub-Saharan countries. Using the World Bank’s LSMS-ISA surveys, they matched weather data to precise household locations to examine how dataset choice influences the relationship between weather and smallholder agricultural productivity.
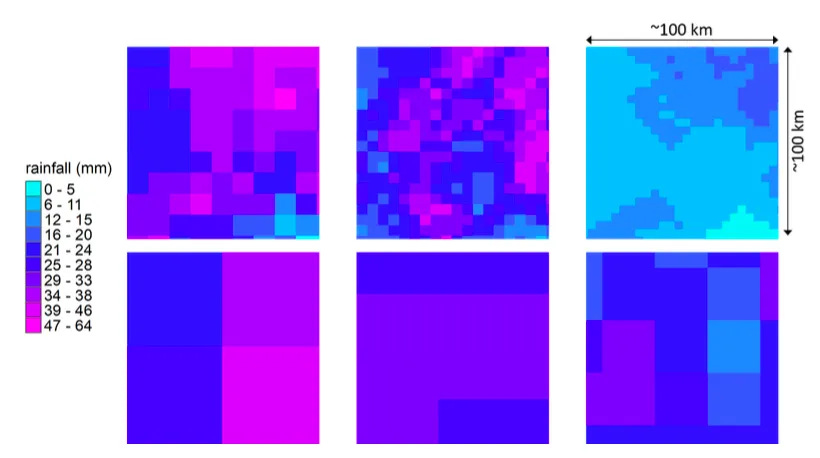
The results are pretty worrying, as there’s A LOT of variability between datasets. For example, CPC reports 50% less rainfall than other datasets in Ethiopia and Malawi, and dry days differ significantly between ARC2, CHIRPS, CPC, ERA5, and MERRA-2. The regression coefficients estimating the impact of weather variables on agricultural productivity not only varied in magnitude but also changed in sign depending on the EO dataset used.
My solution is to try and triangulate various EO datasets, to see which datasets are ‘outliers’ and should be treated with caution. This probably isn’t the best approach, but at least it’s relatively scalable.
3. Generalising foundation models for crop type mapping
A new paper investigates how well foundation models for Earth observation generalise to new geographies when mapping crop types across different regions.
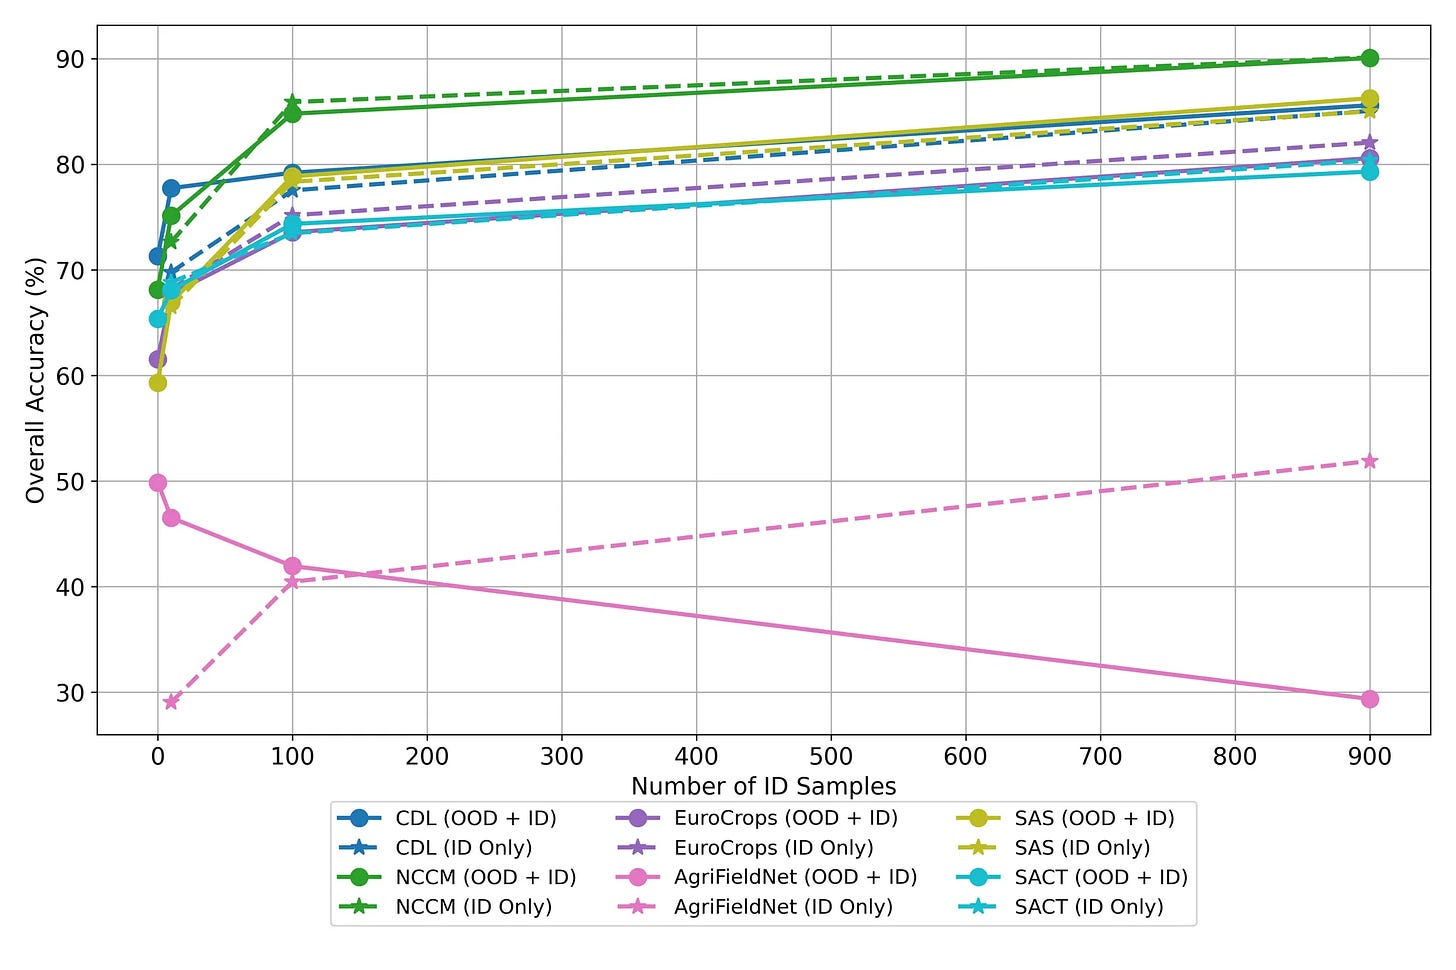
The study harmonised six crop classification datasets from five continents, focusing on maize, soybean, rice, and wheat. They paired these labels with cloud-free Sentinel-2 satellite images, creating a global dataset integrated into TorchGeo. Using this data, they fine-tuned a U-Net decoder with frozen ResNet-50 encoders pre-trained on different datasets: SSL4EO-S12, SatlasPretrain dataset, and ImageNet.
Their experiments showed that the model pre-trained on SSL4EO-S12 consistently outperformed the others across all regions, achieving up to 9% higher accuracy. For instance, on the CDL dataset in the United States, the SSL4EO-S12 model achieved an overall accuracy of 87.37%, compared to 77.87% for SatlasPretrain and 78.77% for ImageNet. Similarly, on China's NCCM dataset, the SSL4EO-S12 model reached 88.75% accuracy, outperforming SatlasPretrain's 80.56% and ImageNet's 82.71%.
The bottom line is that combining limited local data with globally pre-trained models like the one based on SSL4EO-S12 can enhance crop mapping accuracy.
Geospatial datasets
1. Google Flood Hub
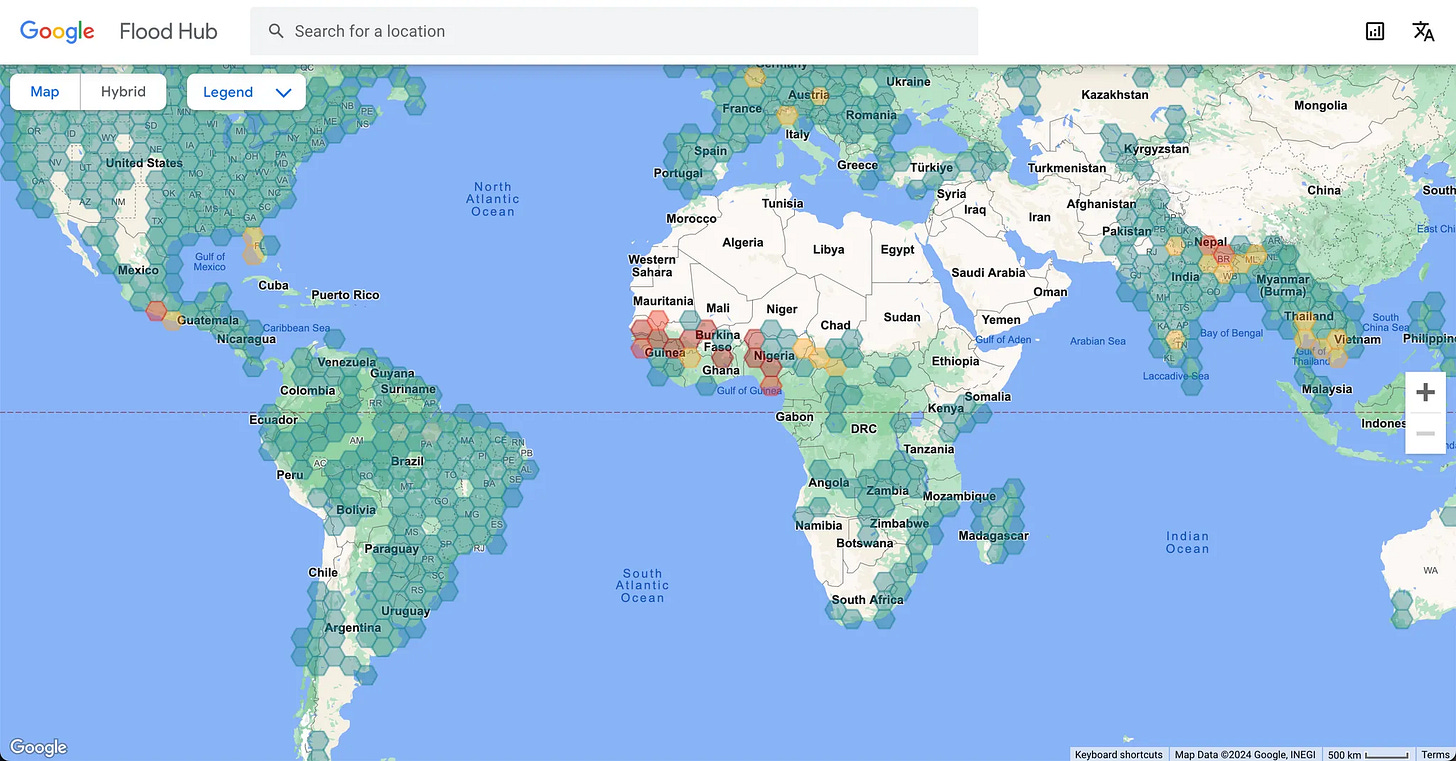
Google Flood Hub provides users with flood data and forecasts up to seven days in advance. It includes local river flood maps, water trends, and real-time alerts. Flood Hub currently covers river basins in over 80 countries, covering over 1,800 sites and 460 million people.
2. Fields of the World (FTW) dataset
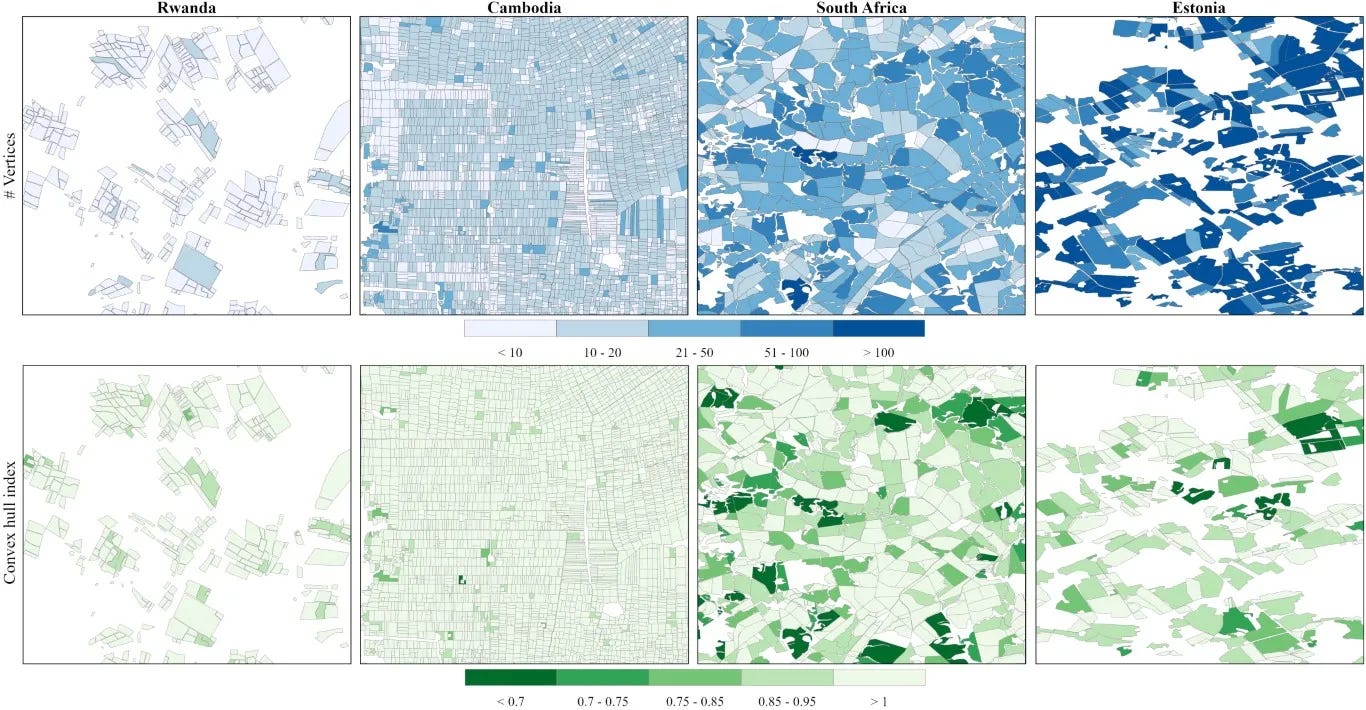
The Fields of The World (FTW) dataset is a new resource for mapping agricultural field boundaries, covering 24 countries across Europe, Asia, Africa, and South America. It provides annotated Sentinel-2 satellite images with instance and semantic segmentation masks, helping researchers develop better models for field detection and segmentation. This dataset aims to enhance agricultural monitoring and support sustainable farming practices worldwide.
You can access the dataset and code here.
3. SEN12-WATER dataset
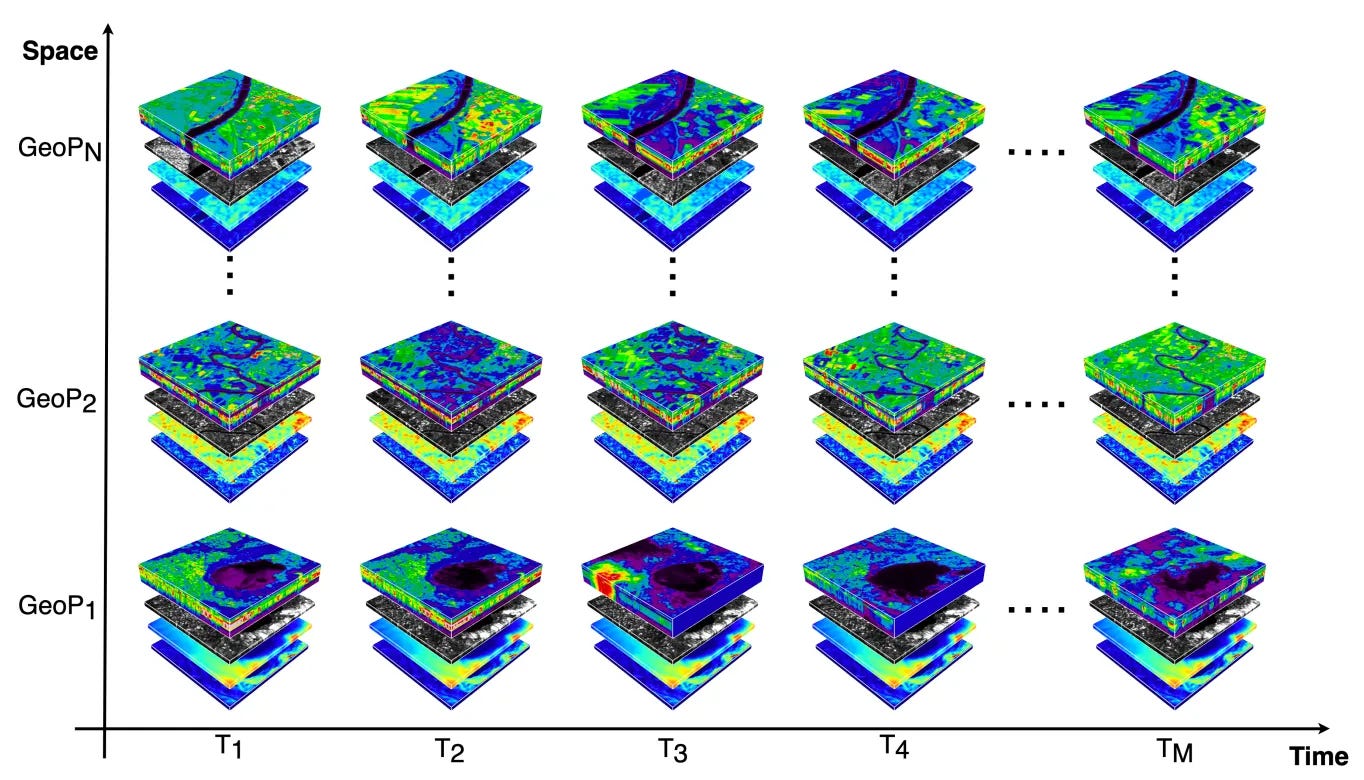
The SEN12-WATER dataset helps address water management issues caused by climate change. It integrates SAR polarisation, elevation, slope, and multispectral optical bands to create a datacube for analysing water dynamics. Using this dataset, researchers developed an end-to-end deep learning framework for tasks like speckle noise removal and water body segmentation, to better predict water loss in reservoirs.
Please note that the full dataset hasn’t yet been released, but you can contact the authors to request early access.
4. Compound hot-dry events (CHDE) dataset
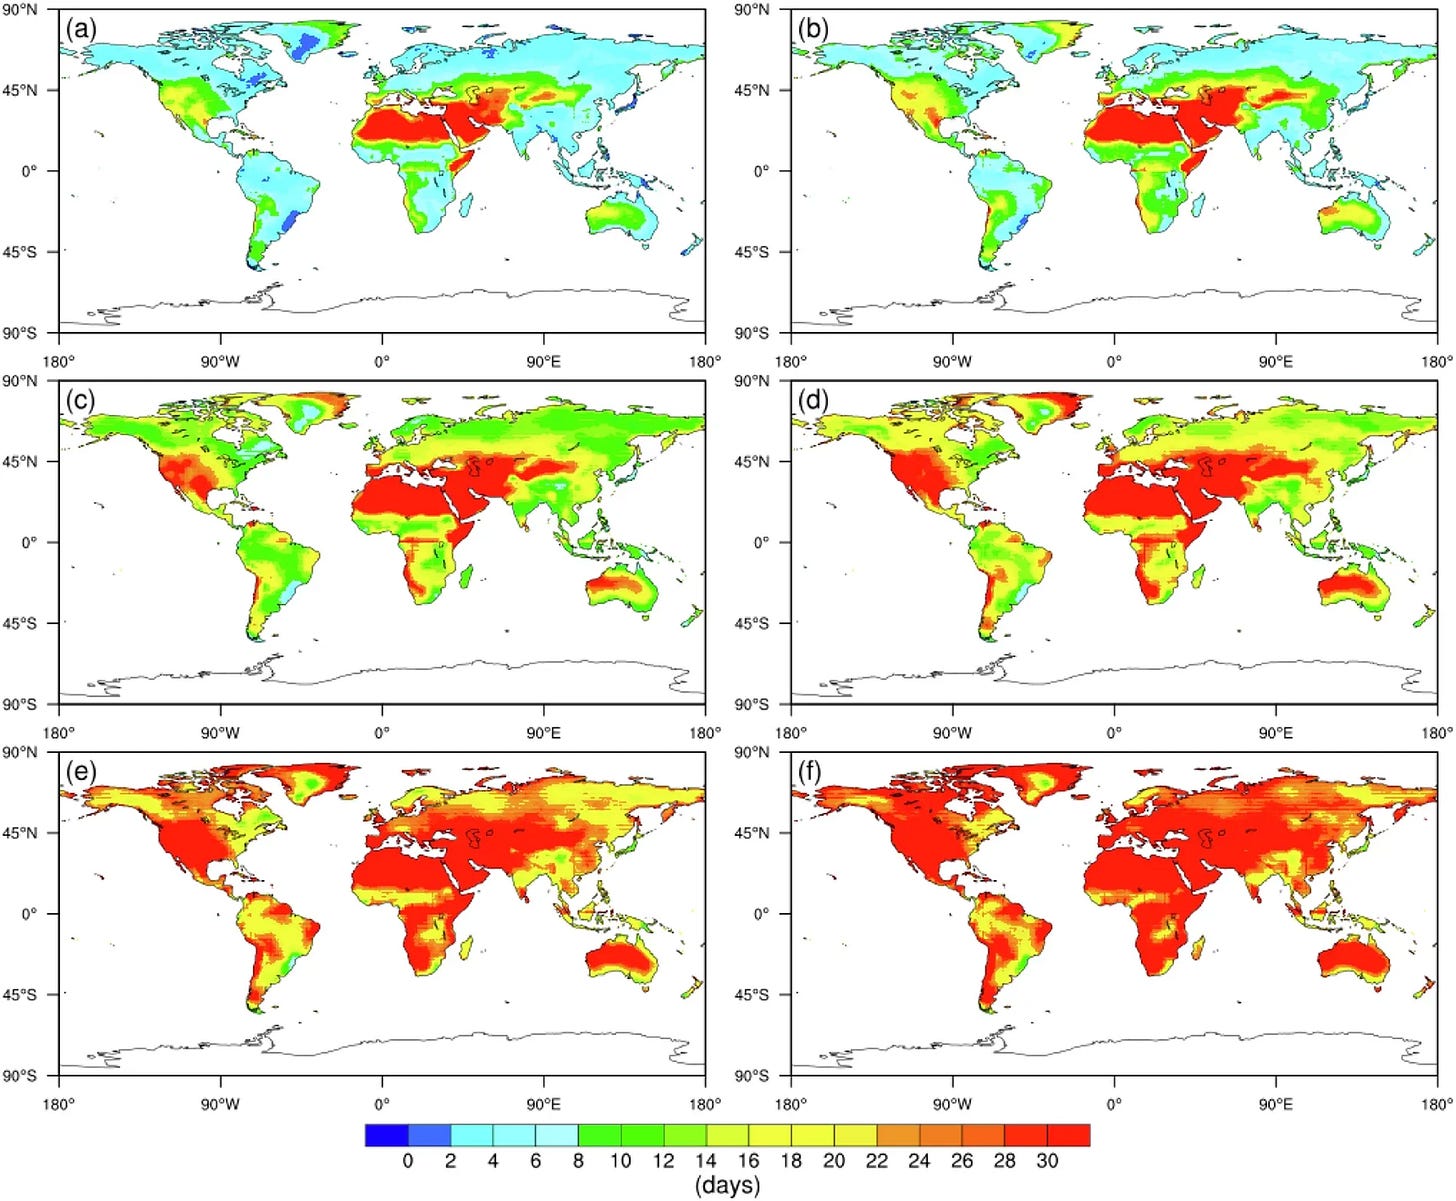
A new global dataset on compound hot-dry events (CHDEs) assesses the impacts of climate change on extreme weather conditions. It provides monthly data on the duration, precipitation intensity, and temperature intensity of CHDEs under various future climate scenarios (SSP1-2.6 to SSP5-8.5) for the 2050s and 2080s.
You can access the dataset here.
5. Landsat Irish Coastal Segmentation (LICS) dataset
The Landsat Irish Coastal Segmentation (LICS) dataset helps train and evaluate ML models for coastal segmentation using satellite imagery of Ireland. It provides annotated Landsat images with labels identifying different coastal features like shorelines, beaches, and cliffs.
Other useful bits
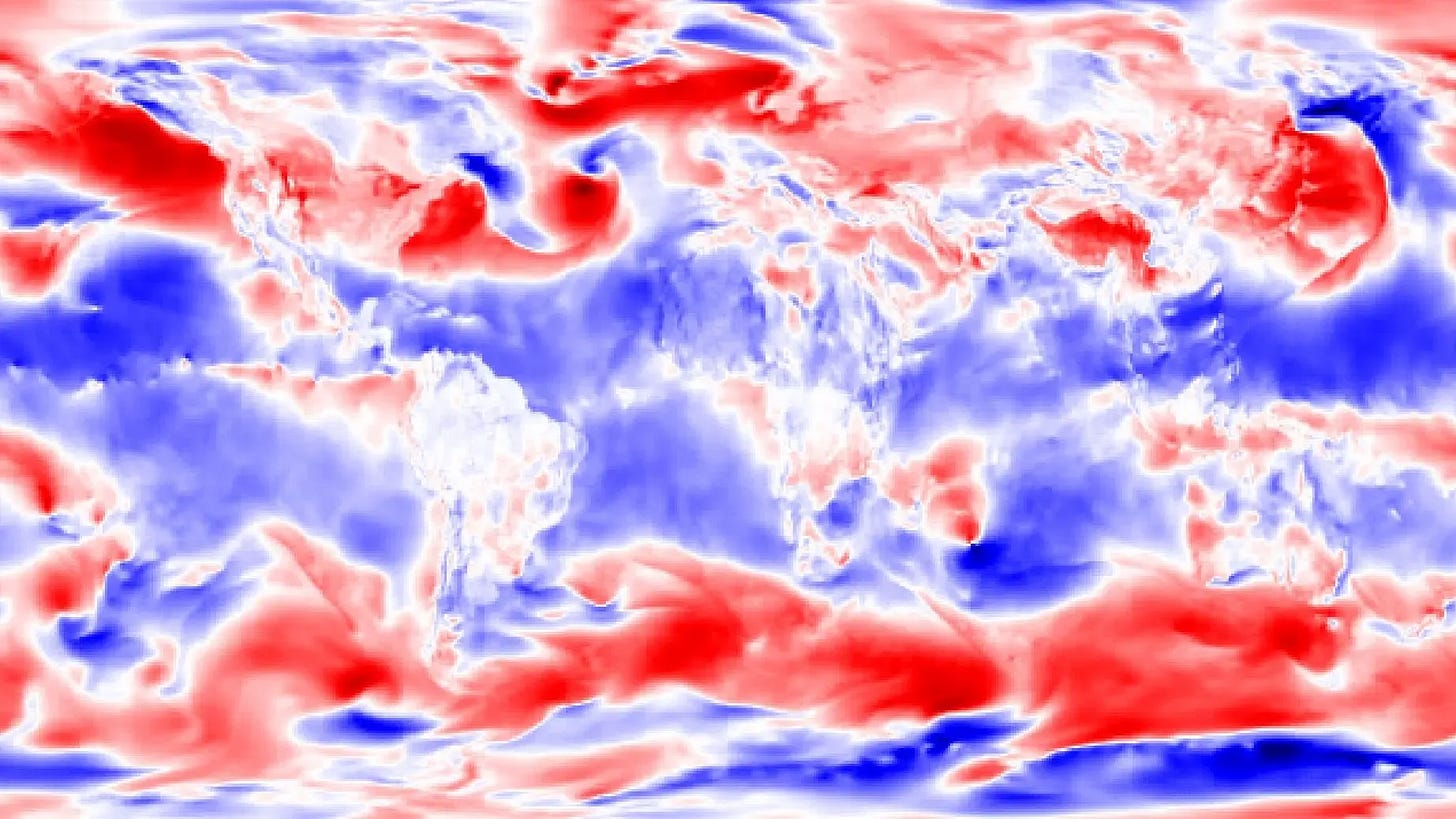
IBM and NASA have introduced Prithvi WxC, a new foundation model for weather and climate forecasting. This open-source model can be customised for a bunch of different applications, such as predicting extreme weather, downscaling data, and improving hurricane forecasts, and it runs on a standard desktop.
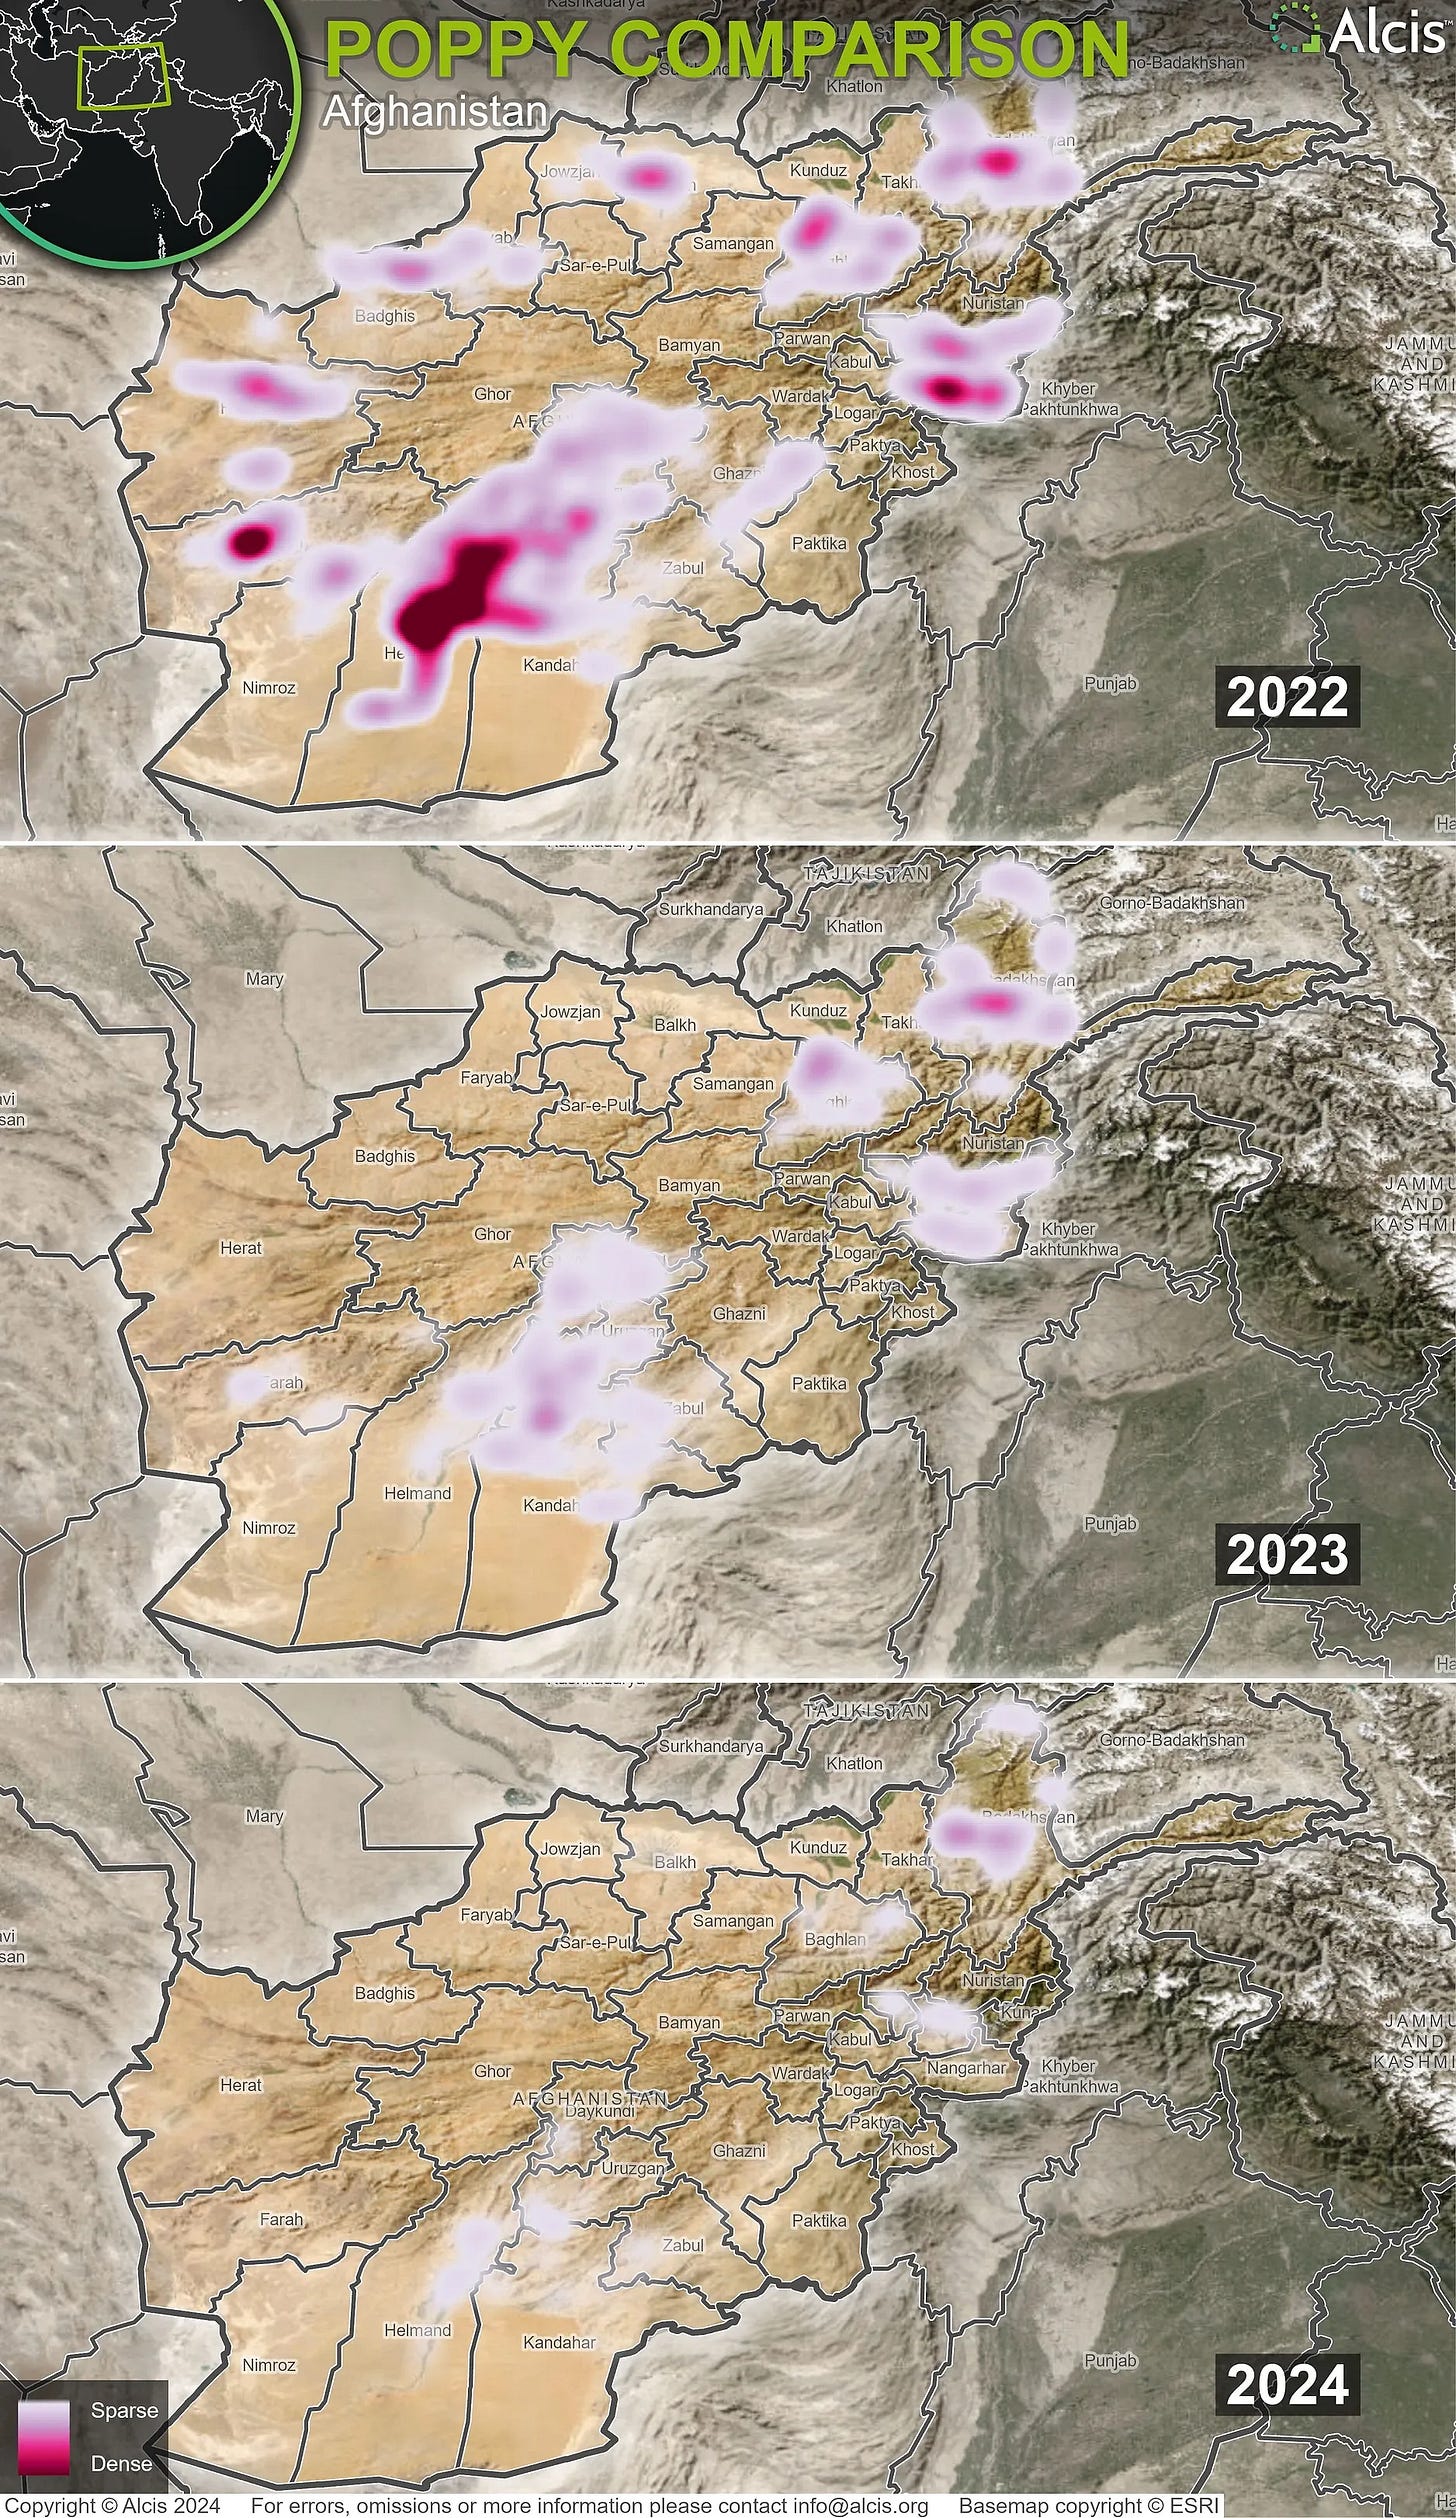
ALCIS have analysed satellite images to assess Afghanistan’s opium poppy cultivation. They found that poppy production has dropped to record lows for the second year in a year, following the Taliban’s drug ban. Despite this drop in supply, opium prices have fallen over the last nine months.
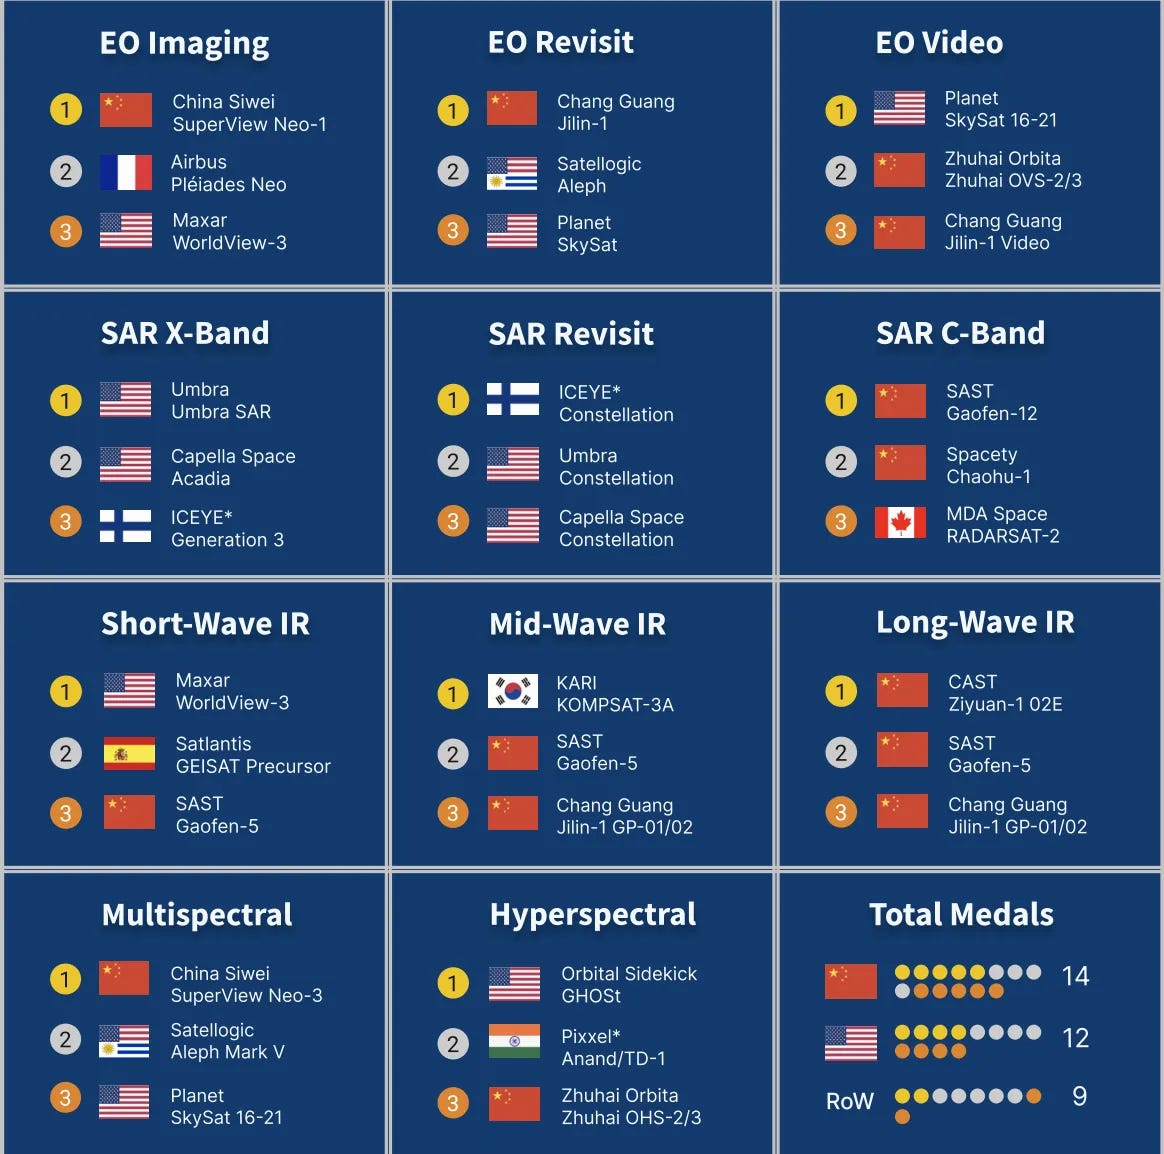
The 2024 Commercial Remote Sensing Global Rankings have been published. Four major geospatial institutions—CSIS, Taylor Geospatial Institute, Taylor Geospatial Engine, and USGIF—teamed up to rank the top three commercial space-based remote sensing systems in the world. You can also check out the full report here.
The IEA, UNEP, and EDF have launched a new framework to help oil and gas companies reduce methane emissions and boost transparency. With methane emissions and flaring still at high levels, this helps track progress and pushes companies to follow through on their climate commitments. If fully implemented, it could halve global methane emissions from oil and gas by 2030.
Jobs
Orbital Insight/Privateer is looking to fill several vacancies, ranging from Director roles to Data Scientists and Engineers.
The European Environment Agency is looking for an Expert to lead the implementation of the Copernicus Contribution Agreement.
The World Bank is looking for a Data Scientist to join their Data Lab and Development Data Partnership team.
Hummingbirds is looking for a Remote Sensing Intern based in Paris, France who will support their Nature-based Solutions portfolio development.
ESA is looking for an Earth Observation Digital Innovation Engineer based in Frascati, Italy who will work within their ESA ɸ-lab.
Geospatial insight of the week
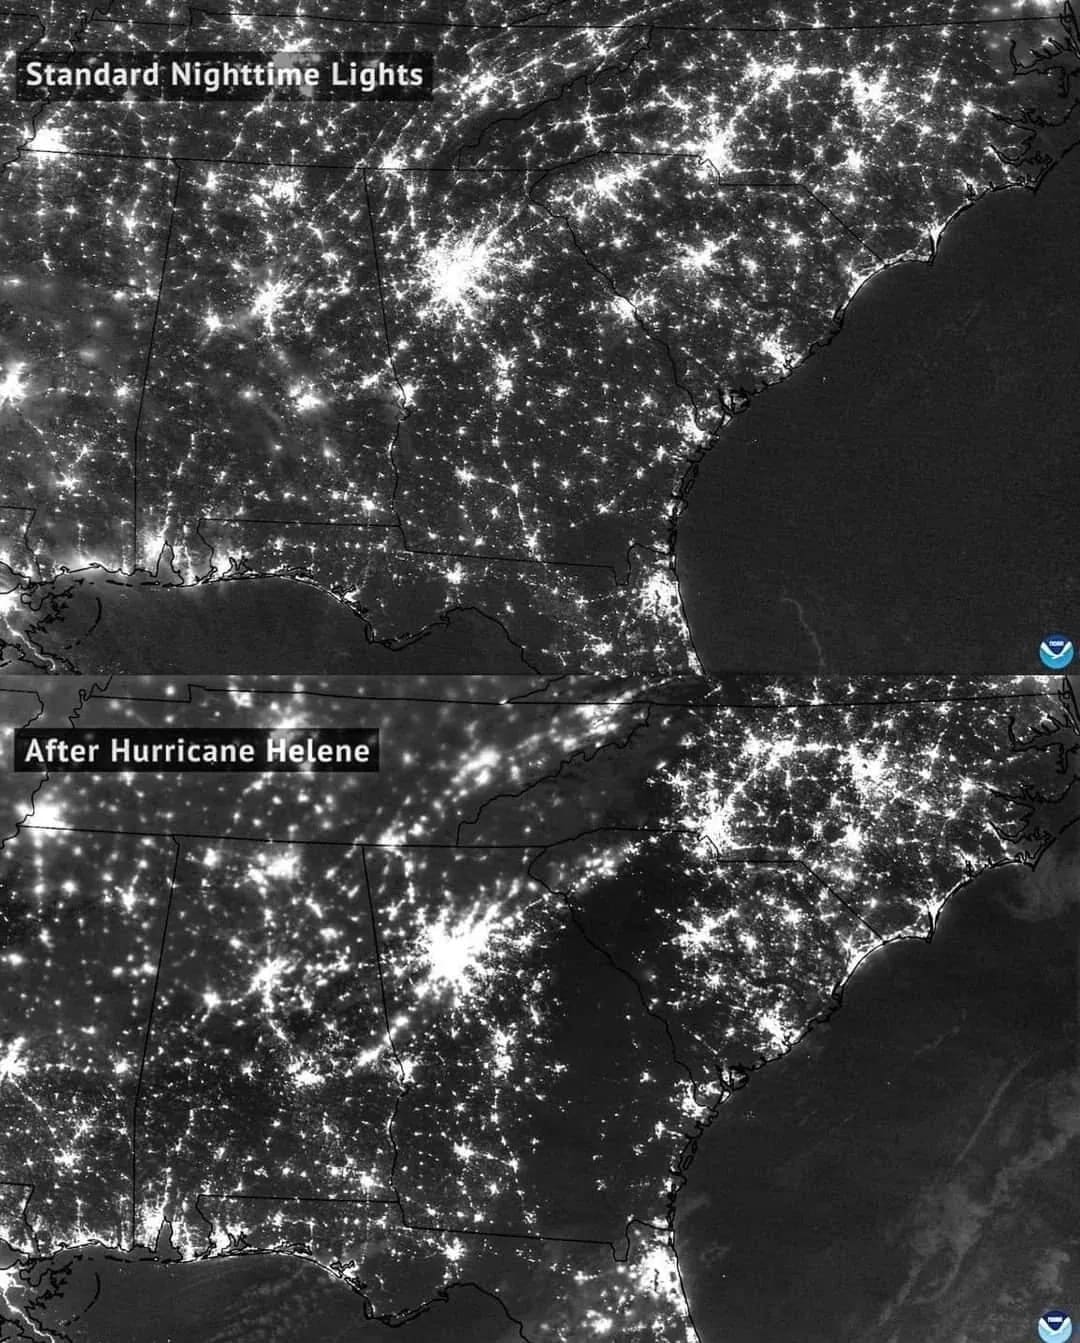
Hurricane Helene caused widespread destruction in the US. Here’s a before and after of night time lights in the region.
That’s it for this week.
I’m always keen to hear from you, so please let me know if you have:
new geospatial datasets
newly published papers
geospatial job opportunities
and I’ll do my best to showcase them here.
Yohan


