🌐 Estimating refugee populations from space
PLUS: Improving air quality predictions, ship detection methods, and new agricultural datasets.
Hey guys, here’s this week’s edition of the Spatial Edge — a weekly round-up of geospatial news that you can digest in less than 5 minutes. The information contained herein is guaranteed to help you make more friends on MySpace.
In today’s newsletter:
Mapping Refugees: High-res population maps by UNHCR and WorldPop
Air Quality Modelling: Time series models improve pollution predictions
Ship Detection: Comparing optical and hyperspectral sensors for tracking
Livestock Data: Harmonised dataset for 43 European countries
Hospital Access: 1-km accessibility maps across China
Before getting into the newsletter, I just want to say it was awesome to meet a bunch of you at the East Asian Economic Association conference in Bangkok last week.
It’s great to see how many people are using geospatial data in economic analysis these days.
Looking forward to next year’s conference in Manila.
Research you should know about
1. High-resolution mapping of refugee populations
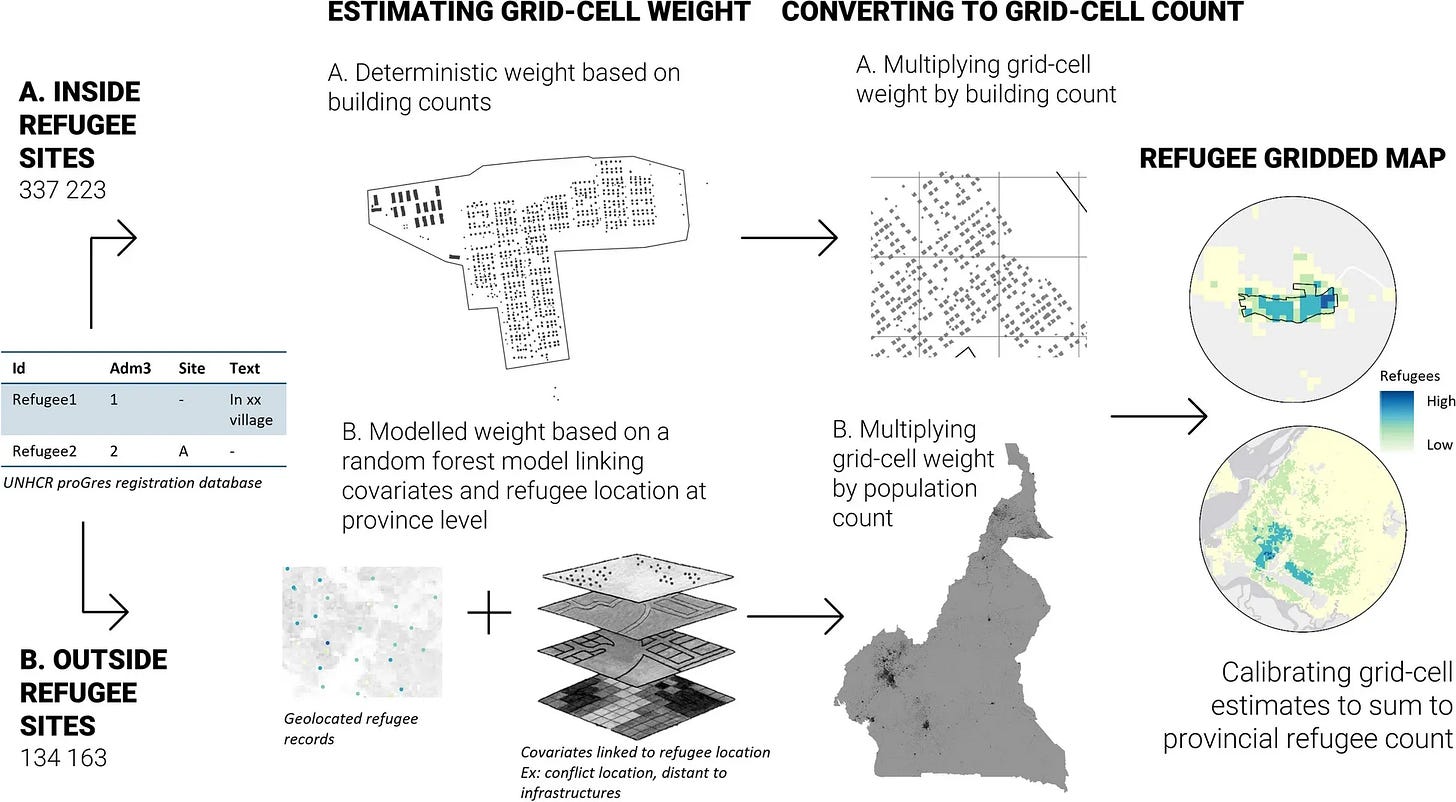
The good folks at WorldPop and UNHCR have presented a new method of mapping refugees at a granular level in Cameroon.
The team used a bunch of different datasets:
UNHCR's proGres refugee registration database, which contains individual records of refugees,
high-resolution population maps,
OpenStreetMap data, and
satellite-derived settlement maps (e.g. World Settlement Footprint)
Inside monitored refugee sites, they allocated refugee totals to 100-metre grid cells based on building counts from satellite imagery. For areas outside these sites, they used a random forest model to assign refugee counts across grid cells. The model geolocated textual information from the refugee register (e.g. info on landmarks, and place names) and used covariates like distance to roads and conflict locations.
The end result is a high-res refugee population map for Cameroon, achieving an accuracy level of 83%. The bottom line is that this approach provides a cost-effective way to obtain precise spatial information on refugees, which can help with humanitarian planning.
2. Improving air quality predictions using time series models
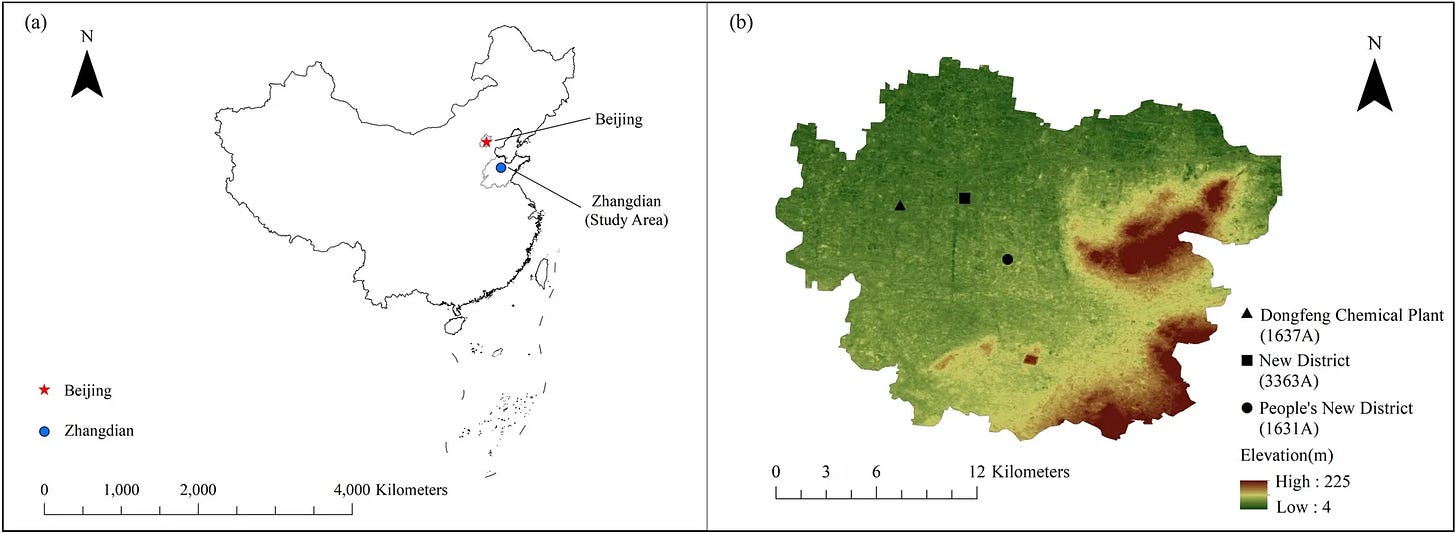
A new study in Scientific Reports introduces an improved Gaussian Hidden Markov Model (GHMM) for predicting air quality. In essence, GHMMs model sequences of data over time, especially when some underlying factors (the "hidden states") aren't directly observable. It helps predict future outcomes based on patterns and trends in historical data—in this case, air quality measurements.
The team collected:
daily air quality data,
levels of six major pollutants, and
industrial emission figures from Zhangdian District in China between 2017 and 2019.
They enhanced the traditional GHMMs by finding the optimal number of hidden states to better capture the patterns in the data. They also introduced techniques like Multi-day Weighted Matching and Fixed Training Set Length to reduce prediction errors. Then, instead of predicting the overall Air Quality Index (AQI) directly, they took an indirect approach by first predicting the individual pollutant indices and then calculating the AQI from those.
Their improved GHMM was more accurate, with a Mean Absolute Error (MAE) of 13.59 and a Root Mean Squared Error (RMSE) of 17.59. When they combined their model with another one that factors in weather conditions, the predictions got even better (MAE = 11.59, RMSE = 14.87).
I’m hoping these advancements can help us model air pollution more accurately. I’m being driven a bit crazy by how different websites and tools that measure air pollution can provide wildly different results.
3. Assessing methods to detect ships from space
A new paper reviews approaches to marine surveillance by comparing two types of remote sensing approaches: optical and hyperspectral sensors. Finding better ways to monitor ships can help us with estimating maritime trade, as well as detecting ‘dark shipping’ activities.
The team analysed how both sensor types detect and classify ships, using various datasets and techniques like image processing and GIS to boost accuracy. Optical sensors take pictures using visible and near-infrared light, while hyperspectral sensors collect detailed information across many wavelengths. This combo helps identify ships in large ocean areas, even if they’re small or spread out.
The tl;dr:
Optical sensors provide high-resolution images but can miss small targets in big spaces. They can also be impacted by atmospheric conditions.
Hyperspectral sensors are better at identifying materials based on their unique spectral signatures, which can improve detection rates.
Geospatial datasets
1. Harmonised livestock dataset
This dataset from Scientific Data provides detailed information on livestock across over 73,000 areas in 43 European countries. I think this can be pretty useful for improving geospatial estimates of agricultural GDP.
2. 1km maps of hospital accessibility
Another paper from Scientific Data provides a detailed map of hospital access across China at a 1km level, focusing on both travel times and hospital capacity relative to local populations. They use OSM and WorldPop data and feed it into a Gaussian two-step floating catchment area (Ga2SFCA) method
P.S. You can access the code here.
3. Automated vehicle (AV) dataset
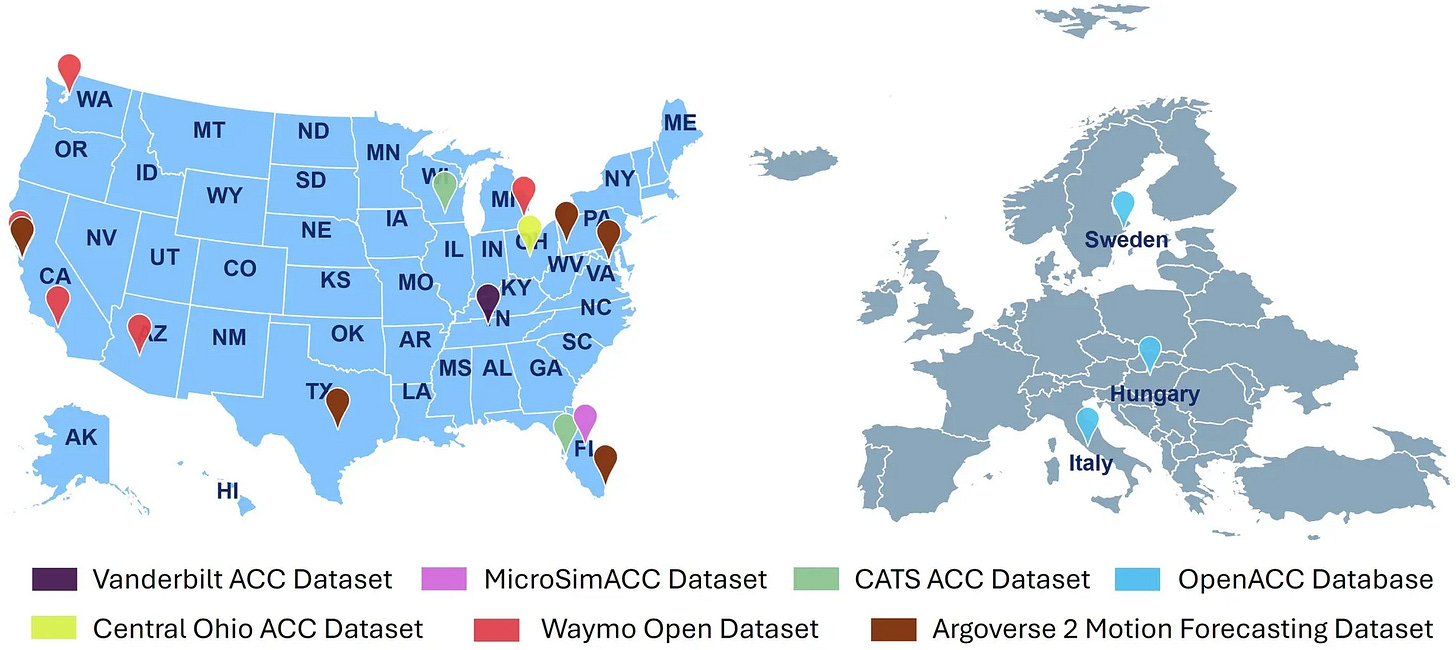
The Ultra-AV dataset provides detailed information on Automated Vehicle (AV) behaviour — i.e. self-driving cars, which can help us assess AV impacts on traffic flow, safety, and the environment. The data is collected from 14 sources and covers various AV types and driving scenarios.
P.S. You can access the code here.
4. Cycling race results dataset
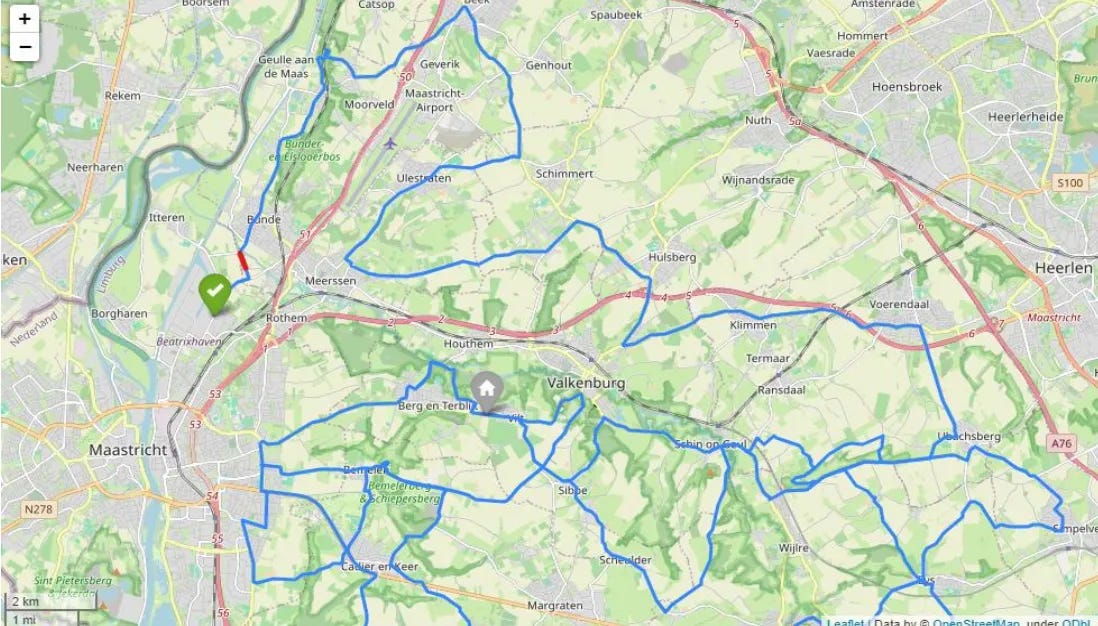
I love random geospatial datasets. And here’s a new one I stumbled upon. It’s a geospatial dataset on road cycling race results, which provides cycling analytics data compiled from GPX files of over 8,000 races (2017–2023) from the La Flamme Rouge website.
Other useful bits
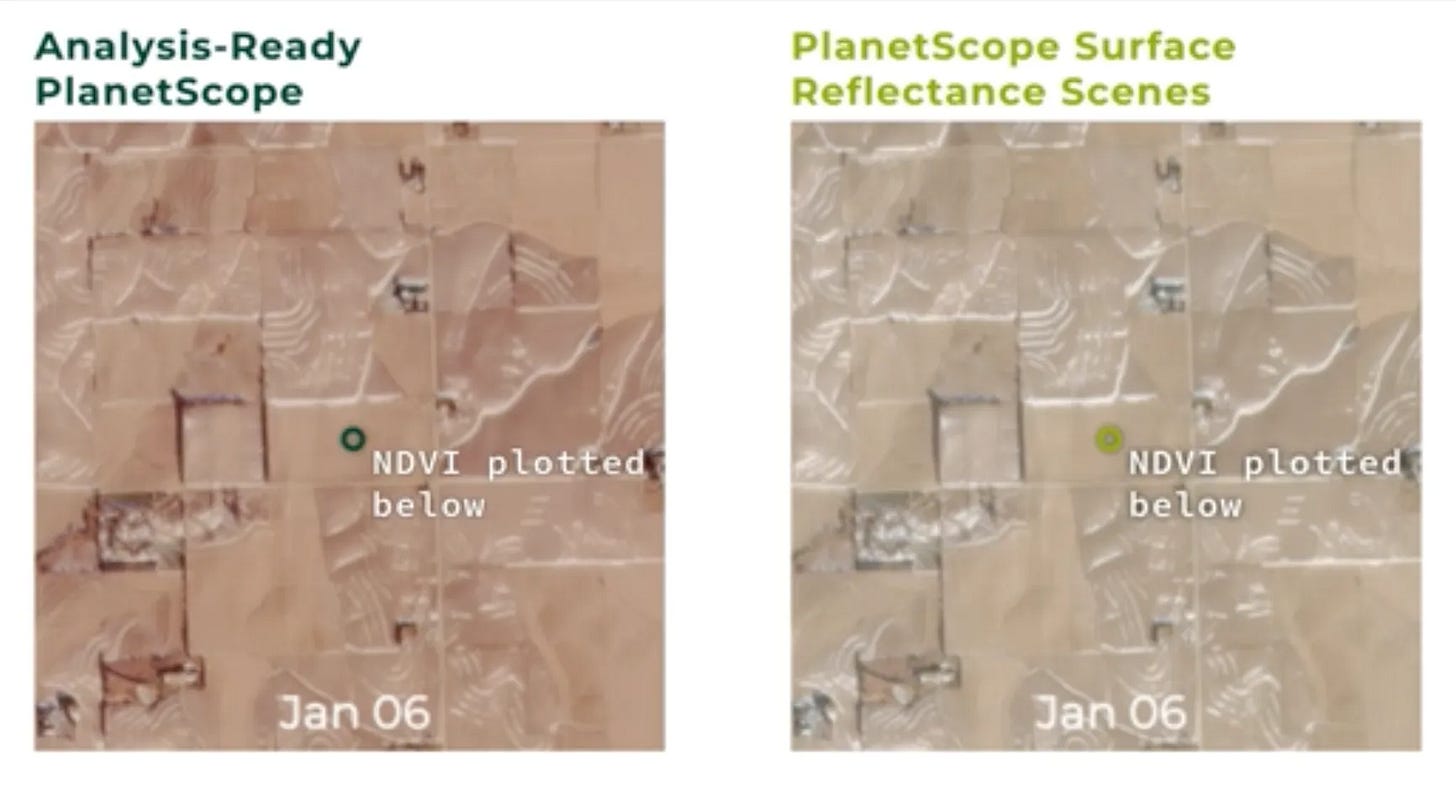
Planet has released an analysis-ready PlanetScope product. This new product provides pre-processed, radiometrically and geometrically standardised imagery, which means we can spend much less time on pre-processing, and much more time on the fun stuff.
A new paper provides a global overview of Landsat and Sentinel-2 data availability from 1982 to 2023. It gives us pixel-level info on the availability of cloud-free, snow-free and shade-free images. You can access the GEE data viewer here.
Northwood Space, the startup led by former child star Bridgit Mendler, has successfully passed its first satellite antenna test. The company aims to improve ground station technology to improve communications with satellites. Their recent test shows the potential of its antenna to support reliable, high-speed data transmission.
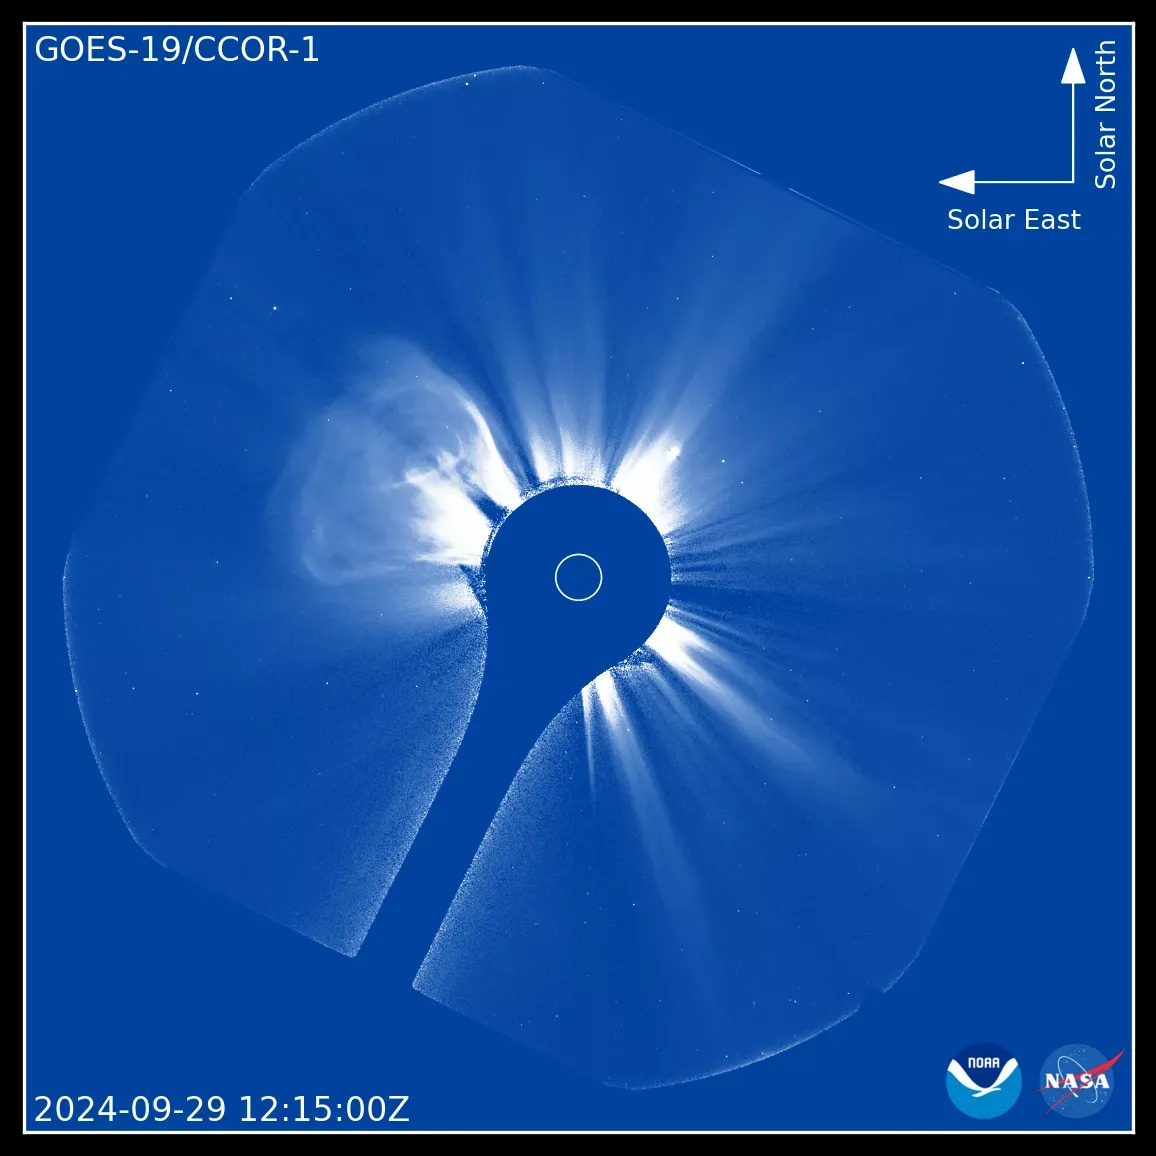
NOAA has shared images from the world’s first operational space-based coronagraph, a tool that helps track solar storms. Despite having corona in its name, this technology actually captures images of the sun's outer atmosphere. This can help us track solar storms that can impact Earth's communication and navigation systems.
Jobs
IOM is looking for a GIS intern to help with Displacement Tracking Matrix (DTM) operations.
Accenture is looking for an Earth Observation Innovation Manager based in the Netherlands who will lead teams for projects related to Earth Observation, Remote Sensing Analytics and Geospatial data analysis.
Arup is looking for a Geospatial Consultant who has a strong GIS background.
The International Institute for Applied Systems Analysis is looking for (i) a Scientist/Model Developer for Earth Observation data and (ii) a Lead Spatial Data Scientist under their Integrated Biosphere Futures (IBF) Research Group.
Uber is looking for a Staff Scientist (Tech Lead Manager) under the Uber Maps team.
Just for fun
The USGS Astrogeology Science Center, with NASA and the Lunar and Planetary Institute maintains a Unified Geologic Map of the Moon. This combines data from Apollo missions and recent satellites to reveal the moon’s entire surface geology (encompassing 4.5 billion years of lunar history).
That’s it for this week.
I’m always keen to hear from you, so please let me know if you have:
new geospatial datasets
newly published papers
geospatial job opportunities
and I’ll do my best to showcase them here.
Yohan






Hi Yohan
This is the link to our job offer, thank you
https://euraxess.ec.europa.eu/jobs/310424
David
Hi Yohan
I have a postdoc proposal in the estimation of poverty using satellite images, could you spread my offer?
Sincerely,
Pr David Mouillot
University of Montpellier
France