


Hey guys, here’s this week’s edition of the Spatial Edge — the GPT-5.6 Sol of geospatial news. We’re not as impressive as some other news outlets, but we’ll get you where you need to go… In any case, the aim is to make you a better geospatial data scientist in less than five minutes a week.
In today’s newsletter:
US Census: Harmonising 30 years of housing data.
Green Growth: Satellites track cleaner economic growth.
Africa’s Power: Mapping future electricity expansion.
Methane Trends: Wetlands mask emission reductions.
Earthquake Damage: Satellite dataset for building damage.
Research you should know about
1. Fixing the fragmented history of US census data
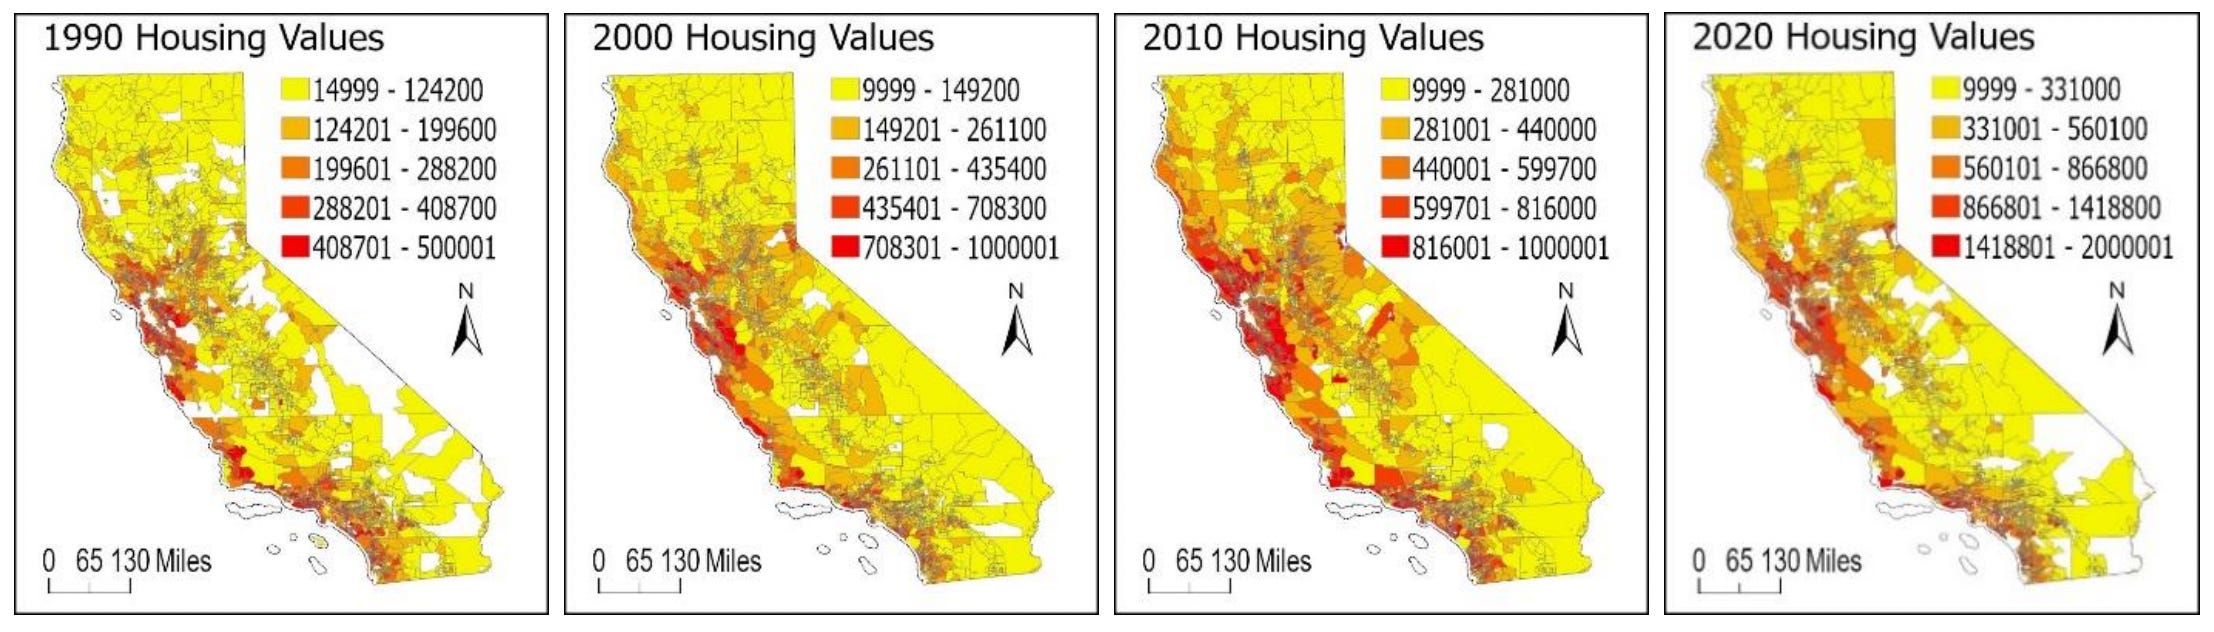
For researchers trying to track long-term socioeconomic trends in the United States, the decennial census can be a pain... Every ten years, the census redrawing process updates the boundaries of ‘block groups’ to reflect population shifts and urban development. While this keeps current data accurate, it basically fractures the historical record, creating geographic gaps and mismatches that make it almost impossible to directly compare modern housing statistics against those from past decades. A new study published in Scientific Data tries to address this exact problem, presenting a geospatial framework that successfully reconstructs lost or misaligned historical housing data and harmonises it to modern census boundaries.
Using California as a primary test case, the researchers pulled block-group level housing data from the 1990, 2000, 2010, and 2020 censuses. To fix the thousands of missing or incompatible data points across the older datasets, they employed Ordinary Kriging (an interpolation method that essentially estimates missing values by analysing the spatial patterns of the surrounding data). Once these historical gaps were filled, the team used zonal statistics to map the repaired historical data onto the most recent 2020 census block group boundaries. The end result is a single, seamless dataset that allows for direct, apples-to-apples comparisons of California’s median housing values across a 30-year span.
This framework resolves a major blind spot in longitudinal research, providing urban planners and policymakers with a reliable, continuous view of historical housing trends without the noise of shifting administrative borders.
2. Tracking green growth from space
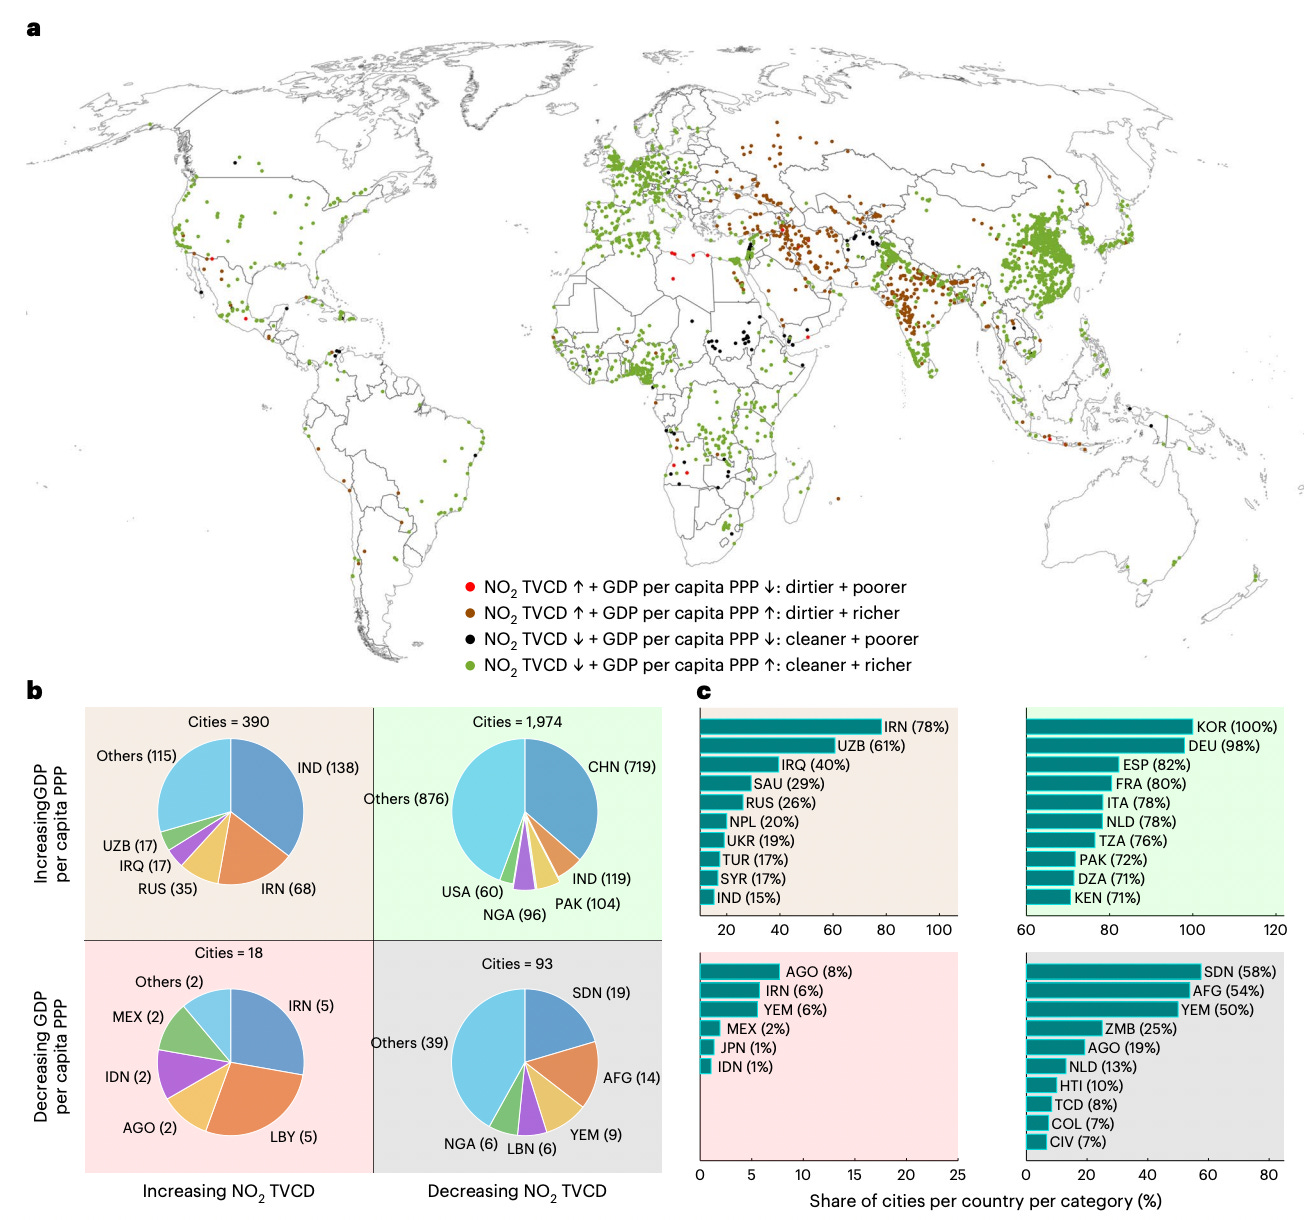
Cities generate over 60% of the world’s GDP and roughly 70% of its greenhouse gas emissions, making them the ultimate battleground for the concept of “green growth”. The problem is that measuring this at a local level has always been a nightmare. Relying on self-reported city emission inventories is messy, and global models are too broad to capture what’s actually happening block by block. A new paper from Nature Cities tackles this by turning to space, using satellites to directly monitor nitrogen dioxide (NO₂) pollution across 5,435 cities worldwide between 2019 and 2024.
The researchers combined this high-resolution satellite pollution data with fine-grained local GDP estimates, and fed both into an advanced statistical model that stripped away the “noise” of local weather patterns. This allowed them to map the “decoupling” of economic growth from fossil fuels. The results show a massive shift: roughly 80% of the 2,475 cities with significant trends successfully achieved relative decoupling, acting as “cleaner + richer” hubs. This trend was heavily concentrated in China, Europe, and North America, where cities managed to grow their economies while driving down their NO₂ footprints, likely through a combination of strict regulations, electrification, and a shift away from heavy industry.
However, the data also highlighted a concerning counter-trend. Around 16% of cities (mostly located in India, Iran, and Russia) fell into the “dirtier + richer” category, locking themselves into a trajectory where economic expansion remains fundamentally tied to fossil-fuel-burning infrastructure and unregulated industrial growth. This new satellite-based framework provides a highly objective, globally consistent tool for policymakers to monitor the real-time effectiveness of green interventions.
3. A look at Africa's power future
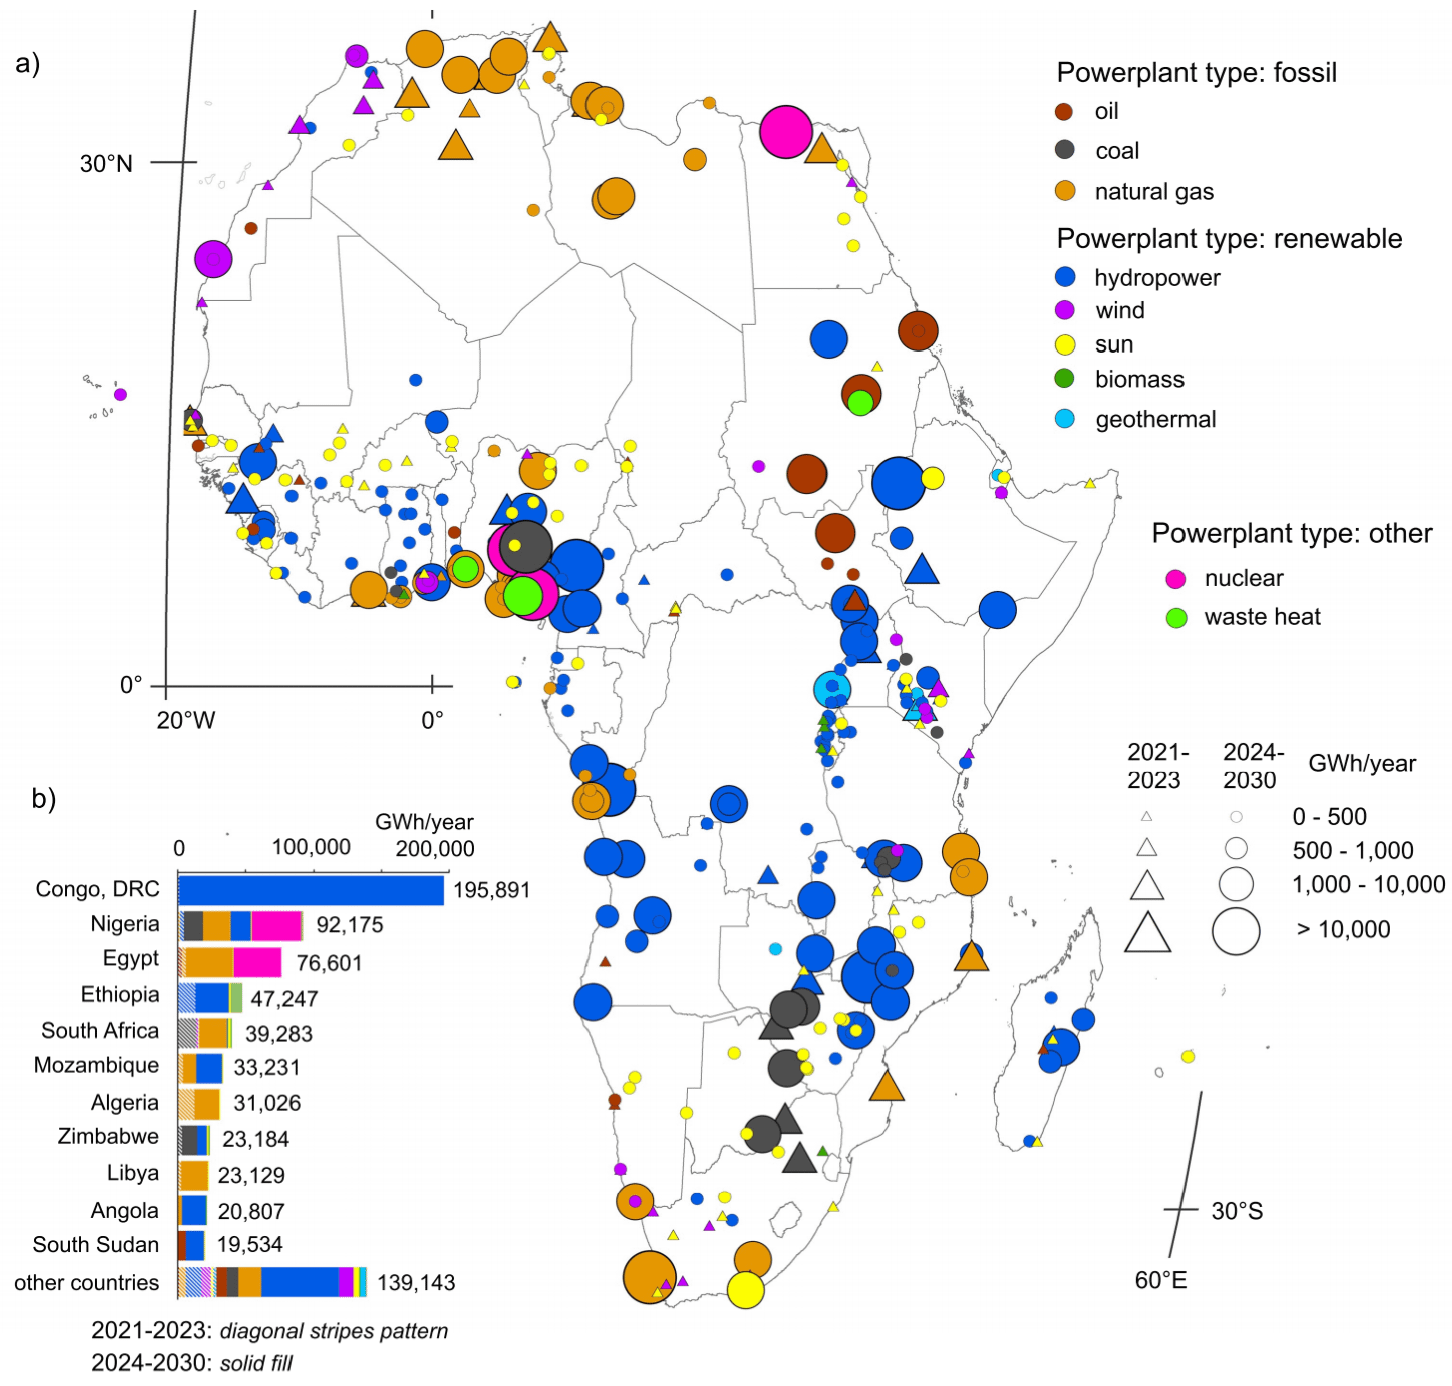
Africa’s electricity sector is growing rapidly to meet massive demand, but keeping track of exactly where and how this power is being generated has been surprisingly difficult. A new study from Nature Communications changes that by introducing a detailed spatial database of African power plants. The researchers spent huge amounts of time data mining open access sources to map out 3,139 operational, under construction, and planned power facilities across the continent. By tracking this expansion up to 2030, they have given us a pretty incredible look at how the continent’s energy landscape is shifting over the next few years.
The numbers point to a massive boom in energy generation. The researchers forecast a 57% increase in electricity production between 2023 and 2030. While fossil fuels are still set to dominate, renewables are picking up serious momentum and are expected to grow from 19% to 34% of the total energy mix. However, this growth comes with some pretty big trade-offs. The surge in new hydropower dams will require a massive amount of water, which is going to put intense pressure on already stressed river basins like the Zambezi, Nile, and Congo. At the same time, the ongoing reliance on coal and natural gas means carbon emissions will continue to climb, even though the continent’s current build rate is actually falling slightly short of its international climate commitments.
4. Natural wetlands drive global methane rebound
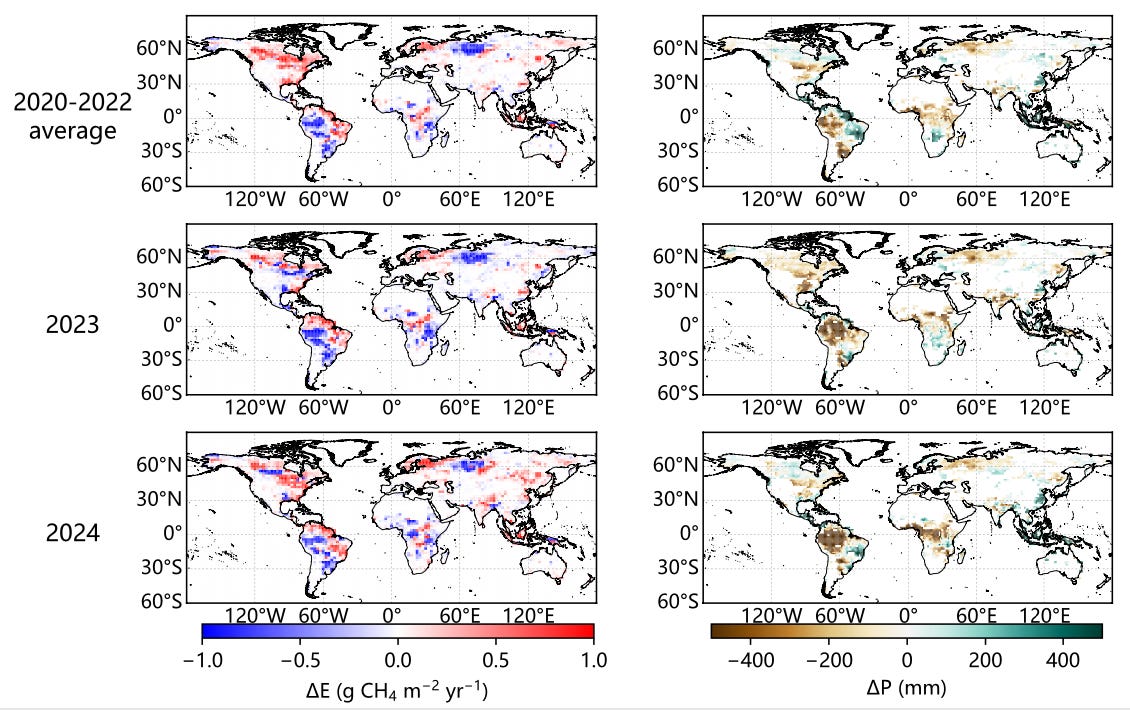
Methane is a greenhouse gas that has been rapidly accumulating in our atmosphere, with growth rates hitting record highs in 2020 and 2021 before slowing down in 2023. While international agreements, like the Global Methane Pledge, aim to slash anthropogenic methane emissions by 30% by 2030, one of the big challenges is untangling human-made emissions from natural ones. A new paper from Nature Communications addresses this by using a blend of satellite data to track global methane budgets from 2019 to 2024, revealing that massive fluctuations in the Earth’s natural wetlands and atmospheric chemistry are actively masking human mitigation efforts.
The team used an advanced atmospheric inversion system called GONGGA, feeding it high-resolution satellite imagery from TROPOMI and GOSAT. They found that during the 2020–2022 La Niña period, the “methane sink” (i.e. the chemical process where hydroxyl radicals naturally scrub methane from the atmosphere) weakened significantly, driving up global methane levels. However, as the El Niño weather pattern took hold in 2023, the sink recovered and massive droughts across South America suppressed wetland emissions, bringing the atmospheric methane growth rate back down to 2019 levels. But in 2024, as La Niña returned and the droughts broke, wetland emissions rebounded violently. This massive natural release of methane effectively offset the recovering atmospheric sink, resulting in a near-baseline growth rate that hid the underlying surge in emissions.
The study highlights a pretty big problem for global climate policy. The natural variability of wetland emissions and the atmospheric sink combined to create an annual swing of 12.6 million tonnes of methane. This is essentially a figure large enough to entirely erase a full year of the emission cuts promised under the Global Methane Pledge. The researchers stress that as climate change makes weather patterns like La Niña more frequent, these natural methane releases will likely intensify. This means that tracking progress on global emission targets will require sophisticated satellite monitoring systems that can explicitly separate natural wetland surges from actual human emission reductions.
Geospatial Datasets
1. Paleoclimate reconstruction dataset
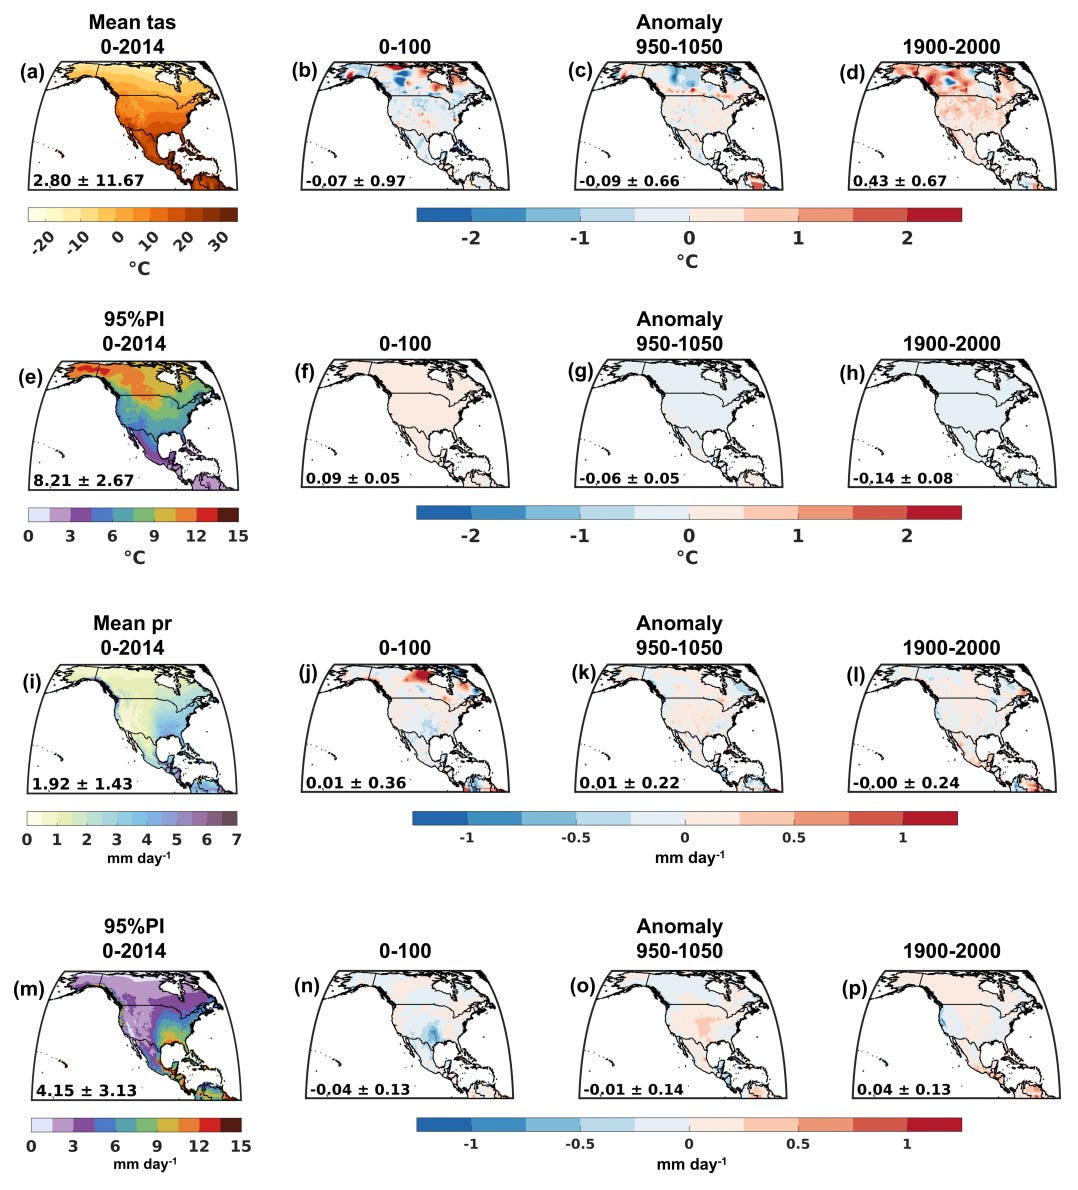
The DPastCliM-NA dataset provides a bias-corrected, high-resolution monthly reconstruction of temperature and precipitation for North America over the past 2,000 years, featuring explicit uncertainty estimates. You can access the data here and the code here.
2. Earthquake building damage dataset
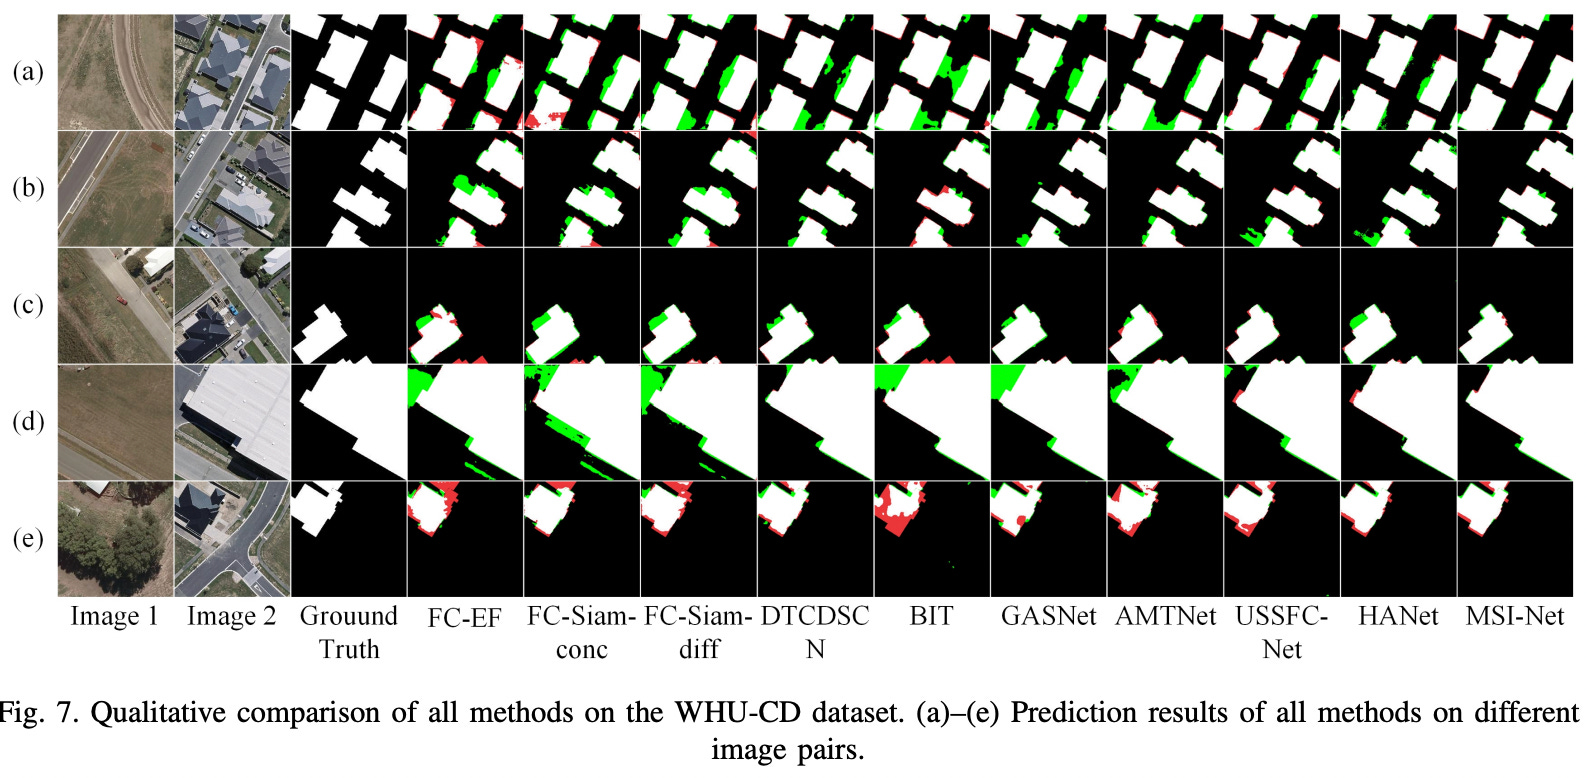
The Turkey Earthquake change detection dataset (TUE-CD) comprises 1,656 pairs of bi-temporal satellite images captured by the WorldView-2 satellite to assess building damage after the February 2023 earthquake. You can access TUE-CD here and MSI-Net here.
3. Vectorised building footprint dataset
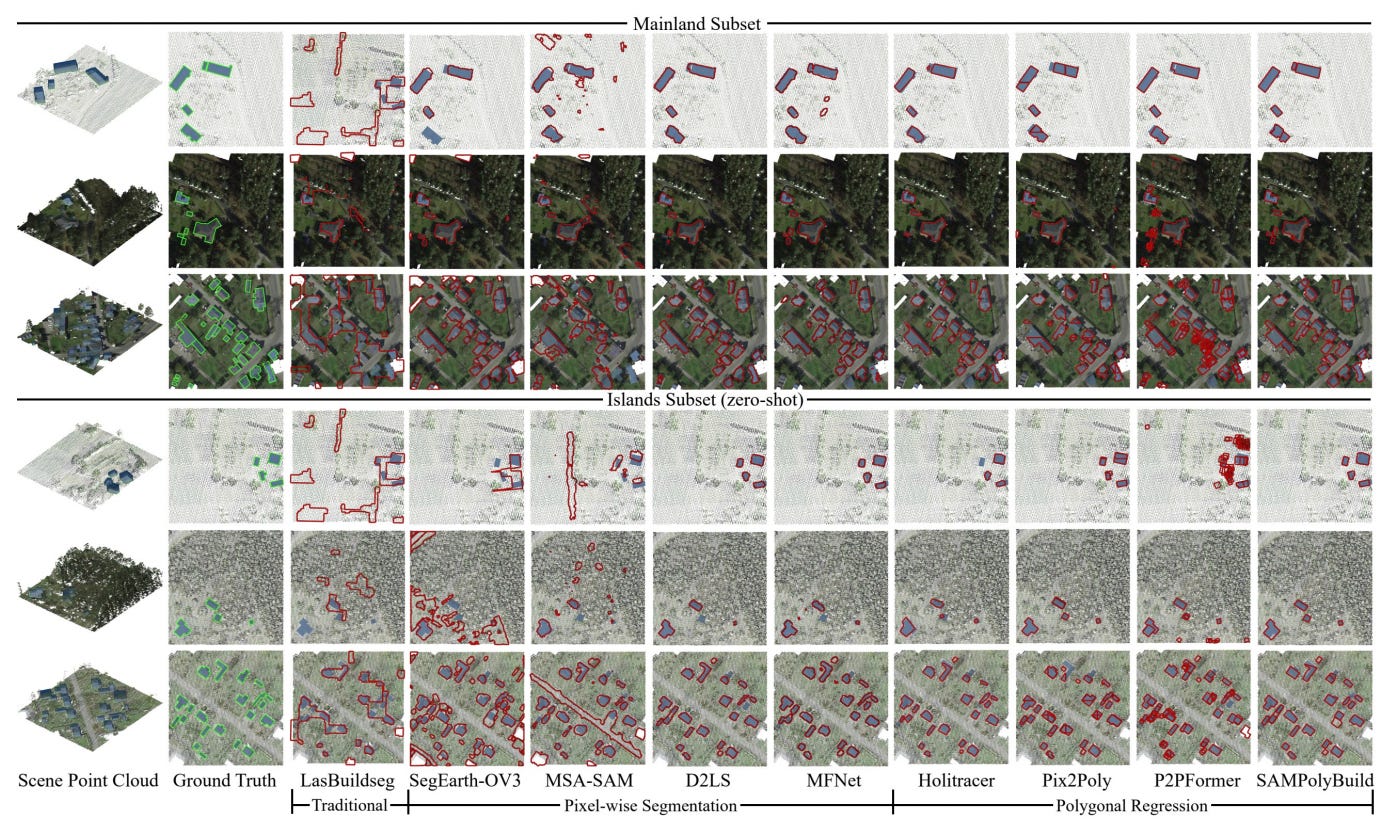
The PCFootprint dataset provides the first large-scale public baseline for extracting vectorised building footprints from airborne laser scanning point clouds. You can access the data here.
4. Disaster risk knowledge graph dataset
An AI-powered data pipeline transforms millions of global news articles from 2014 to 2024 into structured disaster risk knowledge graphs. You can access the data here, the code here, and the interactive dashboard here.
Other useful bits
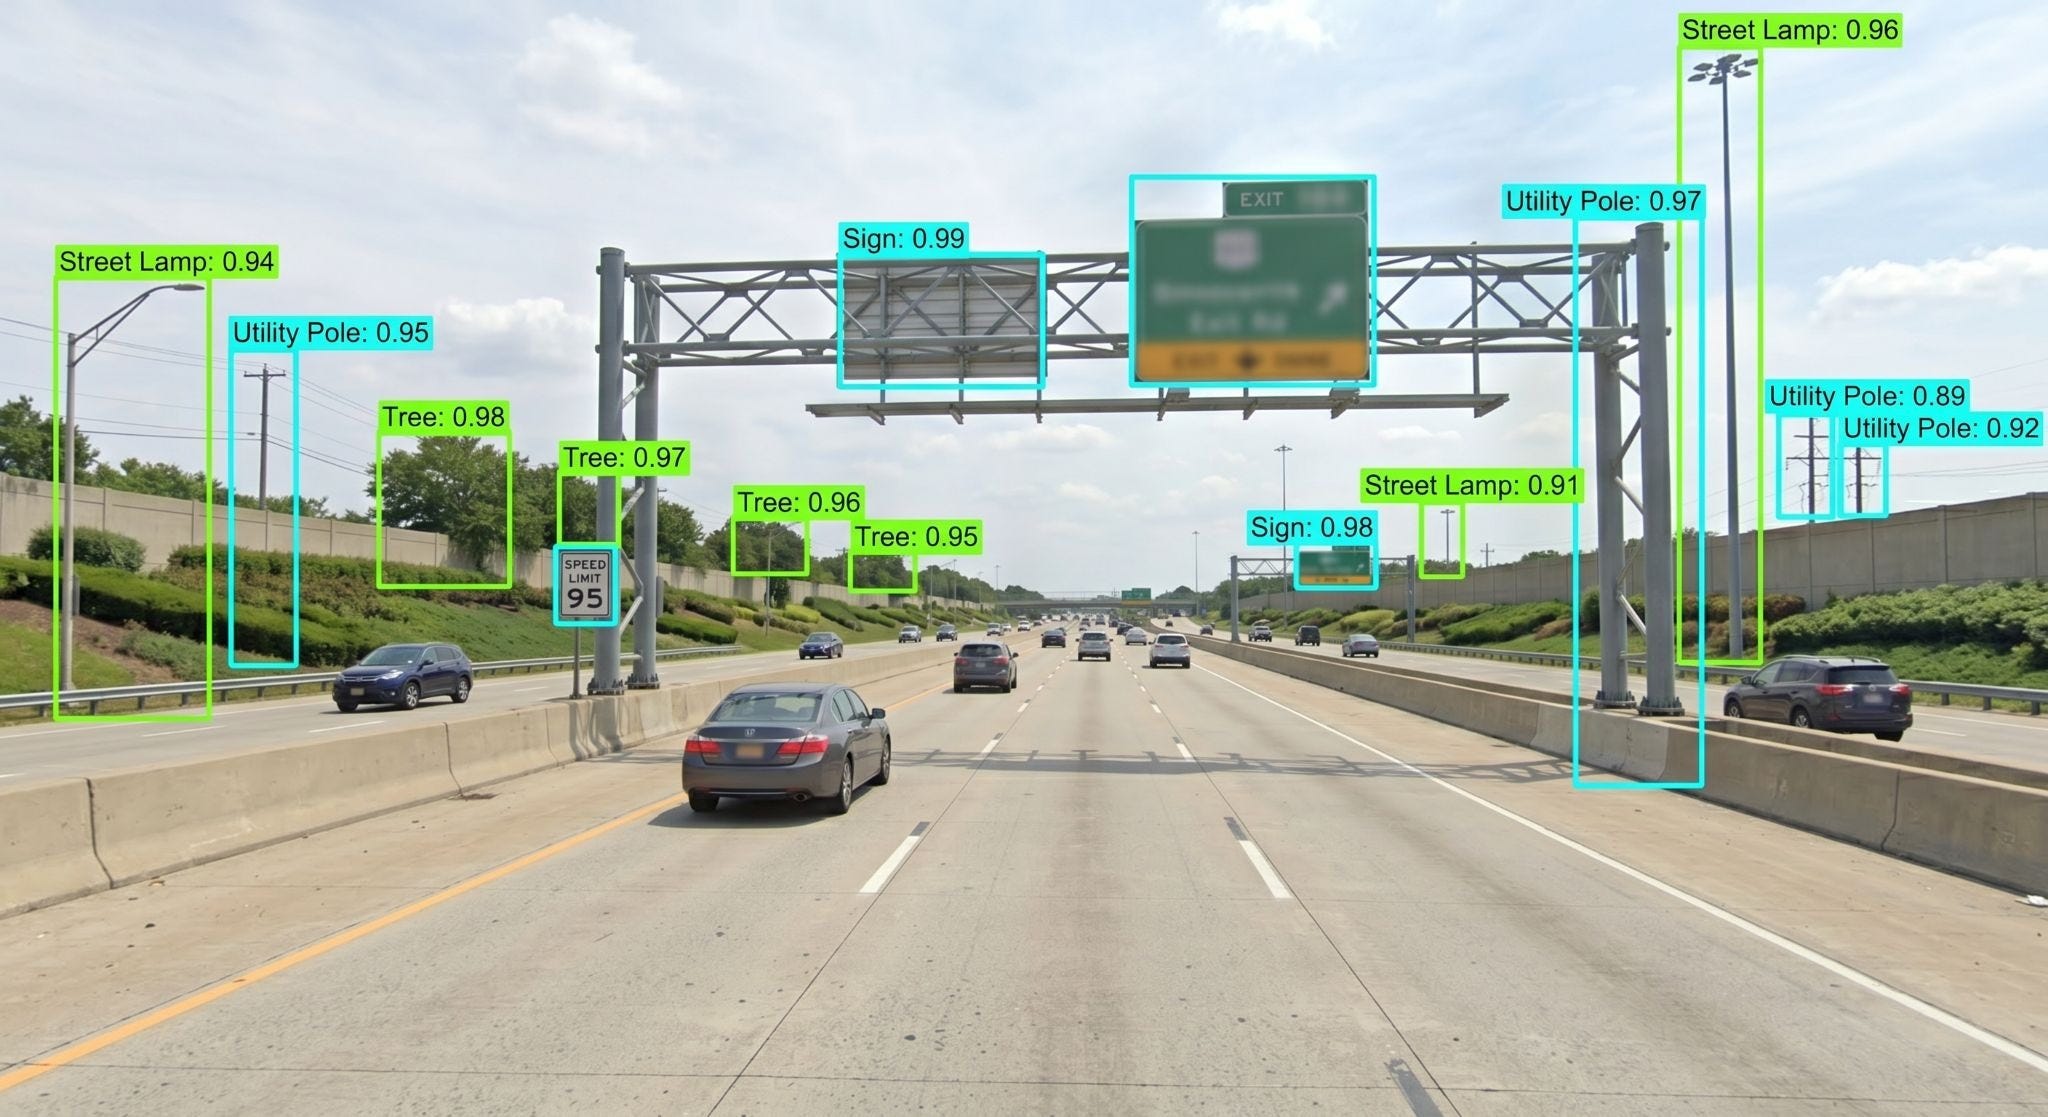
Google’s Gemini 3.1 model allows organisations to automate the transformation of unstructured street-level imagery into structured spatial databases through multimodal visual reasoning. By using bounding box detection and integrated code execution, this approach removes the need for training bespoke computer vision models and streamlines complex infrastructure analysis.
Fine-scale vegetation mapping in West Kalimantan reveals that high-res data is critical for identifying fragmented forests and community agroforestry systems often obscured by conventional land-use planning. This mapping project provides local communities and policymakers with an accurate evidence base to protect biodiversity and prevent illegal plantation expansion into protected peatlands.
Innovators are tackling the energy supply bottleneck created by AI power demands by developing space-based solar technologies that beam continuous energy directly to terrestrial grids. Rather than necessitating new infrastructure, this method uses near-infrared light to augment the output of existing solar farms, significantly increasing their operational value and reliability.
Jobs
Vantor is looking for a (1) Geospatial Data Scientist and a (2) Senior Geospatial Data Engineer based in McLean.
The University of Illinois is looking for a Research Specialist (GIS Analyst) under their Department of Paediatrics based in Chicago.
Planet is looking for a Pre-Sales Solutions Architect based in Latin America (preferably Colombia).
ESA is accepting applications for their mid-year internship opportunities under:
Just for Fun
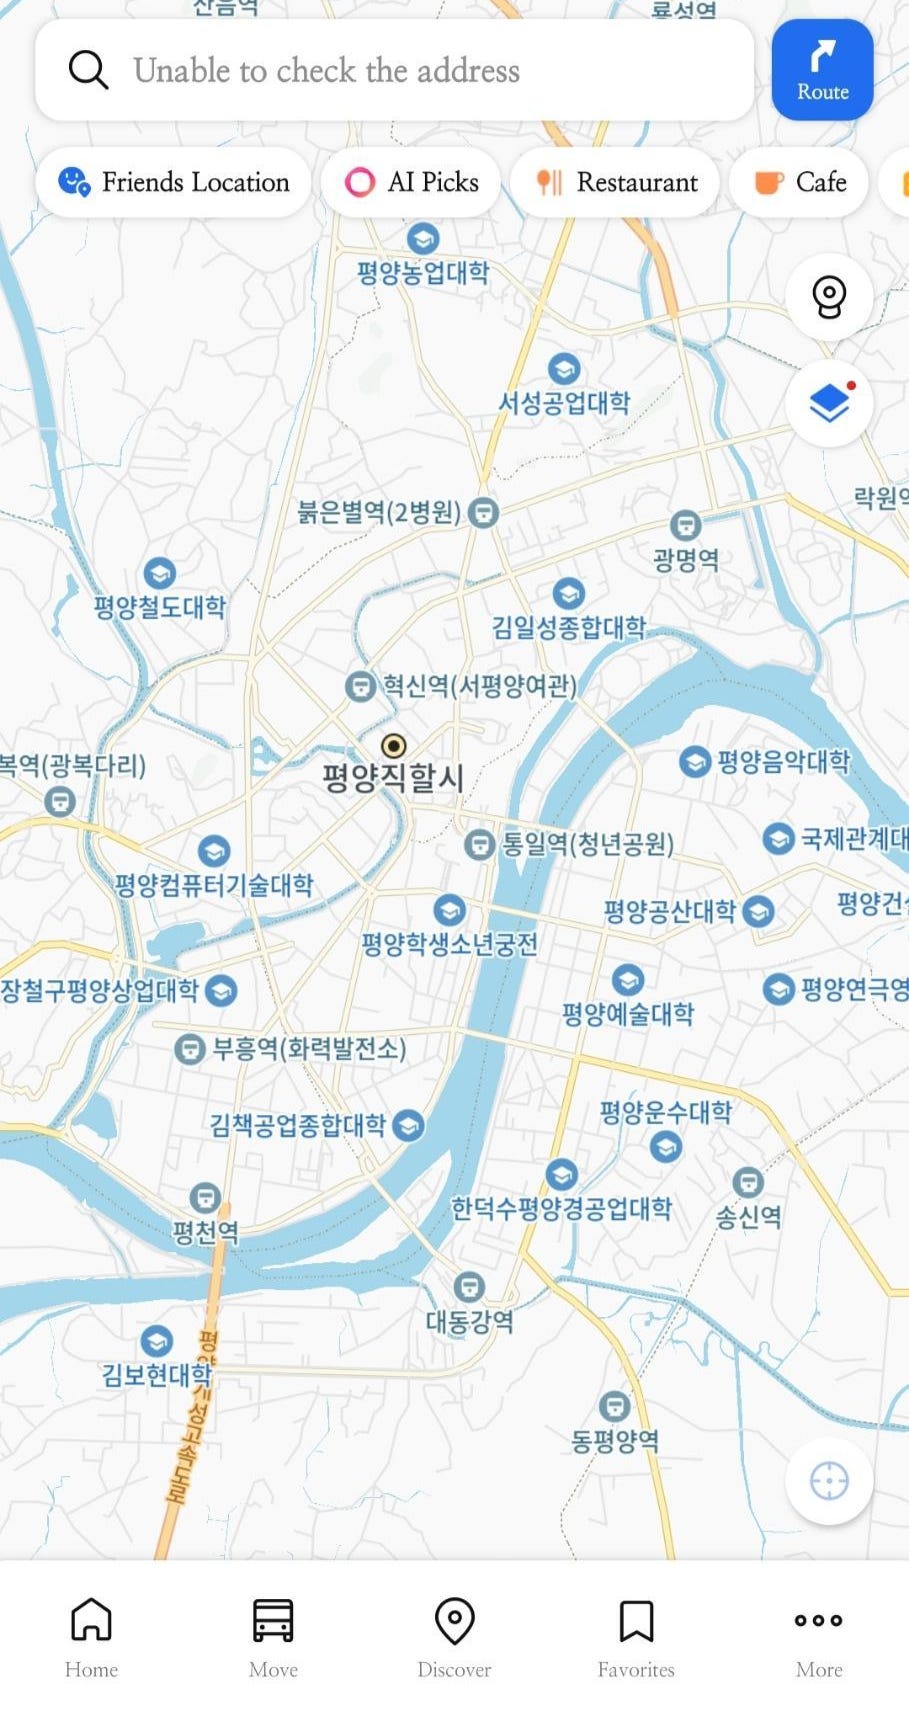
South Korean map service Kakao Map has gone viral for providing unexpectedly detailed geographical data on North Korea, including labels for mountains, universities, and railway stops that remain largely obscured on competing platforms.
That’s it for this week.
I’m always keen to hear from you, so please let me know if you have:
new geospatial datasets
newly published papers
geospatial job opportunities
and I’ll do my best to showcase them here.
Yohan