

Mapping the limits of agricultural adaptation
PLUS: How AI is speeding up map digitisation, and new data processing methods from NASA

Hey guys, here’s this week’s edition of the Spatial Edge — a newsletter that’s kind of like GPT-5: there’s not too much hype, Elon hates it, but people still spend time opening it. In any case, the aim is to make you a better geospatial data scientist in less than 5 minutes a week (start your timers)...
In today’s newsletter:
Climate Adaptation: Farmers offset 23% of warming losses.
Map Digitisation: AI speeds up geologic map processing.
Cloud Analysis: NASA method boosts speed by 10,000×.
City Vegetation: Light pollution extends plant growing seasons.
Weather Dataset: 49k labels for extreme weather tracking.
Research you should know about
1. How much can farmers adapt to climate change?

A new Nature study examines how global agriculture is likely to respond to warming, using evidence from how farmers have already adapted in practice (rather than relying only on model assumptions). The authors analysed crop yields for six staples (maize, rice, wheat, soybean, cassava and sorghum) across 12,658 regions that together produce two-thirds of global calories. By combining these data with local climate, income, and irrigation information, they estimated how much real-world adaptations such as switching crop varieties, altering planting dates or adjusting fertiliser use have reduced climate damages so far, and how this might play out in the future.
They find that every 1 °C of global warming reduces annual calorie production by about 5.5 × 10¹⁴ kcal, or roughly 4.4% of recommended daily intake per person, even after accounting for observed adaptation. Under a moderate-emissions scenario, adaptation and rising incomes offset about 23% of global losses by 2050 and 34% by 2100, although large residual damages remain for most crops, especially maize, wheat, cassava and soybean. Rice is an exception, with adaptation erasing much of the projected loss.
The bottom line is that global populations have already adapted to the climate in many ways, particularly in low-income and hot regions. The main exception is the poorest communities, which rely heavily on cassava and face higher potential losses. In contrast, the world’s major breadbaskets, which have moderate climates, show much less adaptation at present. Because these regions produce such a large share of the world’s food, their lower adaptation levels drive much of the projected global calorie loss and related food security risks.
The data is available here.
2. How AI is speeding up map digitisation

Geologic maps contain a bunch of important information on terrain, minerals, and fault lines, but converting them into digital, analysis-ready formats has historically been pretty slow and pretty labour-intensive. DIGMAPPER tries to address this by automatically extracting polygons (such as rock units), lines (like fault lines), and points (such as mining sites) from scanned maps, and then georeferencing them.
For polygons, the team built a model called TOPAZ (not sure what’s with all the capitalisations…), which matches colours, markings, and text labels from the legend to the correct areas on the map, even when scanning artefacts or overlapping symbols make things messy. For lines, they developed LDTR, which reconstructs fault lines by combining local image cues with long-range spatial connections, reducing breaks and misalignments. A separate module detects point symbols, boosted by synthetic training data to improve accuracy where labelled samples are scarce.
DIGMAPPER uses both text-based and visual matching to georeference maps. The text-based method looks for coordinates or place names in titles and corners, linking them to known basemaps. The visual method compares features like rivers or roads between the geologic map and reference maps, refining the location when text-based results are uncertain. In tests, the system achieved high accuracy on clean, well-scanned maps, with the visual approach improving results for harder cases. DIGMAPPER works across maps of different styles and quality, from modern digital-born versions to older, degraded scans.
The whole system is built in modular Docker containers, orchestrated by a workflow manager that runs tasks in parallel. This means it can scale to large collections and adapt quickly to new map types without major re-engineering. On a single GPU server, DIGMAPPER can process a map in under 25 minutes, compared to several hours for manual digitisation. The US Geological Survey is already using it to identify potential sites for critical minerals like nickel, lithium, and rare earths. The next step is to extend it to other map types and make it less reliant on large training datasets by using few-shot learning techniques.
2. How NASA sped up cloud-based geospatial analysis by 10,000×
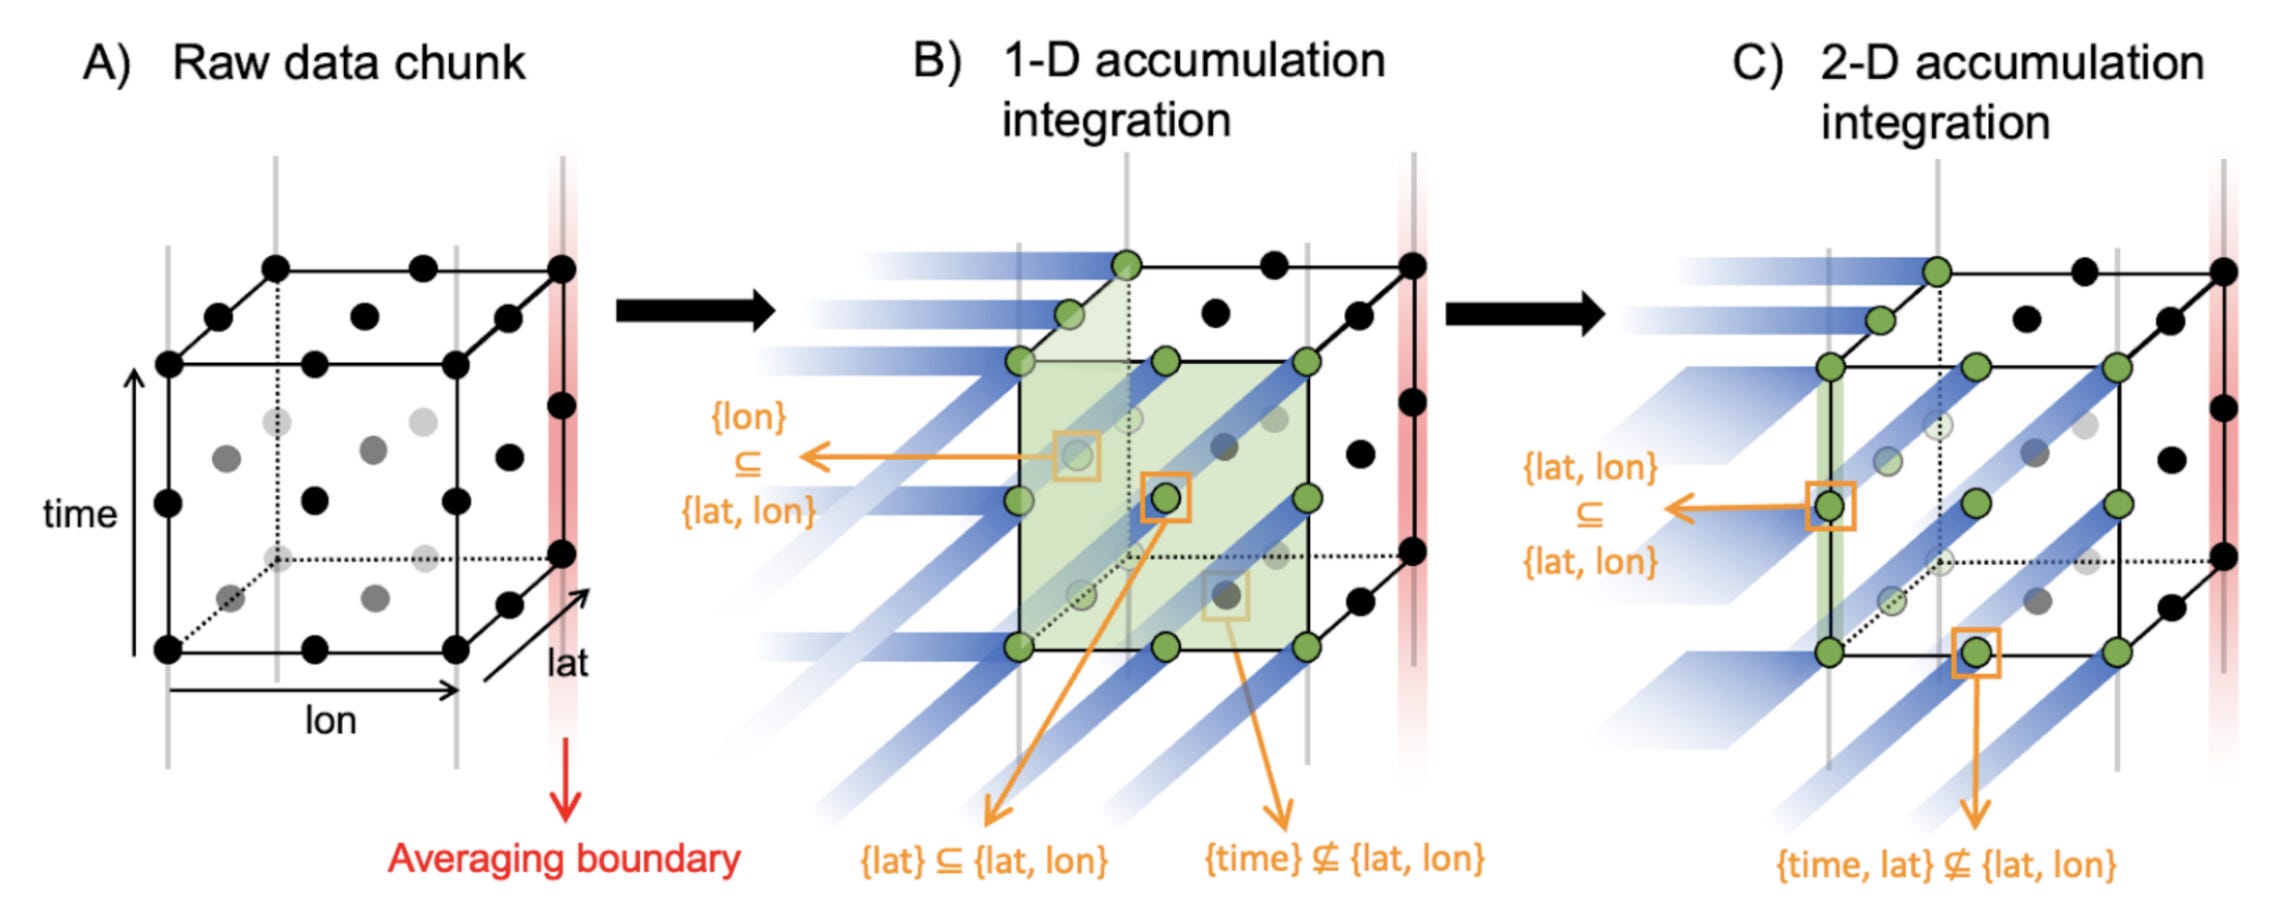
So imagine you have a giant spreadsheet with billions of numbers. For example, rainfall readings for every half-hour at every spot on Earth for 20 years. If you want to know the average rainfall for a region and time period, the usual method involves reading every number in that range, adding them up, and dividing by how many there are. That is sort of like flipping through an entire book every time you need one fact. It’s insanely slow and inefficient.
A team from NASA’s Goddard Centre created a shortcut by pre-computing cumulative sums, or running totals, for certain dimensions such as time or location. They store these in a much smaller side file. If you’ve ever kept a running total in a column of a spreadsheet so you do not have to re-add everything from scratch, it’s pretty much the same idea. With these pre-computed sums, you can get the average for any large block of data by looking at only a few boundary values instead of the entire block.
To keep it efficient, they store these sums only at the edges of data chunks. These are basically small blocks that the dataset is already split into. They also do this only for dimensions that matter for the analysis. This adds only about 5 per cent to the storage size. That small extra file means calculations that once took minutes can now finish in seconds, even on small and inexpensive cloud servers. In their rainfall data tests, the method was up to 10,000 times faster than reading all the raw number,s and it produced the same results. They have also proposed a standard format so anyone using Zarr, a common cloud-optimised storage system, can adopt it easily.
You can check out the code and specs here.
4. Artificial light is changing plant cycles in cities

Plants in cities are staying green for longer each year, and it’s not just because they are warmer than the surrounding countryside. A new study in Nature Cities analysed satellite data from 428 Northern Hemisphere cities (2014–2020) and found that night-time lighting has an even bigger effect than heat. Light levels rose sharply towards city centres, while temperatures increased more gradually. Both were linked to greenery appearing earlier in the year and fading later, but light had the stronger influence, especially in keeping plants green well into autumn. On average, city vegetation turned green 6.4 days earlier and stayed that way 7.1 days longer than in nearby rural areas.
Using VIIRS nighttime light data, air temperature datasets, and MODIS phenology products, the researchers tracked changes along ten rural-to-urban “buffers” for each city. The clearest signal was in autumn: in nearly half the cities, artificial light was the main factor keeping vegetation green longer, while the role of temperature was weaker or inconsistent. This light effect was found across climate zones, from colder northern cities to temperate regions. In contrast, the earlier greening seen in spring was more often linked to temperature in cooler climates, though light still played a substantial role in many areas.
I guess the bottom line here is that night-time lighting disrupts plants’ natural sense of seasonal timing, keeping photosynthesis going long after it would normally wind down. This can increase carbon uptake and cooling, but also raises frost damage risks, alters pollination schedules, and extends allergy seasons. With LED lighting driving rapid increases in city brightness and emitting more blue light, which plants are especially sensitive to, the authors reckon there could be even stronger impacts to come.
Geospatial Datasets
1. 100-m population estimation dataset

ASPECT is a high-resolution, age-stratified gridded population dataset for mainland China, based on the 2020 Census at the township level. It provides population estimates across four age groups (0–14, 15–59, 60–64, and ≥65) at 100 m resolution. You can access the data here and the code here.
2. Phone-data derived temporary migration dataset

A new open-access dataset offers highly granular estimates of temporary migration in Senegal from 2013 to 2015, using mobile phone metadata from over 12 million users. It captures half-monthly migration flows and stocks across 151 locations, focusing on movements lasting 20–180 days. You can access the code here.
3. Crop-specific maps

AIDA provides 1 km resolution crop-specific maps of rainfed and irrigated areas and associated green and blue water demands across Italy for 2013–2023. You can access the data here and the code here.
4. Deep learning dataset for extreme weather

ClimateNetLarge is a massive, hand-labelled dataset for training deep learning models to detect and track extreme weather events. It includes over 49,000 annotated timesteps for atmospheric rivers, tropical cyclones, and atmospheric blocking events based on ERA5 reanalysis data from 1980 to 2022. You can access the data here and the code here.
Other useful bits
Now 2.2 million schools worldwide are searchable through Geospatial AI Agents, thanks to the integration of UNICEF’s Giga Maps dataset. Users can instantly find, analyse, and download school locations: from “schools near me” to those in disaster-prone areas. And again, no GIS expertise needed.
Using machine learning on satellite imagery, researchers identified nearly 350 trash sites across Gaza, covering about 1 km² (which is likely an undercount). Around 60% of this waste lies near displaced people in tents, with total volumes estimated at 600,000 metric tons.
Jobs
My team (the Data Division) at ADB is looking for an Associate Statistics Officer for Data Science based in Manila.
UNDP is looking for an Energy Data Science Analyst based in New York to support its Sustainable Energy Hub.
UNOPS is looking for a remote Geospatial Data Analyst who will work for the East and Southern Africa Multi Country Office.
UNHCR is looking for an Information Management Officer based in Geneva.
The Nature Conservancy is looking for a Program Lead for Landscape Restoration based in New Delhi.
WHO is looking for a GIS Specialist for Geospatial Database Development based in Istanbul.
Just for Fun

In this 2019 image by Francisco Sojuel, clouds drifting across the Moon create the illusion of Saturn’s rings. It was taken above Guatemala’s Pacaya volcano just before sunrise.
That’s it for this week.
I’m always keen to hear from you, so please let me know if you have:
new geospatial datasets
newly published papers
geospatial job opportunities
and I’ll do my best to showcase them here.
Yohan
I think for the Nature study on agriculture, they are calculating the reduction in productivity assuming it would grow at a certain rate, rather than a reduction from existing levels.
Not so much reducing annual calorie production, but more like increased calorie production at a slower rate.
"Notably, innovation has contributed positively to average yield trends in many regions, which will probably continue into the future in some form. Our projected yield impacts should therefore be interpreted as deviations from a future trend in average yields that is driven by other factors, including innovation."