


Hey guys, here’s this week’s edition of the Spatial Edge, a place where the errors are always spatially autocorrelated. Anyway, the aim as usual is to make you a better geospatial data scientist in less than five minutes a week.
In today’s newsletter:
Cyclone Forecasts: Google’s AI buys forecasters an extra day.
Mobile Networks: Climate hazards threaten millions of base stations.
Foundation Models: Nearly a third ship code with no weights.
Image Matching: One model aligns imagery across six continents.
Riverfronts: A fifth of the world’s riverfronts are modified.
Research you should know about
1. Google’s AI can now forecast cyclones a day earlier
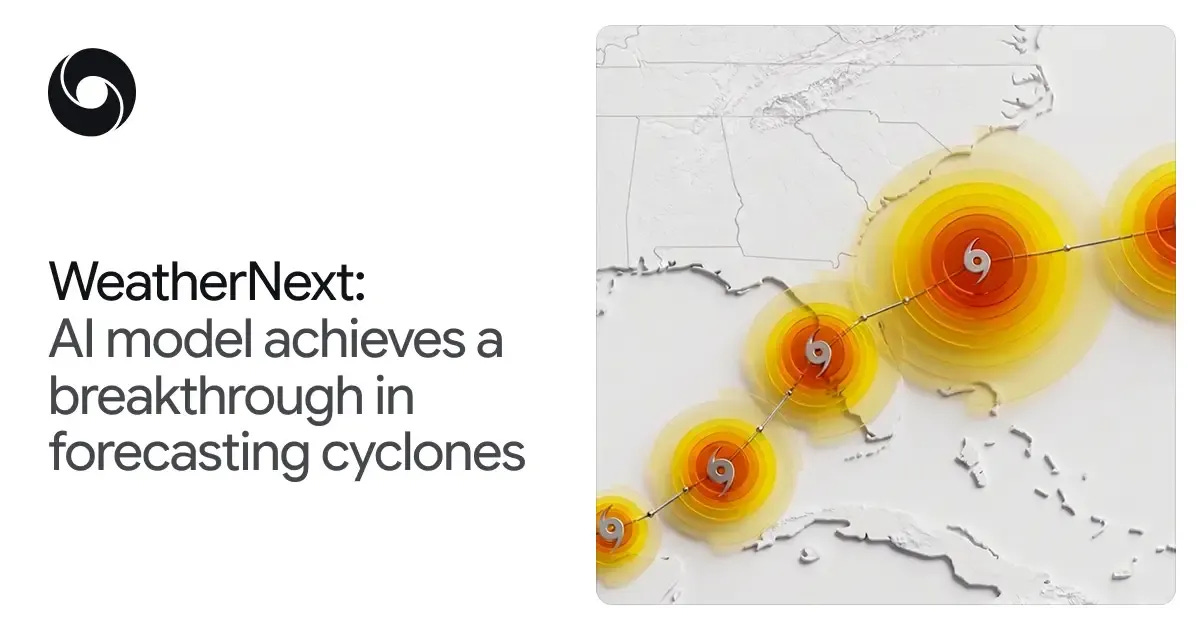
A new study published in Nature introduces WeatherNext Cyclones, an AI model that produces ensemble forecasts for the track, intensity and size of tropical cyclones anywhere in the world. Cyclones are among the most dangerous and costly weather events there are, and forecasting them well has stayed stubbornly hard. The conventional route is regional physics models run at very high resolution, which is expensive and still leaves intensity forecasts shakier than track forecasts.
The model was trained on a combination of global analysis data and a global database of historical cyclones, and it generates large ensembles of possible global weather and cyclone scenarios out to 15 days. Two things stand out about how it’s built. It runs on inputs that are orders of magnitude coarser than regional models, which suggests high resolution isn’t a strict prerequisite for state of the art intensity forecasting, and it scales to 1,000-member ensembles rather than the conventional 50, which captures rare events much better.
Evaluated on cyclones from 2023 to 2025, the track, intensity and wind radii predictions gave an average of a day or more of extra lead time over leading operational models, which the authors compare to a decade of conventional operational progress. Adding it to a weighted-average consensus ensemble improves that ensemble’s skill too. Google DeepMind says the US National Hurricane Center used the model during the 2025 season on Hurricane Melissa’s rapid intensification and landfall in Jamaica, and the code and weights are now on GitHub under Apache 2.0.
2. What climate change will do to mobile phone networks
A new study in Nature Communications puts numbers on how exposed the world’s mobile networks are to floods and cyclones. Climate risk assessments usually cover roads, power grids and buildings. Telecommunications gets left out, which is odd given that mobile networks are the thing everyone depends on during a disaster.
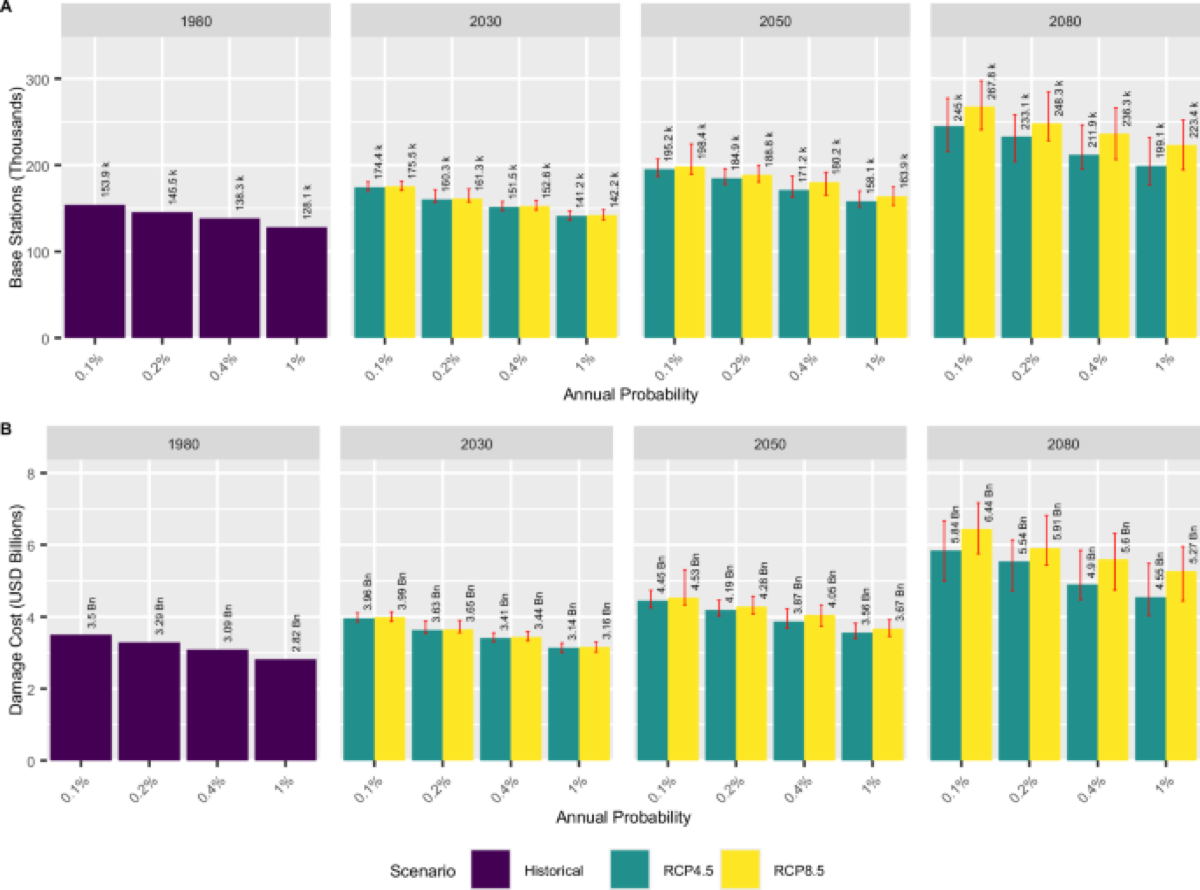
The researchers built a global, event-based geospatial assessment of roughly 17 million mobile base stations, combining crowdsourced open asset data with global climate hazard models. They ran it under historical conditions and two future scenarios, RCP4.5 and RCP8.5, and estimated both exposure and direct damage across a range of extreme-event return periods.
Under RCP8.5 in 2050, a tropical cyclone event with a 0.1% annual probability affects an estimated 3.7 million base stations and causes USD 4.22 billion in direct damage. Under RCP8.5 in 2080, the equivalent coastal flooding event affects 268,000 stations and causes USD 6.44 billion in damage. Riverine flooding touches more assets globally, around 2.8 million, though damages there stay broadly stable at USD 46 to 47 billion. The practical takeaway is that telecoms assets belong in climate risk assessments as standard, and there’s now open crowdsourced data good enough to do it.
3. Most geospatial foundation models are hard to actually use
A new study from the University of Cambridge asks a question the geospatial foundation model literature mostly skips, which is whether anyone outside the lab can actually run these things. Most evaluations are model-centric and stop at architecture and benchmark accuracy. That tells you nothing about whether an ecologist can pick a model up and get a result out of it.
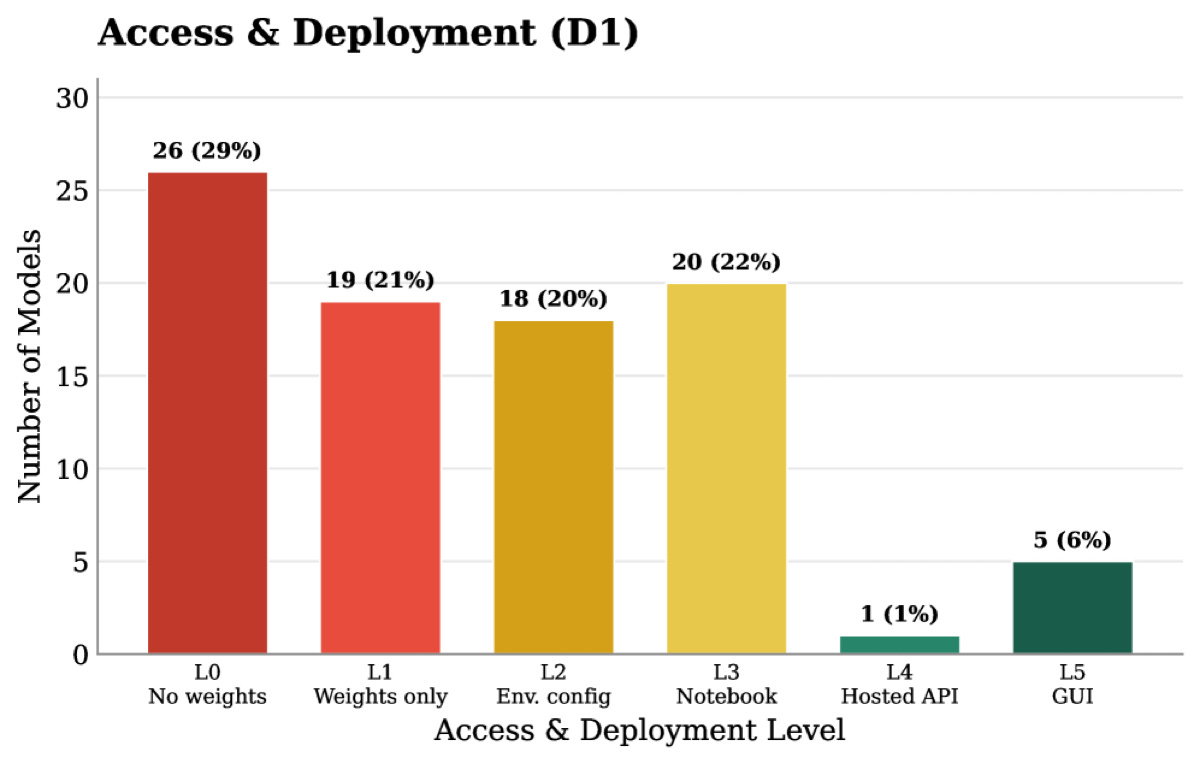
The team ran a pilot survey with ecology and conservation scientists, turned what they heard into a seven-dimension usability rubric grounded in HCI theory, then had two raters score 89 GeoFMs against it. The dimensions are access and deployment, interaction and customisation, trust and transparency, community and support, scientific permanence, multilingual support, and offline usability.
Nearly 29% of the 89 models scored Level 0 on access, meaning no public weights at all, and another 21% ship weights with minimal guidance, so over half (50.6%) require you to either pre-train from scratch or build a complex environment on your own. Only six models (6.7%) offer a hosted API or a graphical interface: MOSAIKS, Google’s AlphaEarth, Prithvi, AIEarth, SatLas and Tessera. Trust is the bigger gap. Of the accessible models, 96.8% provide replicable benchmarks, exactly one has built-in explainability, and none document uncertainty quantification, which is the feature the surveyed experts ranked highest. It is getting better though: 54% of 2025 releases reached Level 3 or above, against 27% in 2024.
4. Matching satellite images from anywhere on Earth
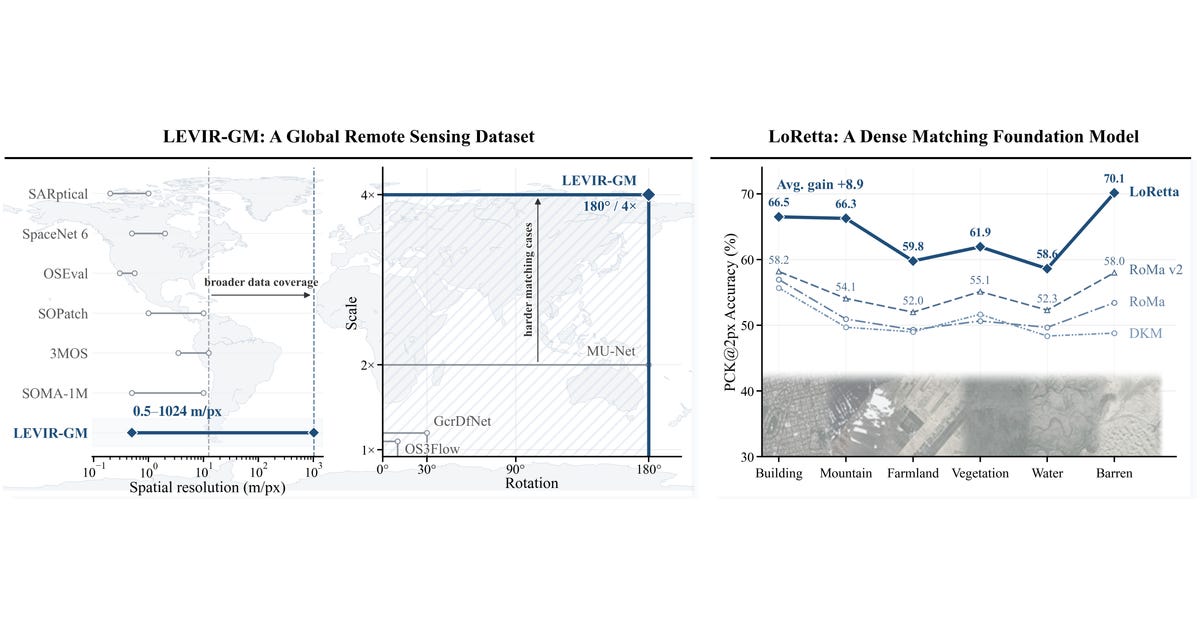
A new study from Beihang University takes on dense image matching at global scale, where two images of the same place can differ in acquisition time, season, viewpoint, resolution and land cover. Dense matching establishes pixel-wise correspondences and underpins a lot of photogrammetry and change work. The trouble is that large geometric offsets, partial overlap and regions that genuinely can’t be matched make direct dense prediction both unreliable and slow.
The fix is to reformulate matching as localisation-and-registration: first find the matchable overlap and its affine geometry, then refine dense residuals inside the aligned frame. The resulting model is LoRetta. They also released LEVIR-GM, a global multi-temporal optical matching benchmark with matchability labels built in: 103,000 aligned pairs, 827,000 after augmentation, spanning six continents, five years and resolutions from 0.5 m to 1,024 m.
LoRetta scores 83.3% AUC on LEVIR-GM, 1.6 points above the RoMa v2 baseline, with percentage of correct keypoints up 6.5 points at 1 pixel and 8.2 points at 2 pixels, and it runs 47.8% faster. They also demo it on cross-domain geolocalisation, matching astronaut photography and UAV imagery back to satellite scenes. The code is on GitHub and the weights are on Hugging Face.
5. A fifth of the world’s riverfronts have been reshaped by people
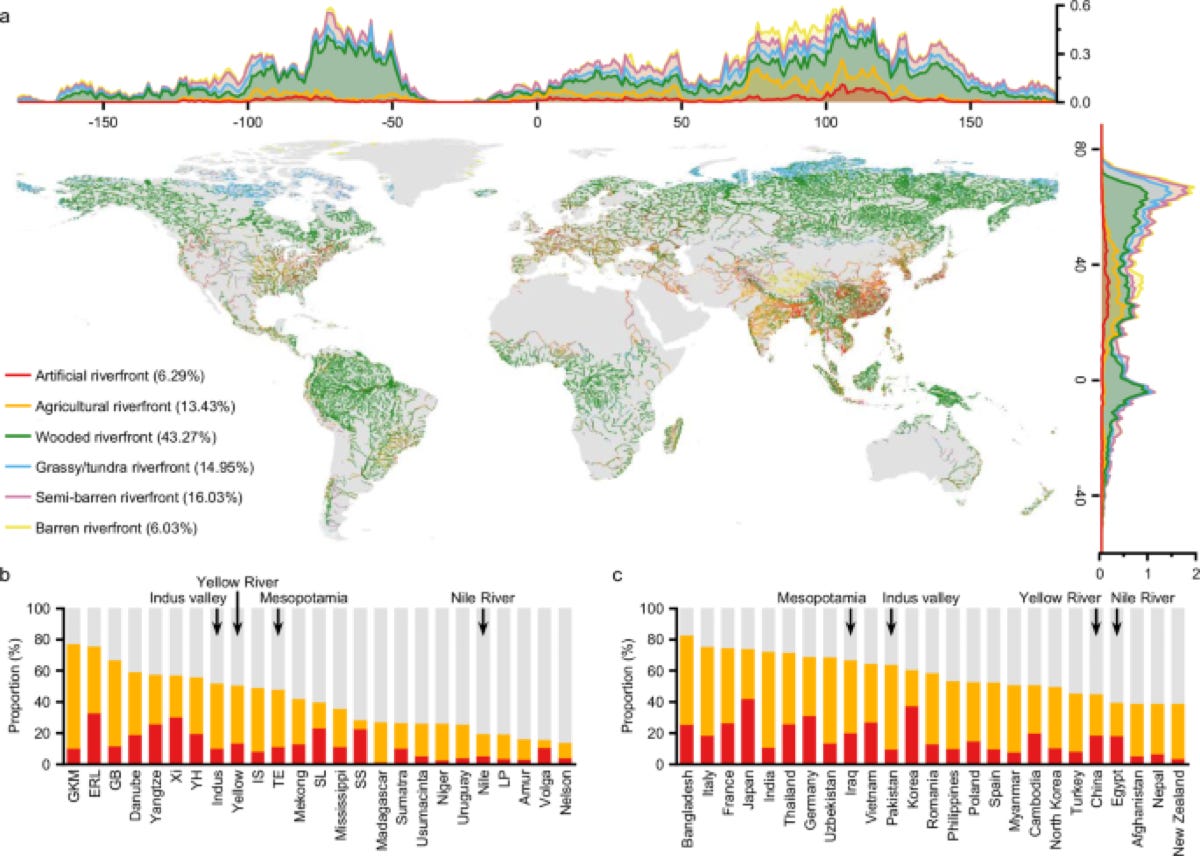
A new study in Nature Communications maps 7.52 million kilometres of riverfront, the strip where land meets water along a river, and finds nearly 20% of it has been modified by people. Most river fragmentation research is about dams, which cut rivers lengthwise. The lateral edge, where farming and building press right up against the channel, has been much harder to see at global scale.
The researchers used satellite imagery and deep learning to build a high-resolution global map of riverfront land cover. Agriculture accounts for 13.43% of global riverfront and built-up areas for 6.29%. The rest breaks down as wooded (43.27%), semi-barren (16.03%), grassy or tundra (14.95%) and barren (6.03%).
A distinct modification belt running across parts of Africa and Eurasia accounts for around 60% of all global alterations, with imprint densities six times higher than everywhere else. The authors link this lateral fragmentation to deteriorating water quality and biodiversity threats, and argue it’s a fundamentally different pressure from the longitudinal fragmentation dams cause. Environmental limits and region-specific socio-economic dependencies explain a lot of where the imprints land.
Geospatial Datasets
1. Forty years of gridded hydrology for 9,067 US basins
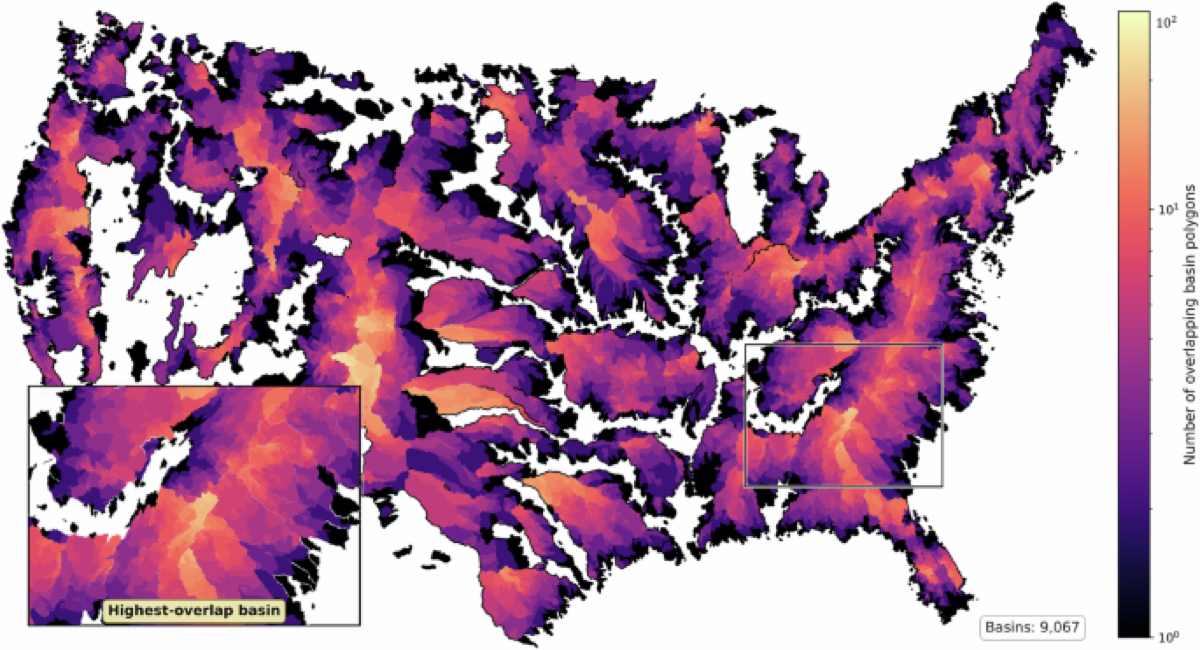
BASINGRID is a spatially distributed hydrology dataset covering 9,067 basins across the contiguous United States from 1985 to 2024, harmonised to a roughly 1 km Daymet reference grid. You can read the paper here and access the data here.
2. Bias-corrected CMIP6 projections for India
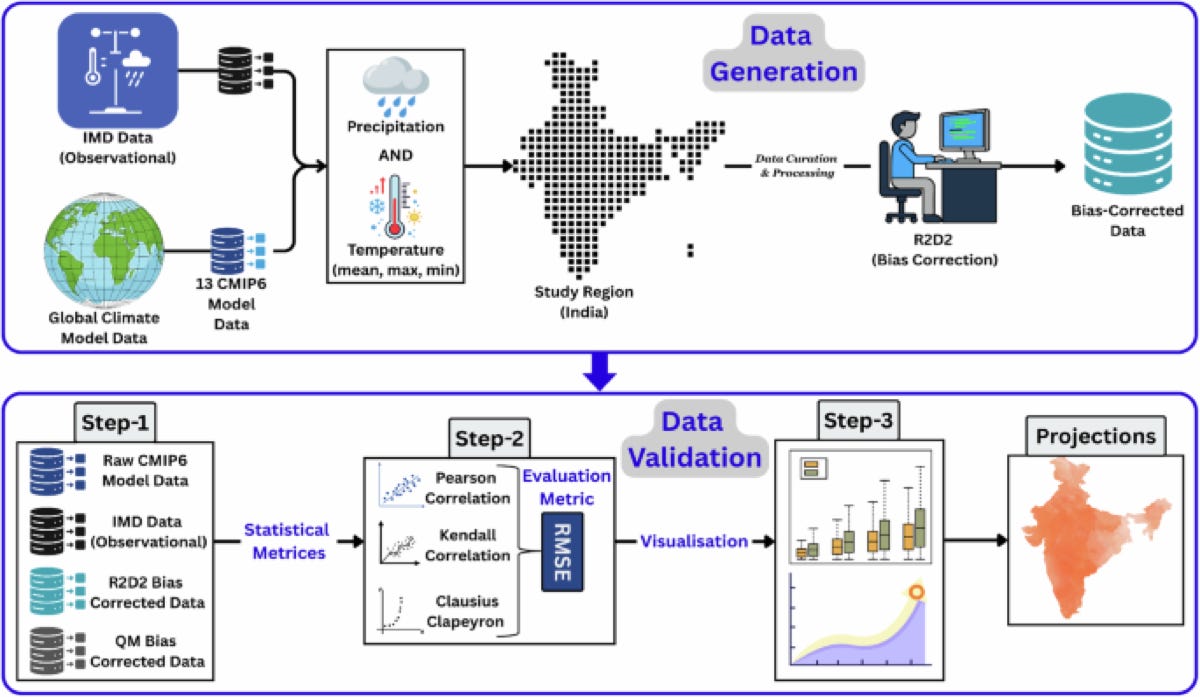
This is a daily, non-stationary, multivariate bias-corrected dataset of precipitation and maximum, minimum and mean temperature for India at 0.25° resolution, derived from 13 CMIP6 global climate models. The paper is here and you can access the data here.
3. A global inventory of landslides studied with DInSAR
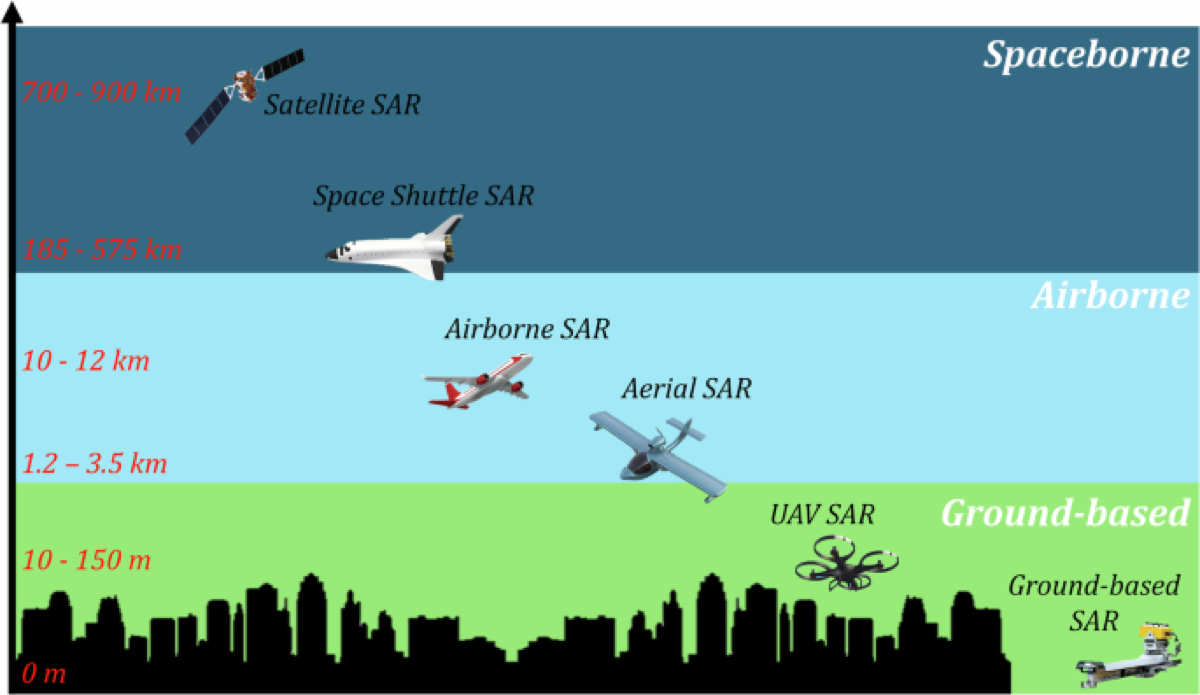
A geo-referenced inventory of landslides that have been investigated using satellite differential SAR interferometry, compiled from a systematic review of the literature from 1995 to 2024. The team screened 2,739 contributions and geo-tagged the resulting 1,480 point identification numbers, distinguishing site-specific from area-wide analyses. China, Italy and the US dominate the case studies, and the positions were validated against the global landslide susceptibility map and independent inventories. The paper is here and you can access the data here.
4. A century of Chinese hydropower stations
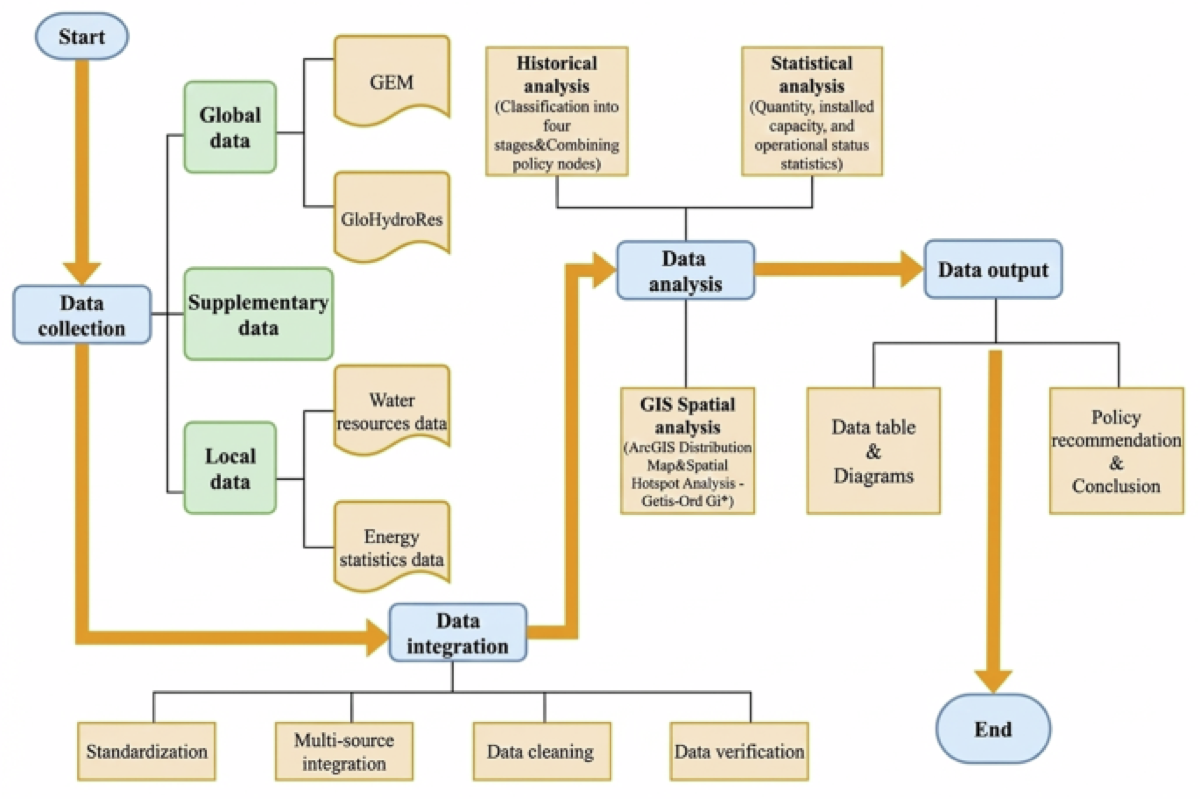
A century-scale inventory of 2,918 georeferenced hydropower stations in mainland China covering 1909 to 2025, compiled from international databases, national statistics and archival sources. The paper is here and you can access the data here.
Other useful bits
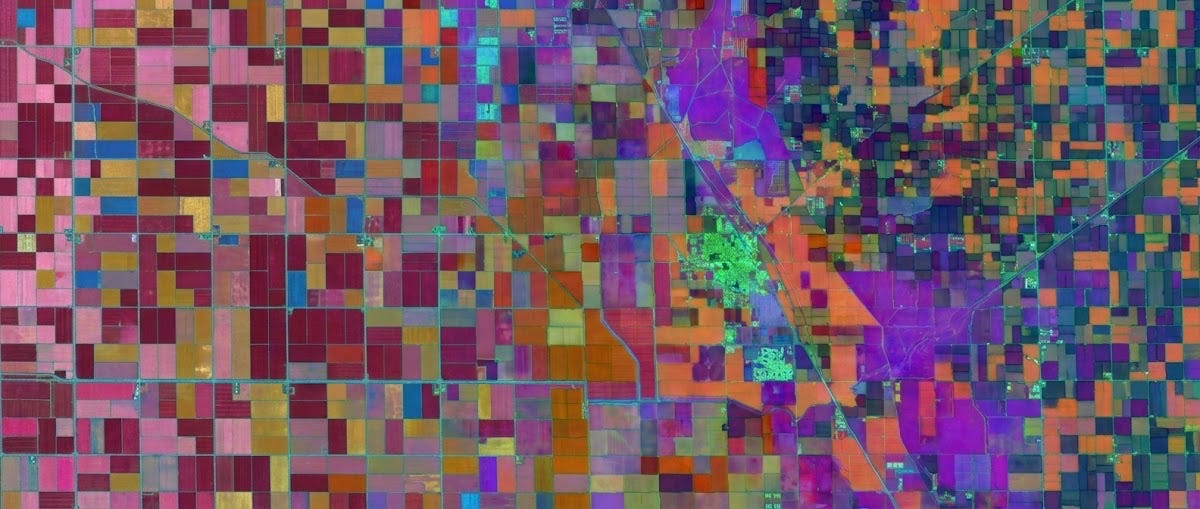
Google Maps Platform has opened a private preview of Custom Satellite Embeddings, powered by DeepMind's AlphaEarth Foundations. Instead of the annual global embedding layer, you can request 10 m, 64-band embeddings for your own region and time window at intervals as short as five days. Academic researchers can apply for free sample datasets through Earth Engine until 1 September 2026.
A new open-source Python package called DefoEye wraps GMTSAR into a single time-series InSAR workflow for Sentinel-1, with parallel job execution, interferogram network pruning and a graphical interface, so you don't need to hand-hold every step. Tested across Bologna, Gotland and Houston it matched GNSS stations with RMSE of 4.3 to 11.9 mm and correlations of 0.63 to 0.95, and the code is on GitHub.
Microsoft has released Aurora 1.5, an update to its open Earth system foundation model that goes from 4 to 26 predicted variables, adds hourly resolution and supports probabilistic ensembles. It beats ECMWF ensemble forecasts on 88.9% of the evaluated variable-and-lead-time targets, and cuts tropical cyclone track error by roughly a third against the original Aurora at day 5. Checkpoints are on Hugging Face and the code is open source.
PAHO and Esri have wrapped up an advanced GIS training series for public health emergency management across the Americas, covering spatial statistics, risk modelling and geospatial data management. It ran through 2025 and 2026 and finished with a virtual session on 17 June, with 100 participants from 21 countries completing the training.
Jobs
Planet is looking for a Senior Engineering Manager for its AI Geospatial Assistant team based in San Francisco.
Muon Space is looking for a Senior Applied Scientist, Geospatial, fully remote.
Overstory is looking for a Staff Machine Learning Engineer working on wildfire, remote in the US or Canada.
Esri is looking for a Product Engineer II for 3D Reality Mapping based in Stuttgart, Germany.
Zipline is looking for a Senior Software Engineer on Maps Routing based in South San Francisco.
Just for Fun
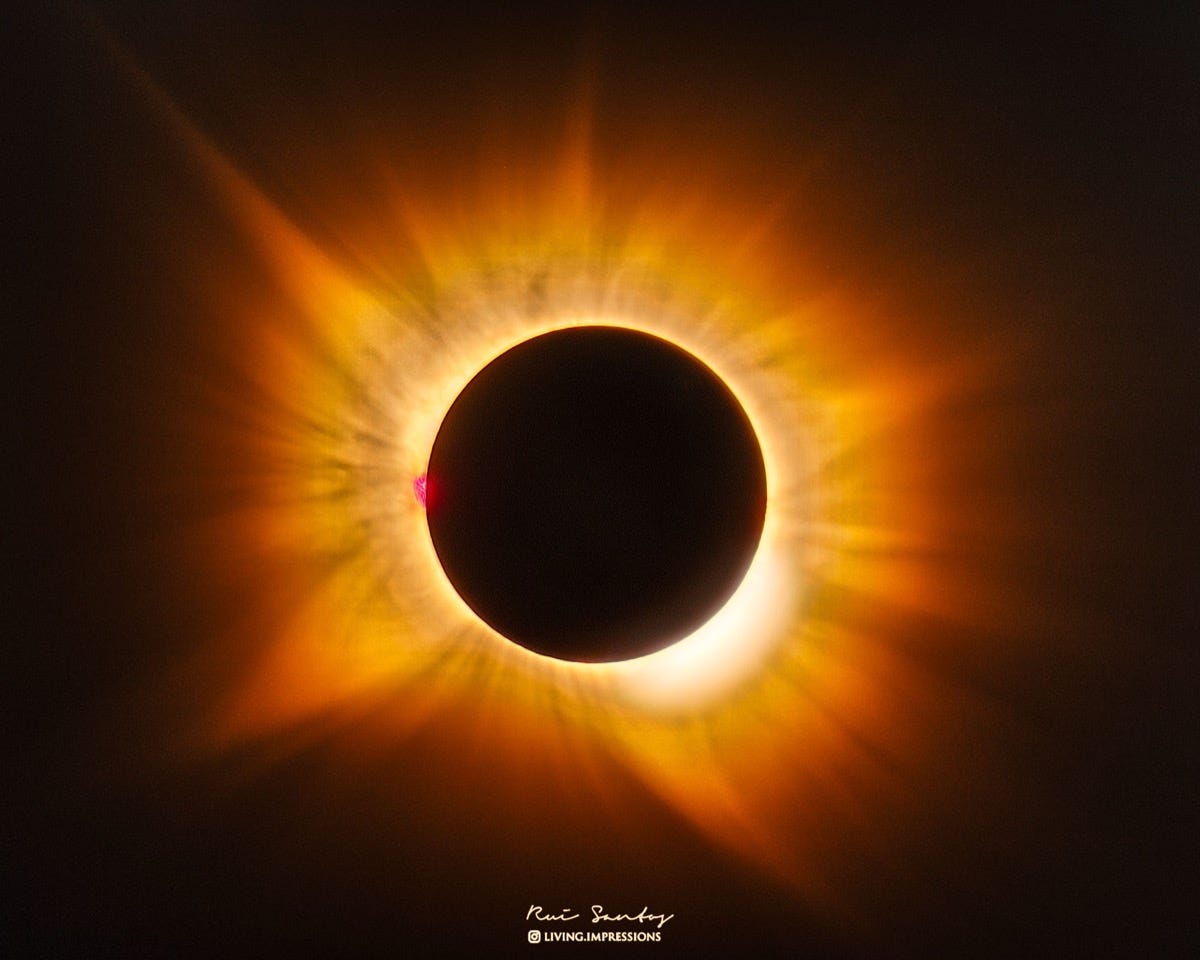
The corona of a total solar eclipse normally looks white, but observers in Spain on 12 August saw a distinctly golden one. Two things did it. Totality happened with the Sun near the horizon, so the light travelled through a lot of atmosphere and lost most of its blue, and smoke from nearby forest fires acted as a second filter that deepened the gold further. The one thing that stayed off-palette was a hydrogen-glowing prominence on the Sun's left edge, which kept its bright pink. This HDR-processed, multiple-exposure image was captured from Benavente, Spain.
That’s it for this week.
I’m always keen to hear from you, so please let me know if you have:
new geospatial datasets
newly published papers
geospatial job opportunities
and I’ll do my best to showcase them here.
Yohan