

🌐 Google's AI that reads academic papers and solves geospatial problems
PLUS: Why crop classification models travel better than expected, making earthquake response planning more efficient, and more

Hey guys, here’s this week’s edition of the Spatial Edge — a newsletter you can digest quicker than you can say ‘sinusoidal projection’… The aim is to make you a better geospatial data scientist in less than five minutes a week.
In today’s newsletter:
AI Coding: DeepMind’s system reads papers, writes expert code.
Crop Mapping: Models transfer surprisingly well across regions.
Earthquake Response: Transformers speed up power grid restoration.
Map Agents: Hierarchical AI handles complex geospatial queries.
Wildfire Prediction: ECOSTRESS data predicted 90% of Australia’s fires.
Research you should know about
1. Google DeepMind’s AI that actually reads academic papers to solve geospatial problems
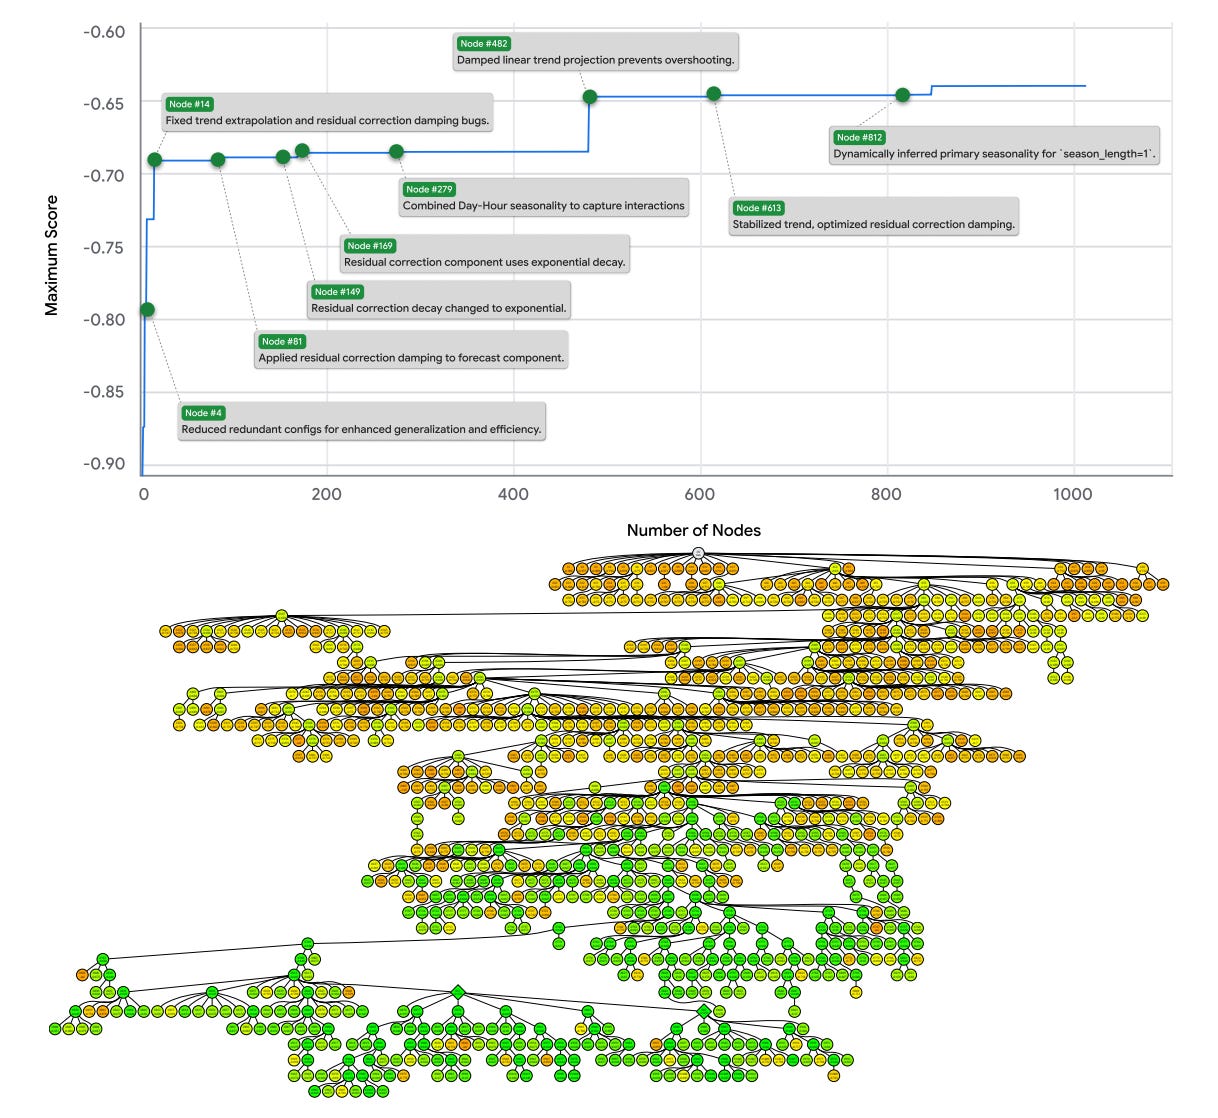
Google DeepMind has released a new AI system that combines large language models with tree search algorithms to write scientific software that matches or beats expert performance. The system works by using an LLM to suggest code improvements, which are then evaluated and kept only if they improve performance. This creates an evolutionary feedback loop similar to how AlphaZero works for games, except here it’s optimising scientific code rather than chess moves. The clever bit is that the system can also incorporate research ideas from academic papers, essentially letting it search through existing scientific knowledge to find better solutions.
The results are pretty impressive across multiple scientific domains. For single-cell RNA sequencing, the system created 40 different methods that outperformed the previous best approach for batch integration. In epidemiological forecasting, it generated 14 methods that beat the CDC’s ensemble model for COVID-19 predictions. The system also achieved state-of-the-art performance on geospatial reasoning tasks, neural activity prediction, and time series forecasting. In one particularly interesting example, it figured out how to combine complex architectures like U-Nets and transformers for geospatial problems with minimal prompting.
What makes this system different from previous AI coding tools is its ability to dramatically speed up the research process. Tasks that would normally take us mere mortals weeks or months can now be explored in hours or days. The system generates solutions by running what’s essentially a sophisticated trial-and-error process, testing hundreds or thousands of code variations (they used searches of 300 to 2,000 nodes depending on the problem).
2. Why crop classification models travel better than expected
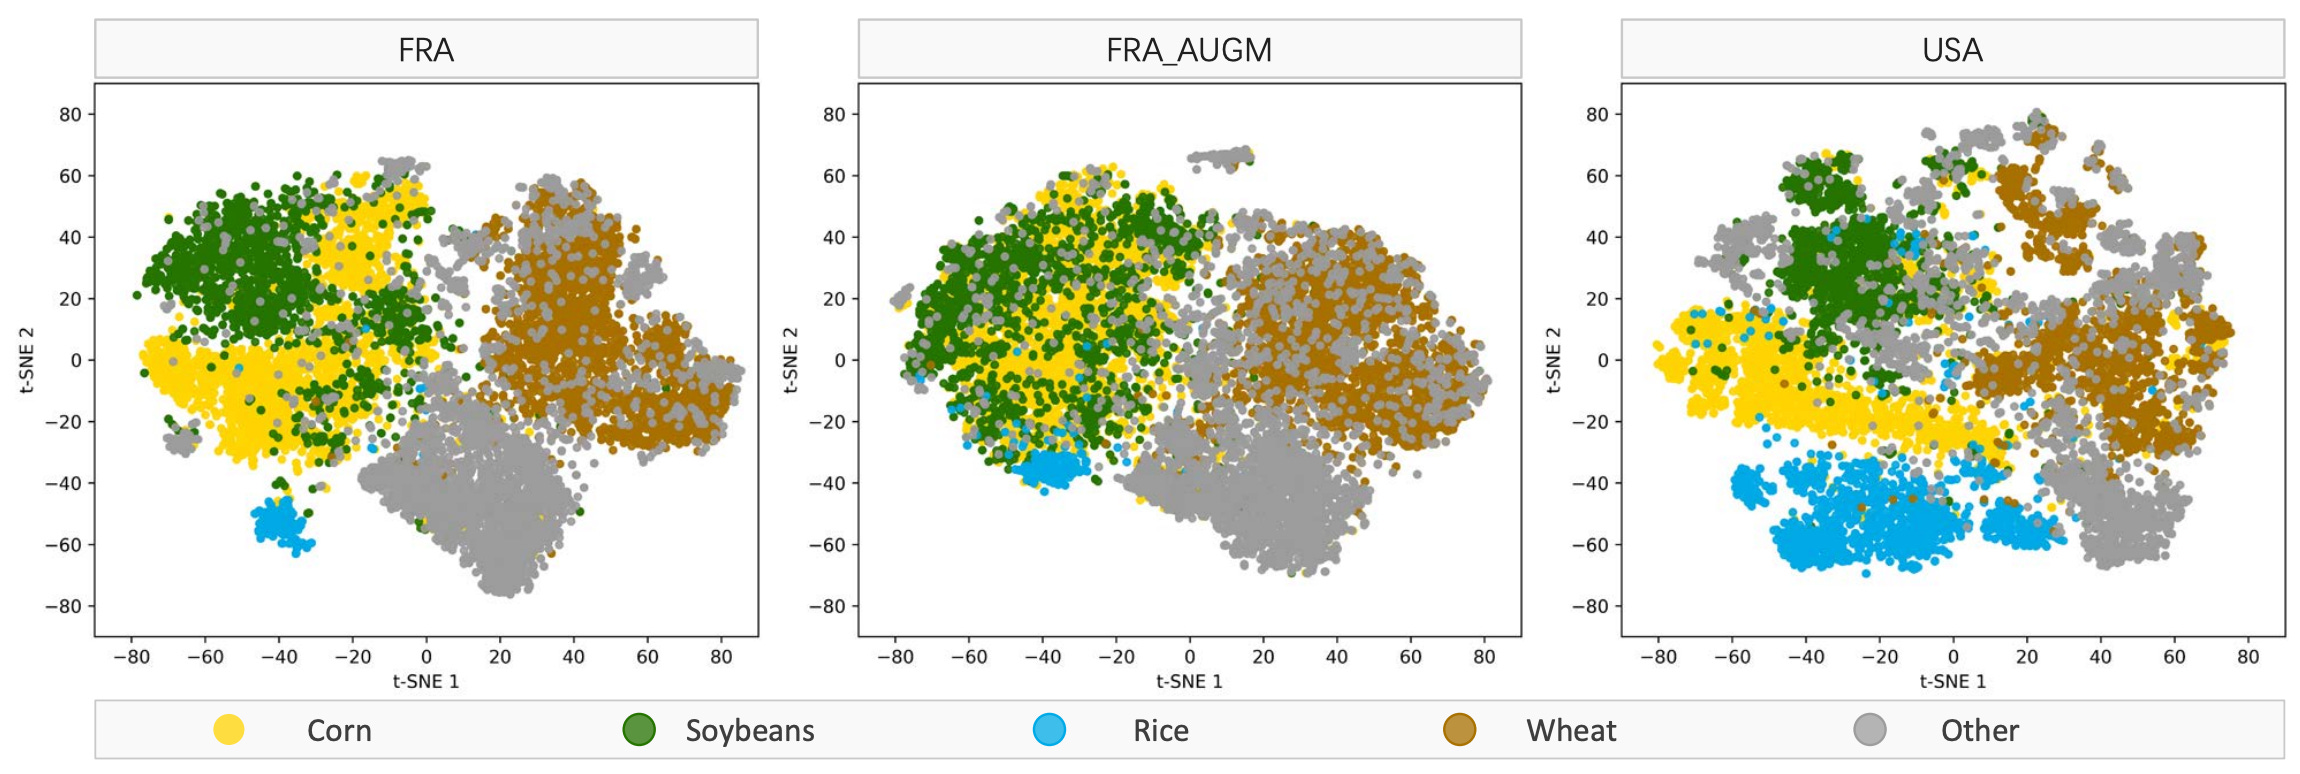
Crop mapping has always been a tricky problem when you’re trying to apply models trained in one region to another. Different climates, growing seasons, and farming practices mean that what works well in France might suck in Argentina. But a new study from researchers at MIT shows that Sentinel-2 satellite data transfers far better across regions than most researchers expected.
The researchers built CropGlobe, a dataset covering eight countries across five continents, and tested how well crop classification models trained in one place work in another. They found that using 2D convolutional neural networks on Sentinel-2’s multi-spectral time series data (basically, tracking how different light wavelengths bounce off crops over time) works surprisingly well. The 2D approach beats simpler 1D models because it captures relationships between different spectral bands and how they change together over time. When crops develop earlier or later due to climate differences, these patterns shift but stay recognisable. The sweet spot turned out to be 5-day observation intervals rather than longer windows, since this captures subtle changes in crop growth stages.
The results are pretty compelling. Even in the toughest cross-hemisphere transfers, accuracy stayed above 85%. Models trained on European crops could classify American crops with around 75% accuracy, and Southern Hemisphere transfers worked just as well. The catch is that this study focused on high-income countries with industrial-scale farming. The method might struggle in regions with intercropping, very low yields, or completely different farming systems (common in sub-Saharan Africa). Still, the researchers reckon their approach could work as a starting point for these harder cases, especially if you combine it with even small amounts of local training data.
3. Making earthquake response planning more efficient
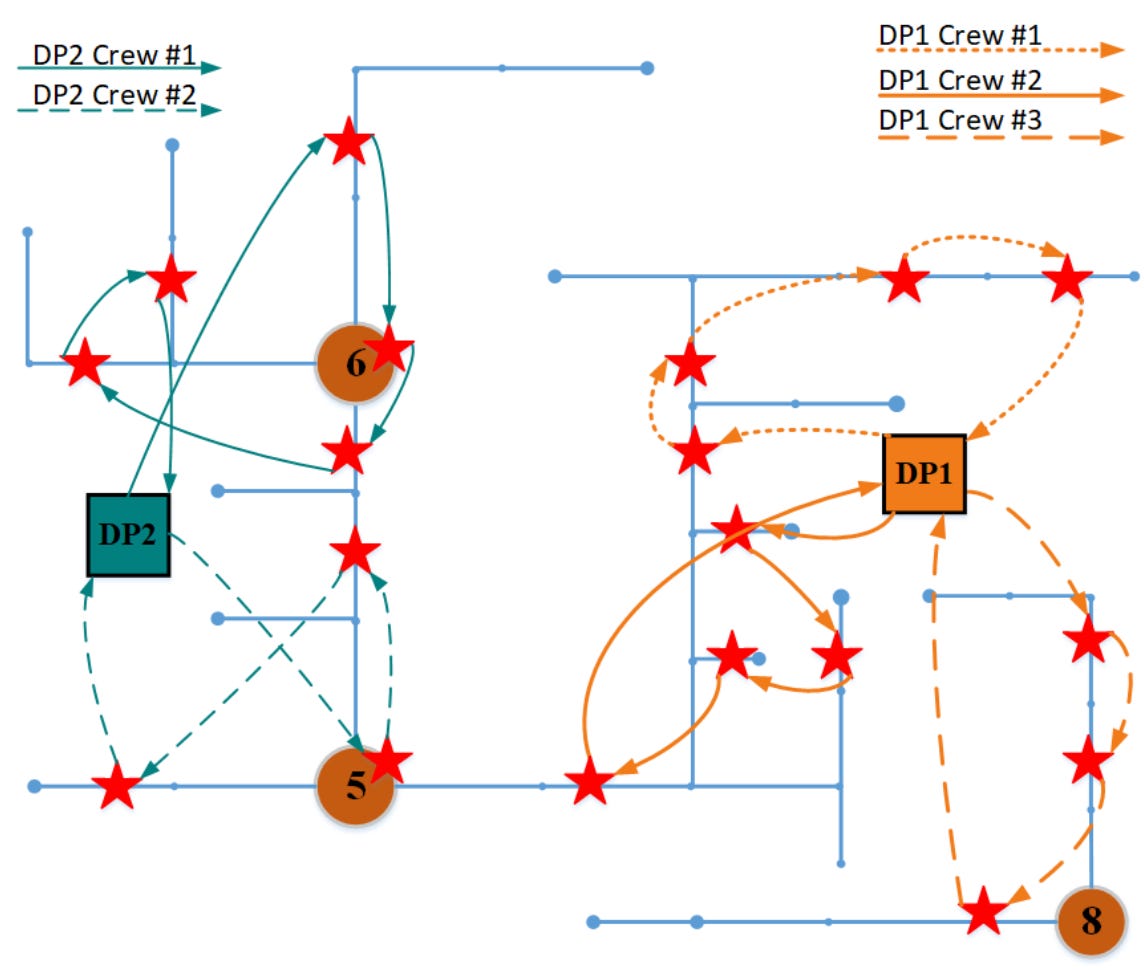
When an earthquake hits and power lines go down, utilities face a brutal optimisation problem. They need to figure out which repair crews should go where, in what order, to restore power as quickly as possible. The trouble is that traditional methods (like mixed-integer linear programming) can take hours to compute solutions. And whilst your computer is crunching numbers, the lights stay off.
A new study addresses this by using transformer neural networks combined with deep reinforcement learning to make near-instant crew dispatch decisions. The researchers first model earthquake damage using fragility curves (which estimate component failure probabilities based on ground shaking intensity), then generate realistic damage scenarios. Instead of solving the routing problem from scratch each time, they train a transformer model offline on thousands of simulated earthquake scenarios. The transformer learns to sequence repair jobs by capturing spatial patterns and temporal dependencies, whilst the reinforcement learning component optimises for minimising both restoration time and energy not supplied.
The results are pretty compelling. On a 2,869-bus European power system, the learning-based approach delivered solutions in 14 to 16 seconds, compared to hours for traditional solvers like CPLEX and Gurobi (which still couldn’t reach optimal solutions even after five hours). More importantly, because decisions happen instantly rather than after hours of computation, the system recovers faster overall. The method achieved up to 99.7% runtime reduction whilst maintaining solution quality, and the resilience curves show the grid bouncing back much more quickly. For disaster response scenarios where every minute of delay means more people without power, this kind of speed improvement could be genuinely transformative.
4. An AI agent that can actually use maps
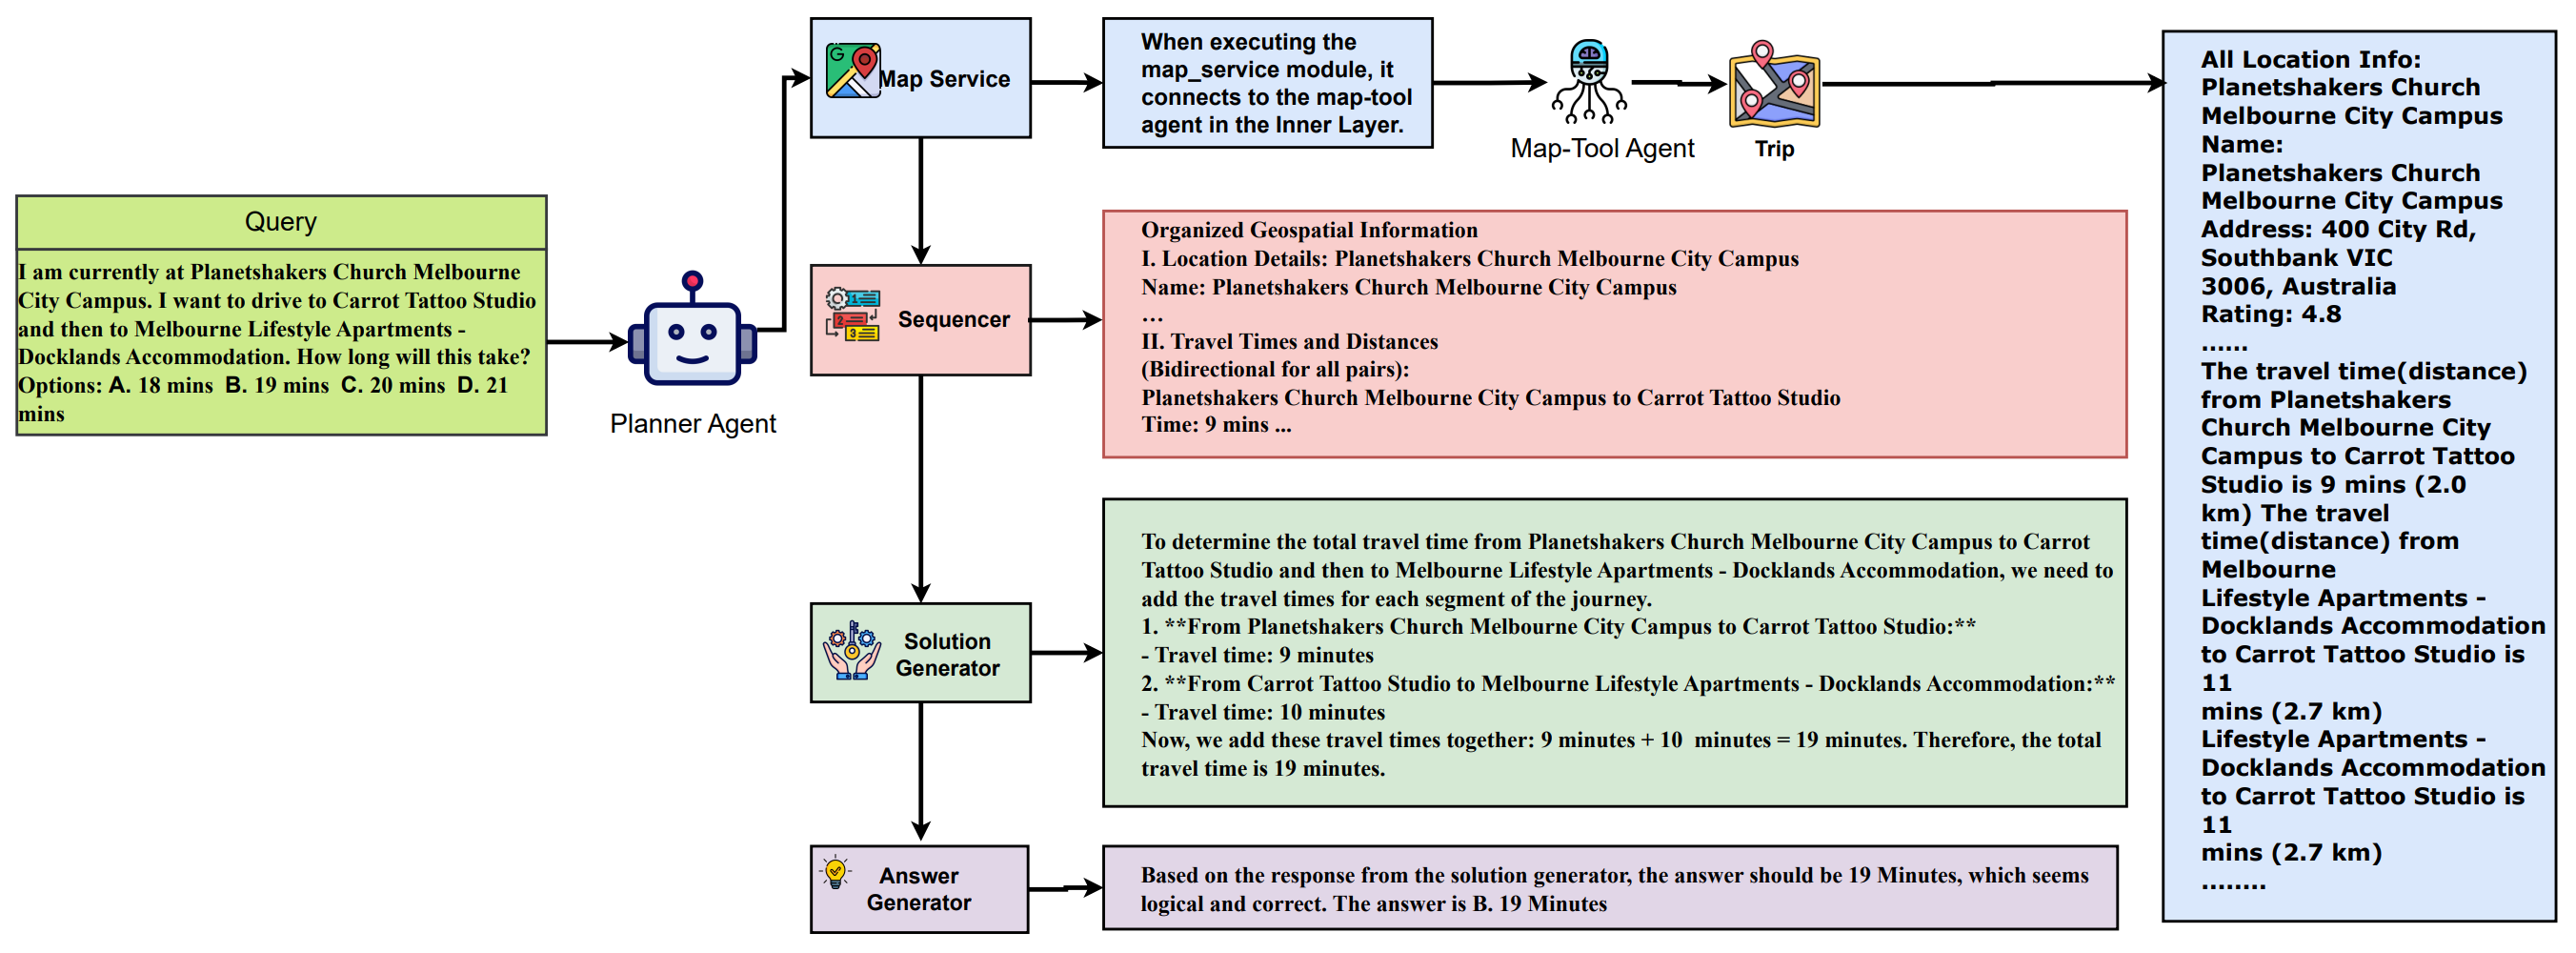
If you’ve ever tried getting a language model to answer a map-based question (like “What’s the best route between these cafés?” or “Which restaurants near this park have the highest ratings?”), you’ll know they often struggle. The problem is twofold. First, they can’t actually interact with map services to fetch real-time data. Second, when you give them access to lots of different tools, they get overwhelmed trying to coordinate between them. A new paper introduces MapAgent, a hierarchical multi-agent framework that tackles both issues by splitting high-level planning from low-level tool execution.
MapAgent works through a two-layer system. At the top, a planner agent breaks down complex queries into smaller subgoals and routes them to the right modules. For anything involving maps (like finding nearby places or calculating routes), it hands off to a specialised map-tool agent that manages four core tools built on Google Maps APIs:
Nearby (for finding points of interest),
PlaceInfo (for detailed place data),
Route (for directions between two points), and
Trip (for multi-stop journeys with place details).
The framework can handle queries from plain text, long contextual descriptions, or even visual map snapshots. This hierarchical setup prevents the system from getting bogged down trying to juggle too many tools at once.
The results are pretty solid across four geospatial benchmarks. MapAgent achieves an average 8.2% improvement over the strongest baseline (a system called OctoTools), with gains reaching 10-11% on some datasets when using GPT-3.5-Turbo. The ablation studies show that both the hierarchical architecture and the custom map tools are crucial. The framework even outperforms vision-language models on visual map queries by fetching supplementary API data rather than relying solely on what’s visible in the image.
You can access the code here.
Geospatial Datasets
1. NASA ECOSTRESS data

NASA’s ECOSTRESS dataset is proving to be pretty important for wildfire prediction. By combining ECOSTRESS thermal data with machine learning models, researchers successfully predicted more than 90% of Australia’s 2019–2020 wildfires a week in advance. You can access the data here.
2. Biodiversity intactness footprint dataset

This global dataset tracks how agriculture has shaped biodiversity from 2000 to 2020, linking land use change to biodiversity loss using the Biodiversity Intactness Index (BII). It combines harmonised land-use maps (HHLU) at 500-metre resolution with crop and livestock data to reveal biodiversity footprints across 14 biomes, 193 countries, 154 crops, and 9 livestock types. You can access the data here.
3. Arctic Ocean Thermohaline dataset

The Arctic Ocean Thermohaline Dataset (AOTD) brings together 414,221 quality-controlled temperature and salinity profiles from 1983–2023 to tackle sparse high-latitude observations. It includes a monthly climatology gridded at 0.25° × 0.25° with 57 vertical layers from 0–1500 m, plus derived Ocean Heat Content. You can access the grid data here, scatter data here, and the code here.
4. Seismic vulnerability maps

This open dataset maps seismic vulnerability across critical road corridors in Turin and Naples, linking buildings, bridges, tunnels and landslides (Turin) to detailed attributes for fragility analysis and network-level resilience studies. You can access the data here.
Other useful bits

NASA and ISRO’s joint NISAR mission has released its first radar images of Earth, showcasing the satellite’s ability to capture land, vegetation, and water in incredible detail. Using both L- and S-band radar, NISAR will soon begin full operations, helping scientists monitor forests, crops, and land changes across the globe
city2graph is a pretty handy Python library that turns geospatial data into network graphs. The latest update adds support for heterogeneous metapaths, contiguity graphs, and OD matrices. You can also check out its GitHub for docs and more info.
Scribble Maps is using Google Maps Platform to let users create custom, data-driven “scores” for anything, from planning holidays to choosing retail sites. Their new ScribbleSight tool blends 3D maps, air quality, pollen, and place data.
The GEOGLOWS River Forecast System offers near-real-time global river discharge forecasts and long-term simulations to support flood, drought, and water management. Powered by ECMWF runoff data and RAPID river routing, it’s accessible through the interactive Hydroviewer for visualising river flow patterns worldwide.
Jobs
The World Bank is looking for a Cartographer based in Washington DC, United States.
UNOOSA is looking for an intern in Earth Observation for Water Management in Vienna, Austria.
IOM is looking for a Consultant in Spatial Analytics in Jakarta, Indonesia.
Institute for the Study of War (ISW) is looking for a hybrid Geospatial Researcher.
The Nature Conservancy (TNC) is looking for a Forest Spatial Scientist based in Missoula, United States.
Just for Fun

Google Maps still doesn’t offer full navigation in South Korea because the government won’t allow export of its detailed 1:5,000 national map, citing security and data sovereignty concerns. Who woulda thought…
That’s it for this week.
I’m always keen to hear from you, so please let me know if you have:
new geospatial datasets
newly published papers
geospatial job opportunities
and I’ll do my best to showcase them here.
Yohan