

🌐 Harmonising nighttime light data across decades
PLUS: Google's new embeddings, a unified world model for Earth observation, and more.

Hey guys, here’s this week’s edition of the Spatial Edge — a newsletter that’s slightly cheaper than your ESRI subscription. In any case, the aim is to make you a better geospatial data scientist in less than five minutes a week.
In today’s newsletter:
Nightlights Harmonisation: Deep learning links DMSP and VIIRS.
Map Navigation: AI struggles with route planning.
Earth World Models: RS-WorldModel predicts future satellite scenes.
Satellite Image Editing: RSEdit reshapes remote sensing imagery.
Google Urban Embeddings: S2Vec summarises the built environment.
Research you should know about
1. Harmonising nighttime light data across decades
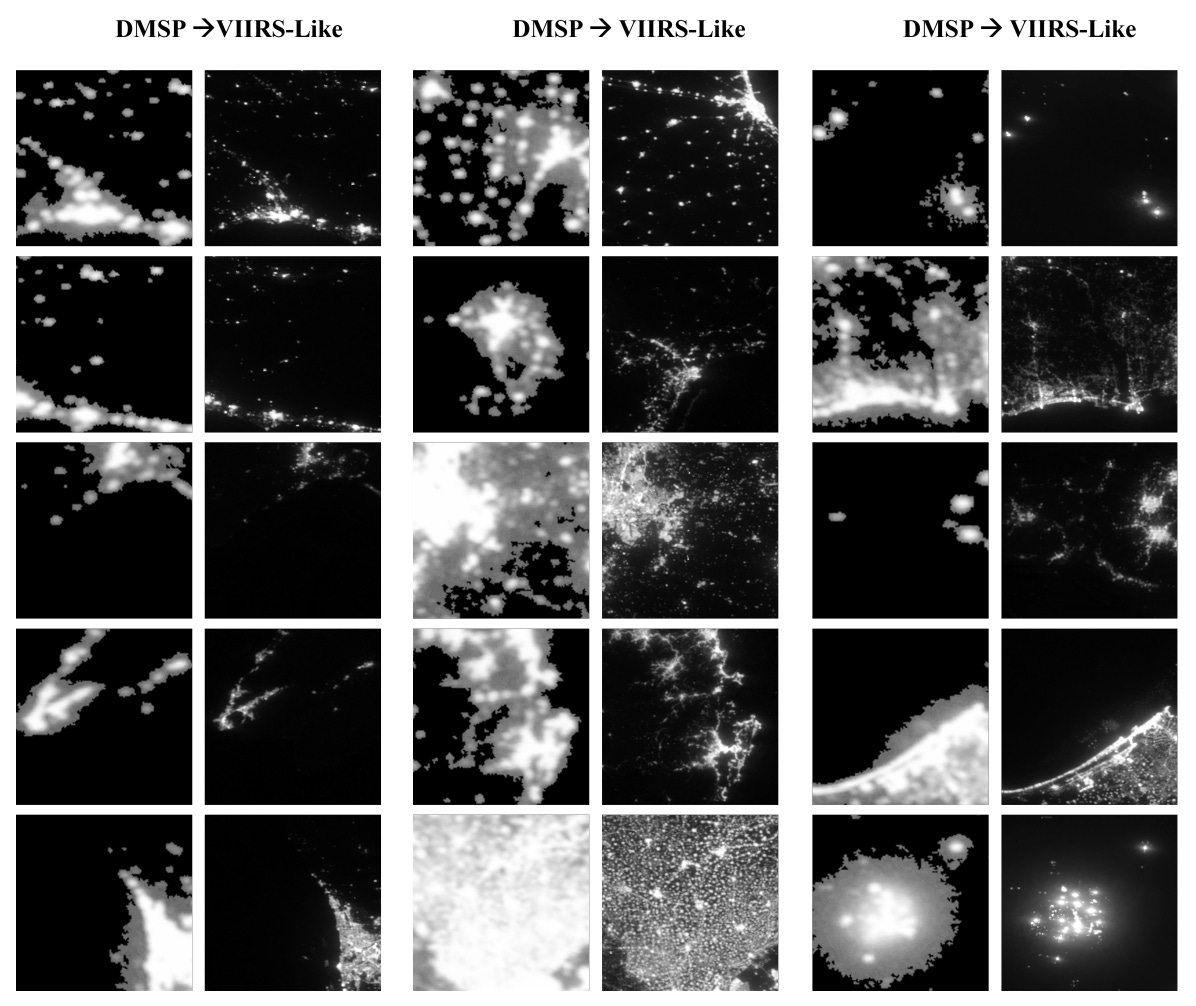
Anyone who’s worked with nightlights data knows the long-running headache: DMSP-OLS data goes back to 1992 but suffers from saturation in city centres, blooming, and no on-board calibration. VIIRS, which kicked in from 2012, fixes most of these issues with finer resolution and a much wider dynamic range. The problem is, if you want a long time series stretching back before 2012, you’re stuck stitching together two sensors that don’t really speak the same language. A new paper addresses this with a deep learning approach that translates DMSP imagery into something that looks like it came out of VIIRS.
The authors use a CUT-based generator (a type of image-to-image translation model) trained on overlapping DMSP and VIIRS data. The idea is to teach the model what a VIIRS scene “should” look like given a DMSP input, so you can then run it on pre-2012 DMSP data and get a harmonised series. On their held-out test set of 1,862 patches, they get an R² of 0.87 on radiance, an RMSE of 0.114, and an SSIM (structural similarity) of 0.79. Visually, around 75% of cases look pretty clean, with the model successfully recovering internal structure in cities that DMSP had flattened into uniform blobs.
It’s not flawless though. About 8% of patches throw up artefacts, and the failure modes are pretty instructive. In megacity cores where DMSP is fully saturated at DN=63, the model can’t hallucinate plausible internal structure and produces checkerboard patterns from the upsampling kernel. Around isolated bright points like ports and gas flares, you get halo effects where the model over-generates radial glow. So if you’re using harmonised data for analysis of dense urban cores or industrial sites, you’ll want to flag those areas. For everything else, this looks like a useful step towards a properly continuous nightlights record from 1992 to today.
2. Testing if AI can navigate a map
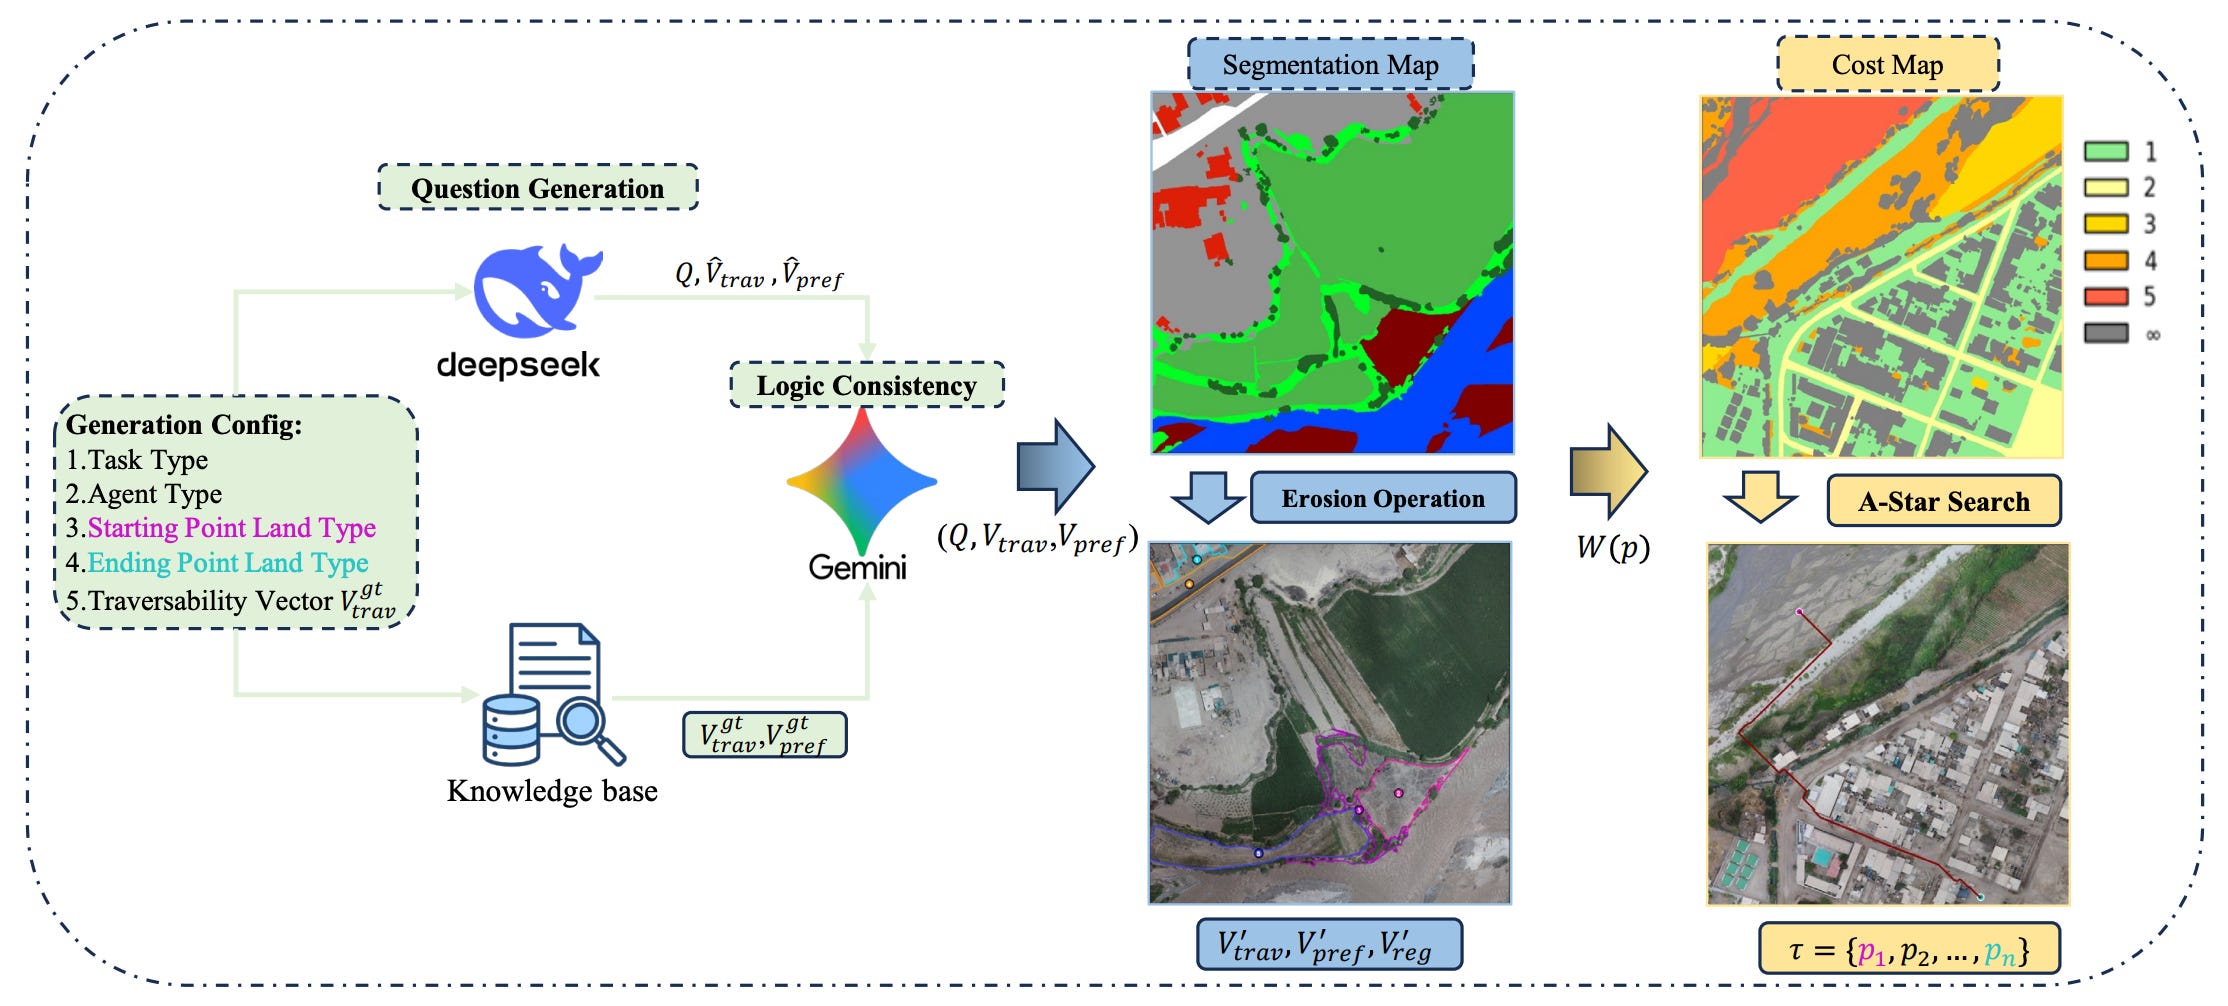
Multimodal large language models (MLLMs) are becoming pretty smart at analysing satellite images. If you show them a photo of a landscape, they can usually identify the buildings, spot the rivers, and classify the terrain. But there’s a massive difference between simply recognising objects and actually planning a route through them. If a rescue team needs to know the safest path for an off-road vehicle across a flooded disaster zone, simply identifying the water isn’t enough; the AI needs to understand the vehicle’s capabilities, map out the terrain, and plot a strict, step-by-step route. Until now, there hasn’t been a reliable way to test if AI models can actually do this kind of complex, constraint-based planning.
A new study introduces NeSy-Route, a massive new testing framework designed to evaluate how well AI models can navigate remote sensing imagery. Instead of just asking the AI to pick the best route from a multiple-choice list, NeSy-Route forces the model to complete three increasingly difficult tasks. First, the AI has to read a text prompt (like “find the fastest route for a pedestrian avoiding water”) and translate those rules into strict mathematical constraints. Next, it has to look at the satellite image and correctly identify which parts of the terrain match those constraints. Finally, it has to generate an actual, coordinate-by-coordinate path from start to finish.
The researchers tested 10,821 different scenarios across a variety of top-tier AI models, and the results were pretty revealing. While most advanced models were pretty good at understanding the text constraints, they completely fell apart when asked to actually plot the route on the map. Even the smartest proprietary models generated highly inefficient paths, while open-source models often plotted routes that drove straight through restricted obstacles. Ultimately, this benchmark proves that while AI is great at describing satellite images, it still lacks the deep, global reasoning required to reliably navigate the real world. I don’t think this is surprising though, as LLMs are not trained/fine-tuned for the task (yet…).
3. A unified world model for Earth observation
If 2025 was the year of ‘foundation models’, 2026 is the year of ‘world models’. Basically, the idea is that a World Model understands complex environments and predict future states for things like autonomous driving and robotics. However, applying this concept to Earth observation has been pretty difficult. Typically, remote sensing algorithms are split into two completely separate camps. Models either understand and describe changes between satellite images, or they synthesise new landscapes from scratch. Because these tasks are kept isolated, the algorithms miss out on shared geographic knowledge, leaving generative models hard to control and analytical models unable to grasp future physical constraints.
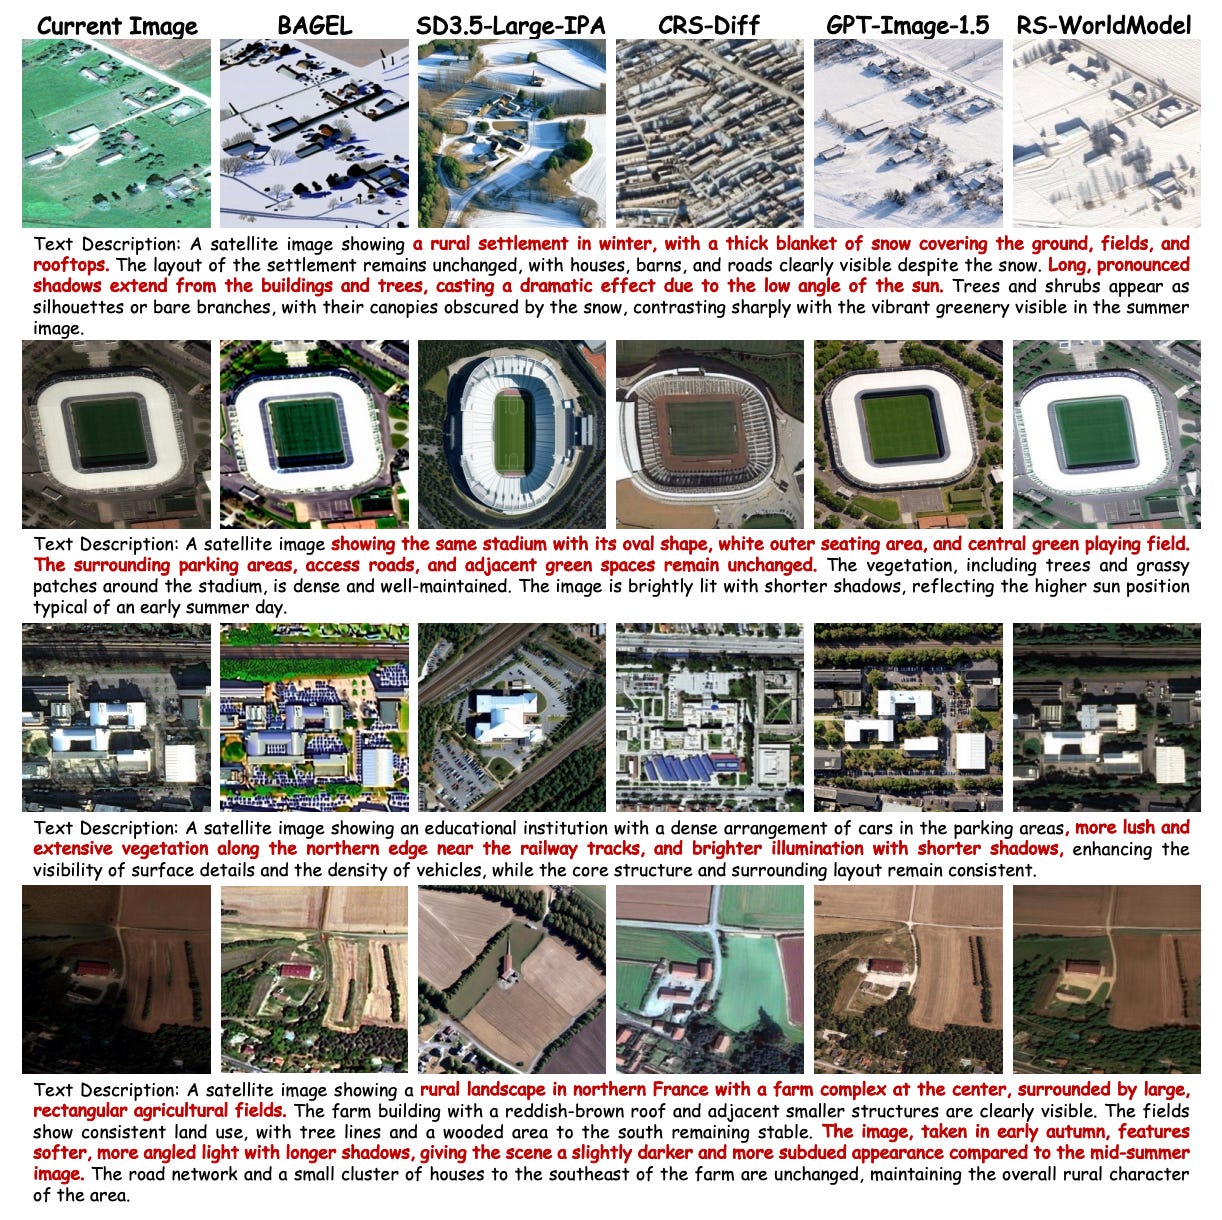
RS-WorldModel is a new system that bridges this gap by tackling both spatiotemporal change analysis and future scene forecasting simultaneously in three stages. These stages are worth understanding because each does something distinct. First, Geo-Aware Generative Pre-training teaches the model to predict future scenes conditioned only on geospatial metadata, with no text involved. Second, Synergistic Instruction Tuning jointly trains the model on both change description and text-guided forecasting, so the two tasks reinforce each other. Third, Verifiable Reinforcement Optimization uses GRPO with task-specific rewards: cosine similarity for forecasting, and an LLM judge for change descriptions that can detect physically implausible outputs (e.g. impossible illumination changes given the sun angle). The ablations show each stage matters. Stripping out the geographic metadata alone bumps FID from 50.28 to 53.72, and removing the pre-training stage entirely sends FID up to 73.55.
The numbers are pretty compelling. On change description, RS-WorldModel beats Qwen3-VL-32B on most metrics despite being 16x smaller, with ROUGE-L jumping 21% over the same-size base model. On forecasting, it cuts FID by 48% relative to CRS-Diff and even beats Gemini-2.5-Flash Image (43.13 vs 46.14). The qualitative examples are particularly nice: when prompted with a winter scene description, the model preserves the underlying settlement layout while adding realistic snow cover and long shadows from a low sun angle, whereas the baselines either miss the structure or generate geographically implausible textures. For anyone working on land-use change, climate adaptation, or any application where you’d want to simulate future satellite imagery under different scenarios, this looks like a pretty interesting tool.
4. RSEdit: giving AI the power to reshape satellite imagery
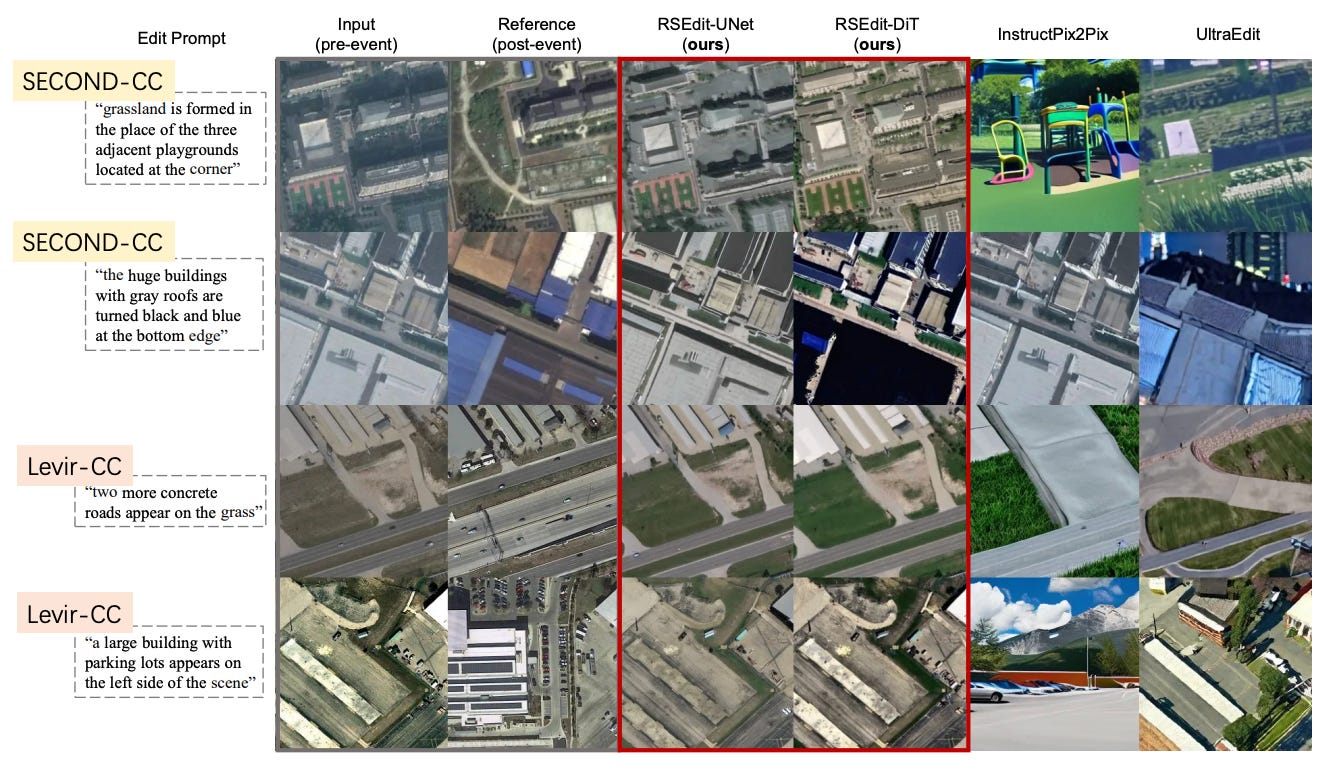
While text-to-image AI models can easily generate highly realistic pictures of cats or fantasy landscapes, they struggle when asked to edit remote sensing satellite imagery. If you prompt a standard AI editor to show what a village would look like after a flood, it will often hallucinate buildings that don’t exist, distort the strict top-down perspective, or break the laws of physics. This happens because general-purpose AI models lack a deep understanding of geography and are built using conditioning methods that don’t align with the rigid spatial rules of Earth observation data.
To fix this, researchers built RSEdit, a new framework specifically designed to edit remote sensing imagery. Instead of forcing satellite data to fit a generic AI model, RSEdit adapts the underlying architecture of top-tier diffusion models (like Stable Diffusion and PixArt-α) to respect the strict spatial layout of satellite images. For older models, it tightly binds the original image to the edit instructions pixel-by-pixel, and for newer models, it treats the edit as a continuous stream of data tokens. The researchers trained the system on over 60,000 before-and-after satellite images detailing everything from urban expansion to natural disasters.
The results are pretty impressive. When asked to simulate complex scenarios like a tsunami hitting a coastline or a wildfire damaging specific structures, RSEdit generated physically plausible, highly accurate edits without hallucinating extra details or warping the surrounding roads and vegetation. In direct comparisons using specialised building-damage assessment tools, RSEdit outperformed leading general-domain editors like InstructPix2Pix by a massive margin. Ultimately, this framework provides a powerful, on-demand way to simulate disaster impacts and urban growth, creating a valuable new source of training data for environmental analysis.
Geospatial Datasets
1. High-res in-season crop mapping dataset

The newly developed In-season Crop-type Data Layer (ICDL) provides 10-metre resolution crop planting maps across the contiguous United States. You can access the data here and the code here.
2. Ancient China population dataset

A pretty original new dataset reconstructs county-level population distributions in ancient China for the pivotal years of 2, 742, 1102, and 1820 AD. It estimates population figures for over 6,000 counties across four representative dynasties. You can access the data here.
3. Off-shore marine cadastre dataset
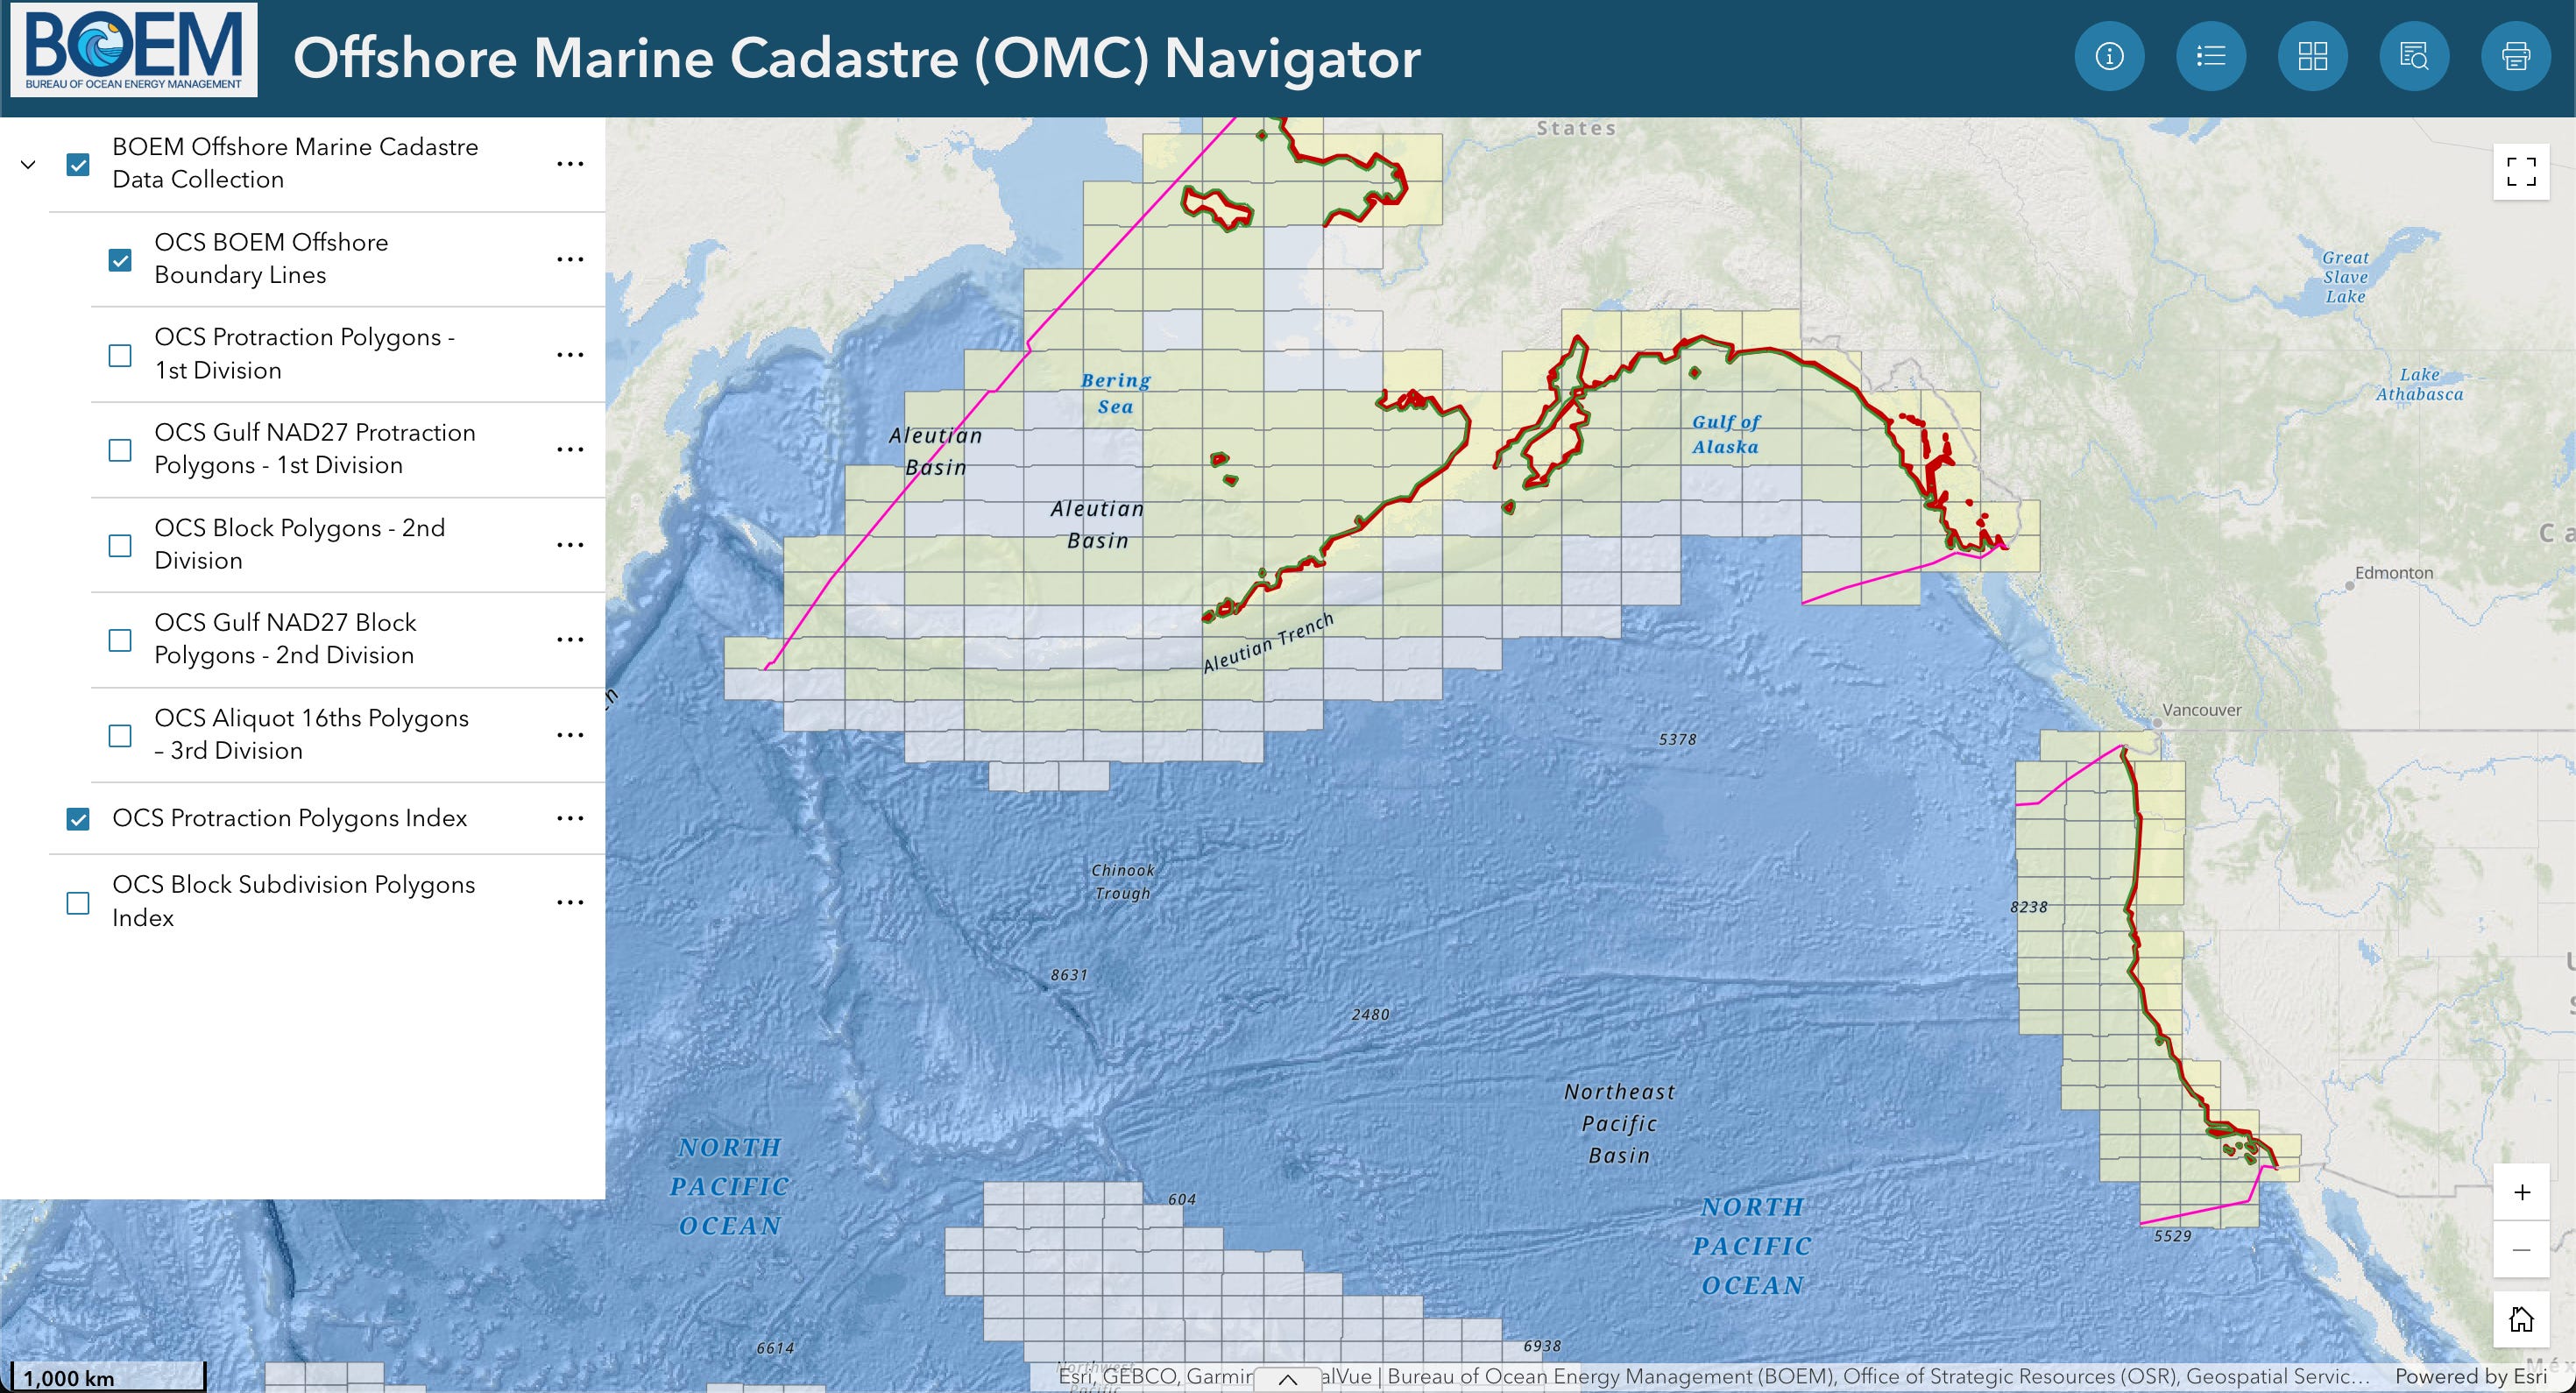
The US Bureau of Ocean Energy Management has recently released a new Offshore Marine Cadastre Data Collection, essentially consolidating various regionally focused datasets into one streamlined national resource. You can access the data here or here. You can also check out the navigator here.
4. Comprehensive crop yield dataset

The CYCleSS dataset offers a large-scale resource for predicting crop yields across England, blending precision agriculture with environmental data. It features anonymised yield data from 934 fields alongside 10-km resolution satellite, daily weather, and soil type information from 2015 to 2017. You access the data here and the code here.
Other useful bits

Google Research introduced S2Vec, a new AI framework that learns to read the built environment of our cities just like a human would. By transforming complex geospatial data into simple mathematical summaries, it provides a way of predicting important socioeconomic and environmental patterns across the globe.
The WMO has published its latest State of the Global Climate report.
It brings together evidence on ocean heat, sea ice, temperatures, greenhouse gases, and other indicators of a changing climate. It is also a useful reminder of why long-term Earth observation matters for climate monitoring, risk management, and public policy.
The World Bank has launched the Land Data Map, an interactive platform for exploring land-related data. The tool makes it easier to see how land systems connect with development outcomes such as economic growth, jobs, and investment. It is a useful resource for anyone working on land governance, urban development, or spatial planning.
Jobs
TomTom is looking for a Staff UX Designer under their Map Visualisation team based in Amsterdam.
UN DESA is looking for two interns in (1) Geodesy & Geospatial Research Support and (2) Digital Design, Data Visualization & Geospatial Communications.
Esri is looking for a remote GIS Project Manager under their Assessment Department based in Canada.
Stantec is looking for a GIS Analyst under their Energy and Resources budiness unit based in Toronto.
Just for Fun
NASA has released some images of the SWOT satellite to map the Earth’s ocean floor.
That’s it for this week.
I’m always keen to hear from you, so please let me know if you have:
new geospatial datasets
newly published papers
geospatial job opportunities
and I’ll do my best to showcase them here.
Yohan