

🌐 A new tool for searching OpenStreetMap with text
PLUS: How the weather is affecting marriages, falling global ocean productivity, and more.

Hey guys, here’s this week’s edition of the Spatial Edge — a newsletter which, according to my mum, is the fifth best geospatial newsletter out there. In any case, the aim is to make you a better geospatial data scientist in less than five minutes a week.
In today’s newsletter:
Geospatial Search: Plain-language tool for OpenStreetMap queries.
Weather & Marriage: Climate shocks accelerate marriage.
Ocean Productivity: Phytoplankton growth falling across half the seas.
Video Compression: Shrinking climate datasets with modern codecs.
Cyclone Forecasting: New 70-year benchmark dataset released.
Research you should know about
1. Making geospatial search work for investigations
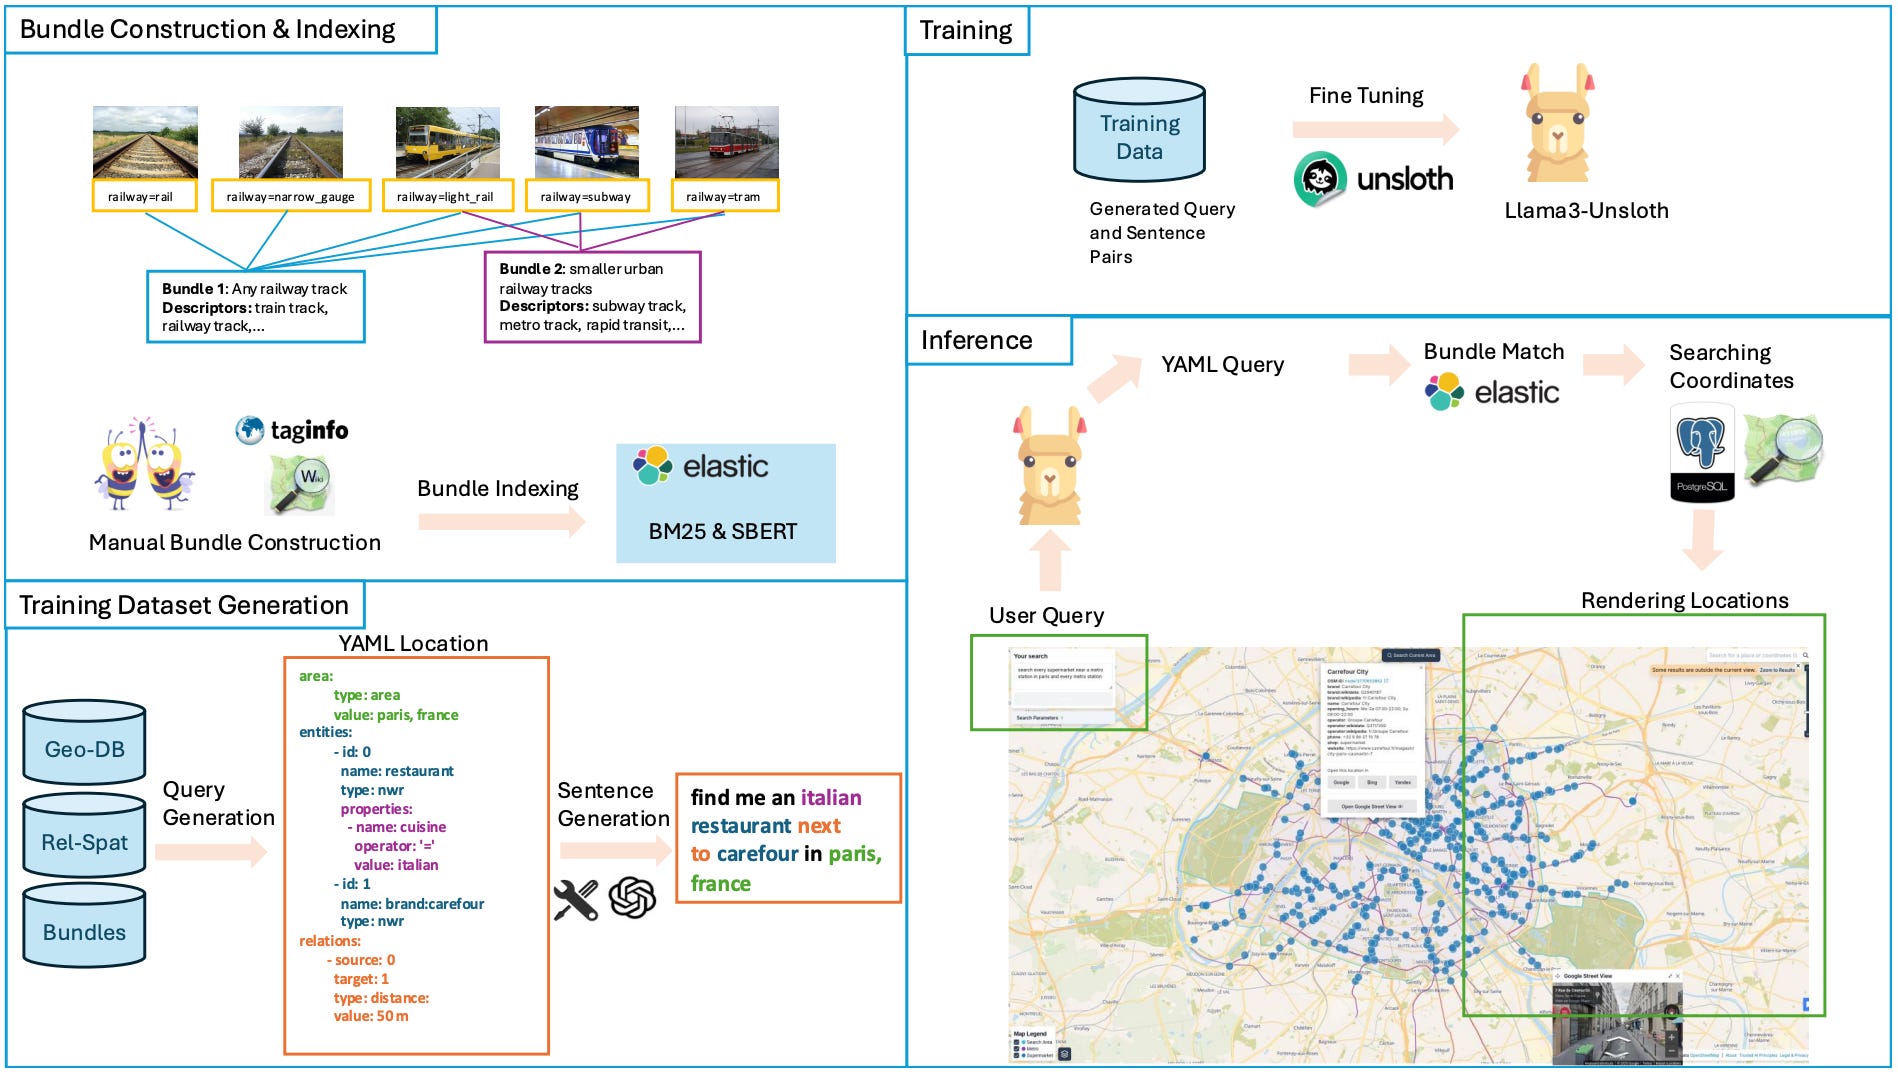
As someone who knows very little about the art of investigative journalism, I was surprised to hear that they use OpenStreetMap a lot to verify locations. But, as I’m sure many of you may know, querying its data can be painful. Overpass Turbo, the most common tool, requires technical knowledge of query languages, which leaves many non-specialists locked out. So to address this, a team at Deutsche Welle has created SPOT, an open-source system that lets users search OSM through plain-language scene descriptions, lowering the barrier for geolocation work.
SPOT works by fine-tuning LLaMA 3 with a synthetic training dataset that maps everyday descriptions into OSM’s tag-based system. User queries are first converted into YAML-based representations, then matched with bundles of OSM tags through semantic search. This allows the system to interpret varied inputs, including typos, synonyms, or different ways of describing the same feature. The results are shown interactively on a map, with further exploration possible through links to tools like Google Street View.
The researchers benchmarked SPOT against other models and tools, finding that it outperformed baselines like GPT-4o and mT5 in producing accurate, parsable queries. Importantly, it generated fewer hallucinations and handled linguistic variety better, from grammar mistakes to non-Roman alphabets. The code and models are fully open source.
You can try it at findthatspot.io and check the code on GitHub.
2. How the weather is affecting marriages
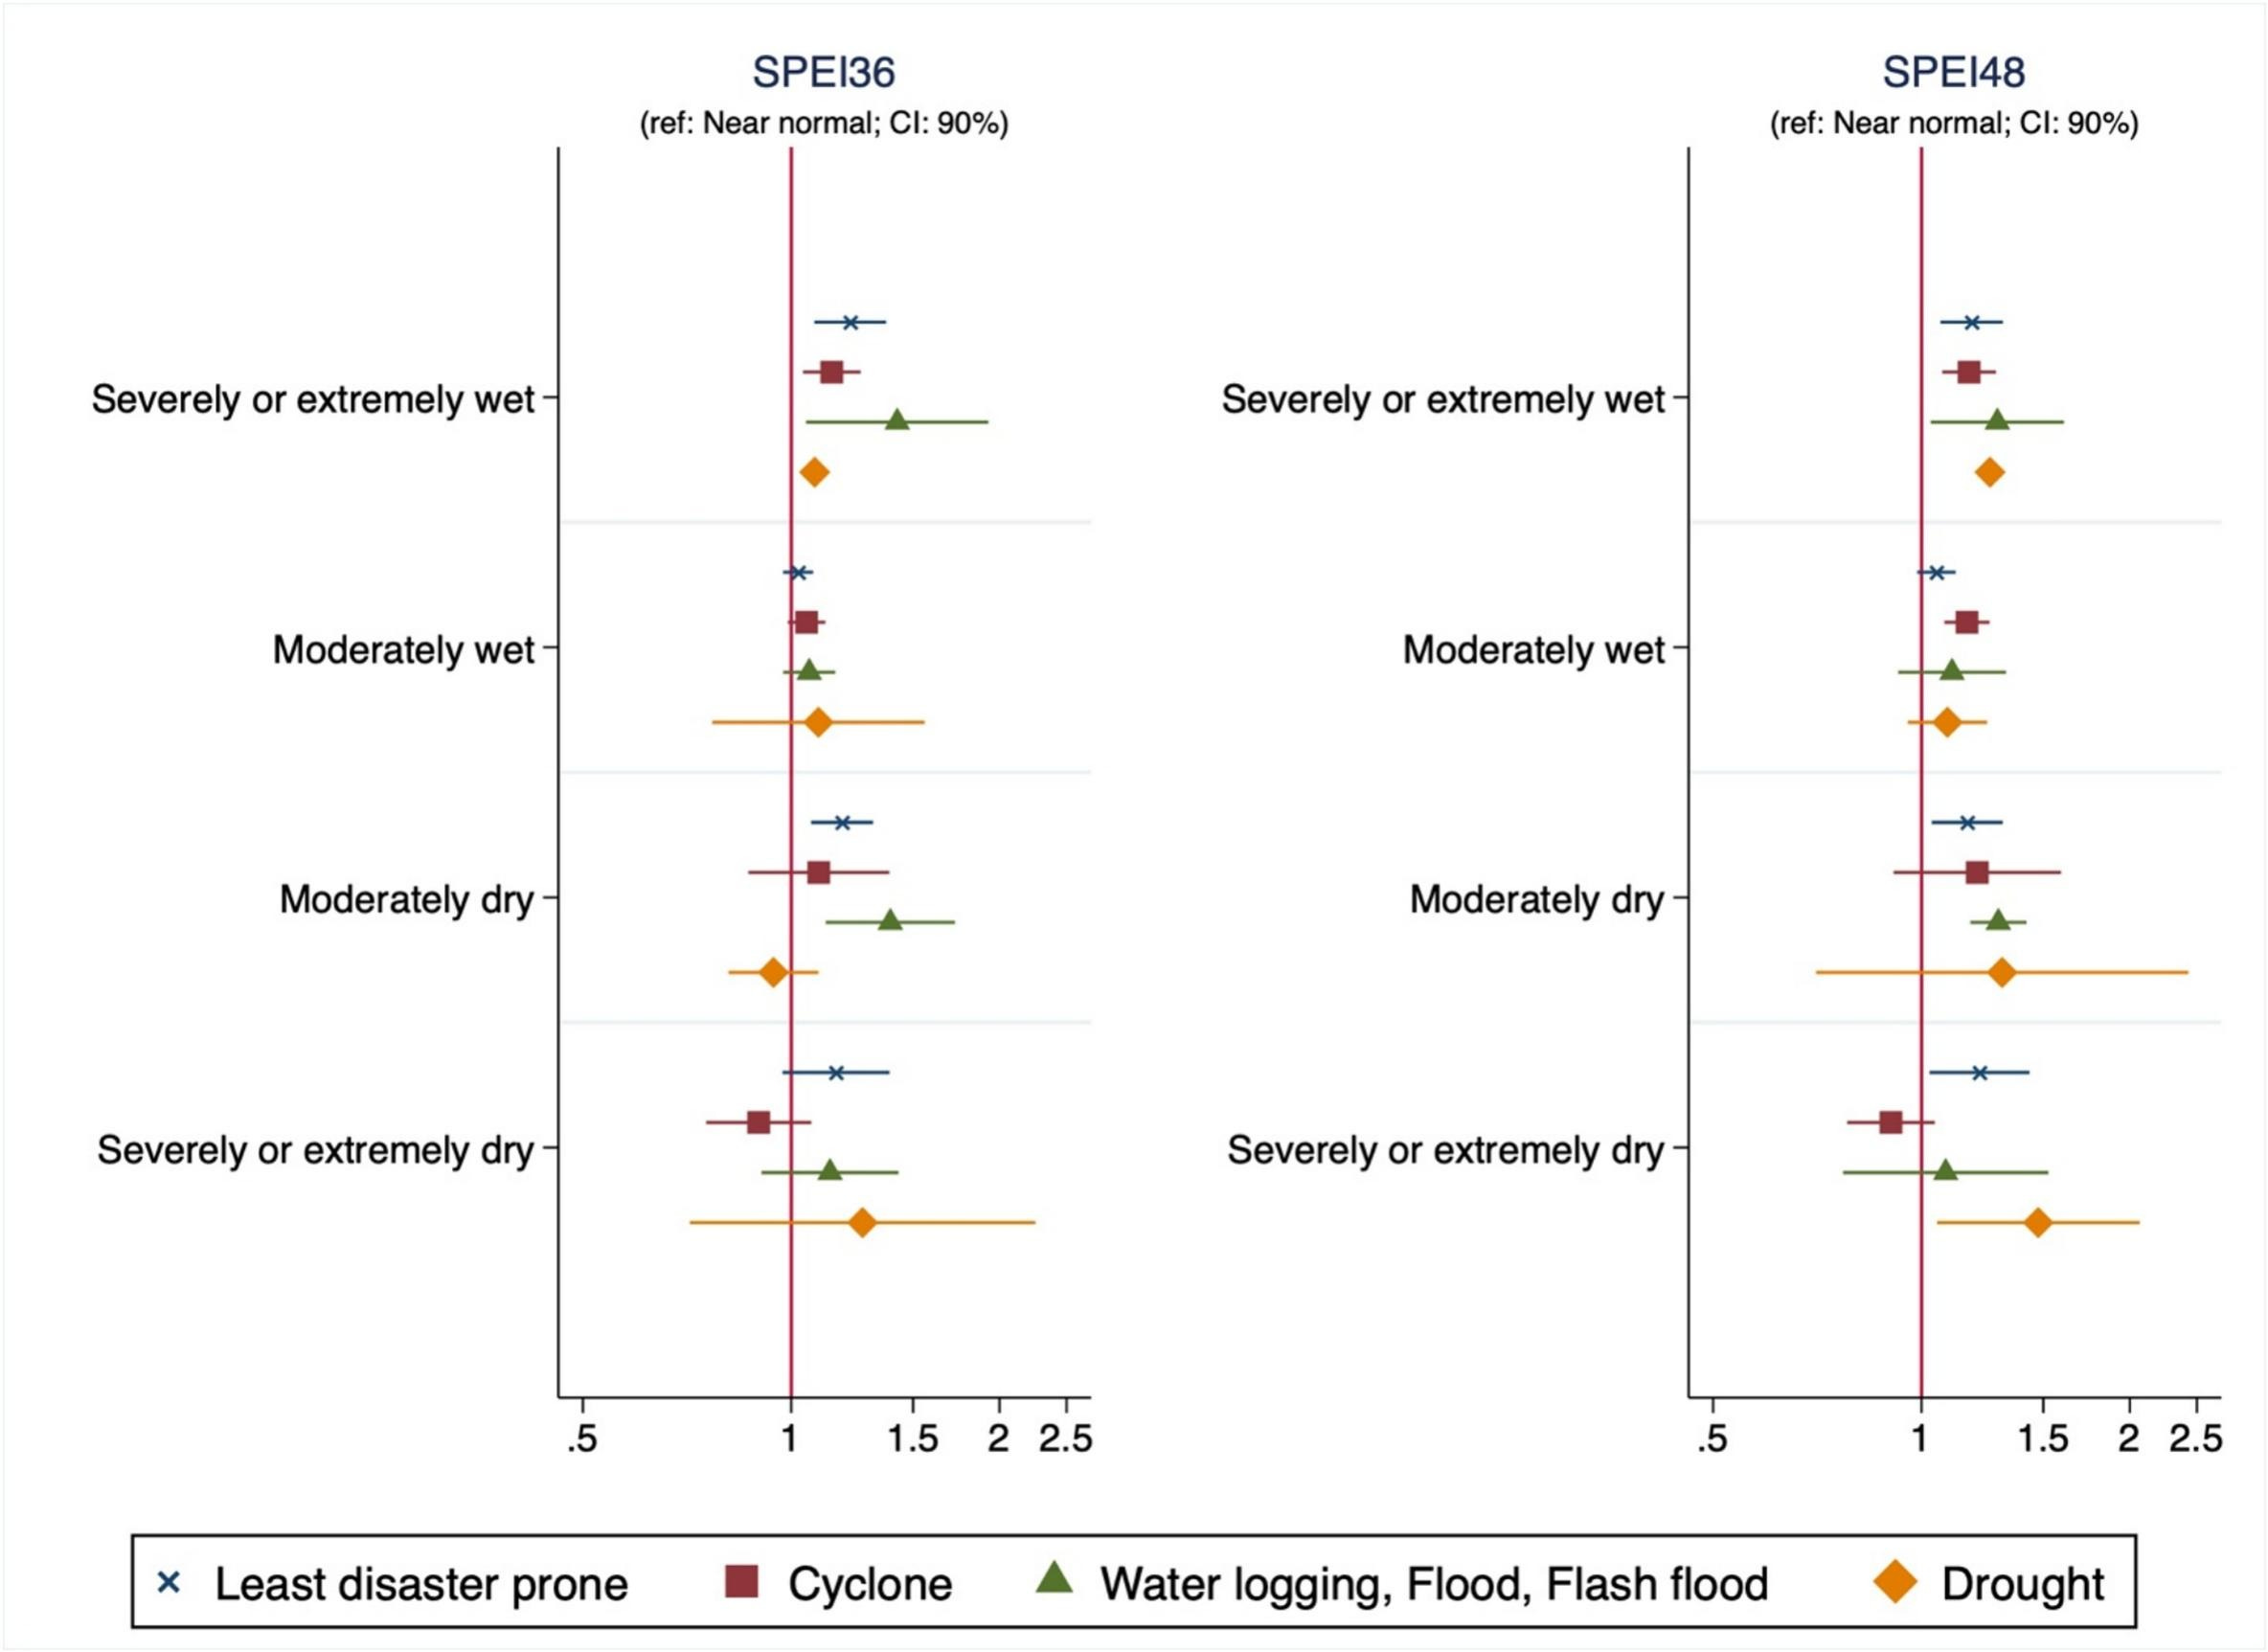
If you’ve wondered why you may still be single, then scientists have an answer to you - it’s that you’ve been experiencing normal weather. A new paper in World Development finds that long spells of unusual weather in Bangladesh (whether too dry or too wet) can push women into marriage sooner, including girls under 18. By combining 26 years of demographic data with climate indices tracking three to four years of conditions, the researchers show that prolonged drought or excess humidity consistently raises the odds of marriage. In rural areas, this pattern is strongest for minors, while in cities, extended drought also has a measurable impact.
The effect isn’t limited to places already known for climate disasters. Even in districts considered least disaster-prone, any sustained departure from normal weather seems to accelerate marriage timing. The study suggests that climate stress affects far more than agriculture, disrupting urban and rural livelihoods alike through property loss, economic slowdown, and food price shocks.
These shifts have deep social consequences. Marrying earlier, whether as a child or an adult, can cut short education, reduce economic opportunities, and reinforce gender inequality. The authors argue that policies need to account for the slow, grinding effects of climate change as well as sudden disasters, especially in contexts where early marriage is already common.
3. Global ocean productivity is falling

A new 25-year analysis of satellite ocean colour data shows that net primary production (NPP) is significantly declining across almost half of the global ocean. NPP is the rate at which phytoplankton (tiny plants floating in the sea) turn sunlight and nutrients into food. This process essentially powers the entire marine food chain and captures huge amounts of carbon from the atmosphere.
The steepest drops are in warm, stratified tropical and subtropical waters, while increases are mostly limited to cooler polar and subpolar regions. On average, NPP has fallen by 7.4% since 1997, a much sharper drop than climate models had projected for the entire century under high-emissions scenarios.
The main driver is a reduction in the fraction of light absorbed by phytoplankton, linked to stronger nutrient limitation as surface waters warm and mix less with nutrient-rich deeper layers. This shows up in ocean colour records as declining pigment absorption and slower phytoplankton growth rates, rather than big changes in biomass. Deep chlorophyll layers, which sit below the reach of satellites, now account for over 30% of global NPP, partly because clearer surface waters let more light reach depth.
Interannual changes in NPP are closely tied to sea surface temperature anomalies, with warming now the dominant global driver. These shifts have major implications for the marine carbon cycle, oxygen production, and fisheries, as reduced NPP at the base of the food web can ripple up through higher trophic levels.
You can access the code here.
4. Video compression for massive Earth system datasets
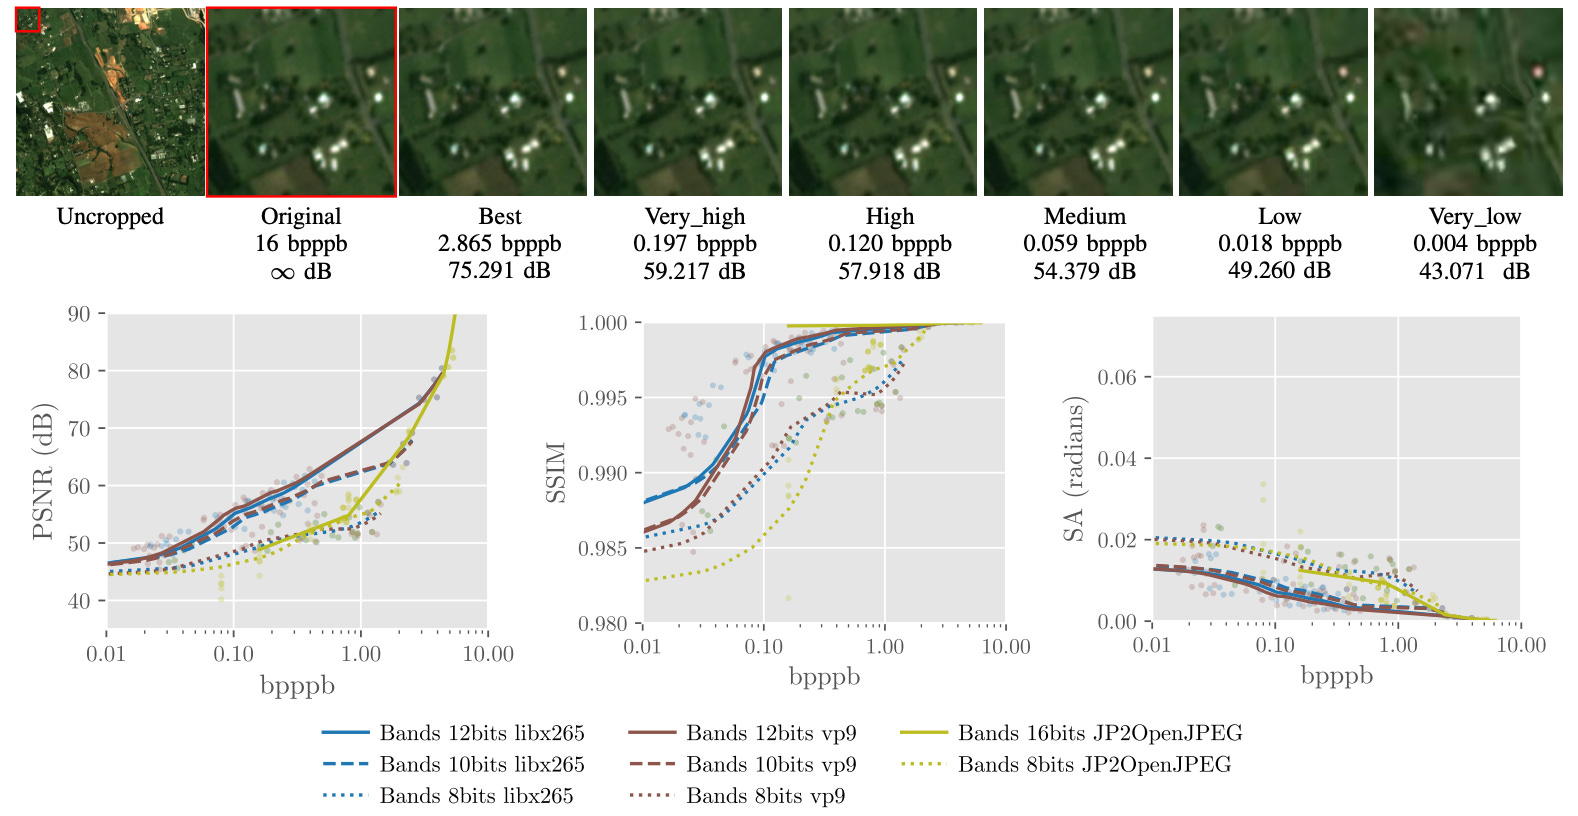
Earth observation and climate models churn out a crazy amount of spatiotemporal data (usually petabytes - the equivalent of 125 million Britney Spears songs 🎶). Storing and sharing this is costly and slow. A new study from the University of Valencia explores using modern video compression to shrink these datasets dramatically while keeping the most important information.
The approach treats time-evolving geospatial data as a sequence of images, then applies high-efficiency video codecs such as HEVC and AV1. The researchers tested this on large climate simulation outputs, comparing compression ratios, processing speeds, and impacts on downstream analysis. They found that video codecs can achieve compression ratios an order of magnitude higher than standard scientific data formats like NetCDF, while still preserving key patterns for visualisation and many analytical tasks.
There are trade-offs: video codecs can introduce subtle artefacts, and the method isn’t lossless, so it’s not suitable for every use case. But for many exploratory and visual applications, the space savings are huge and could open the door to faster, cheaper data access.
Geospatial Datasets
1. Tropical cyclone forecasting dataset

TropiCycloneNet is a new open benchmark for global tropical cyclone forecasting, pairing a 70-year, multi-modal dataset (TCND) with an AI-meteorology hybrid model (TCNM). You can access the data and code via GitHub and Zenodo.
2. Change detection dataset
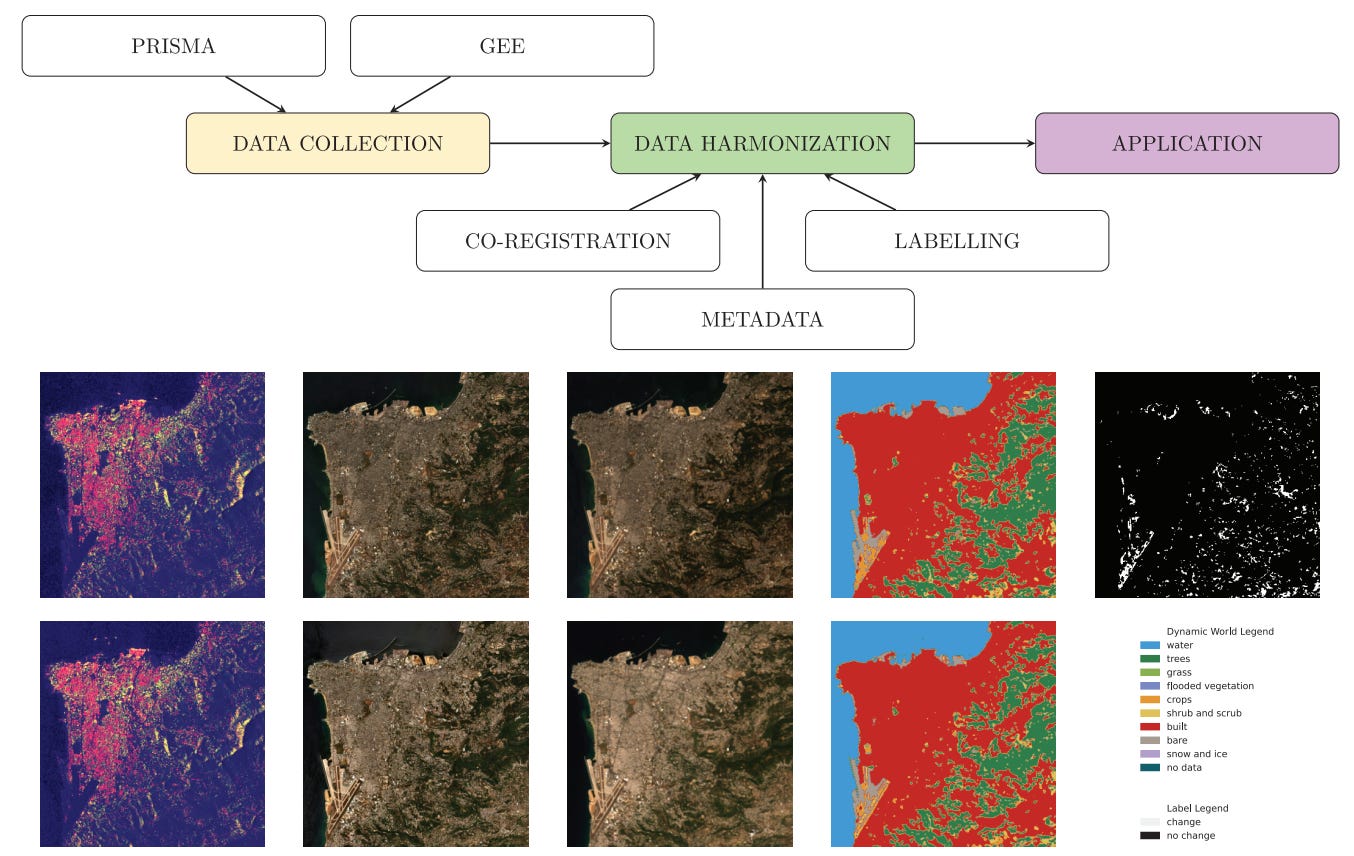
The MUlti-modal MUlti-class Change Detection (MUMUCD) dataset offers bitemporal satellite imagery for selected locations, combining hyperspectral data from PRISMA, multispectral data from Sentinel-2, and SAR magnitude data from Sentinel-1. You can access the data here.
3. Planet’s Tanager satellite images
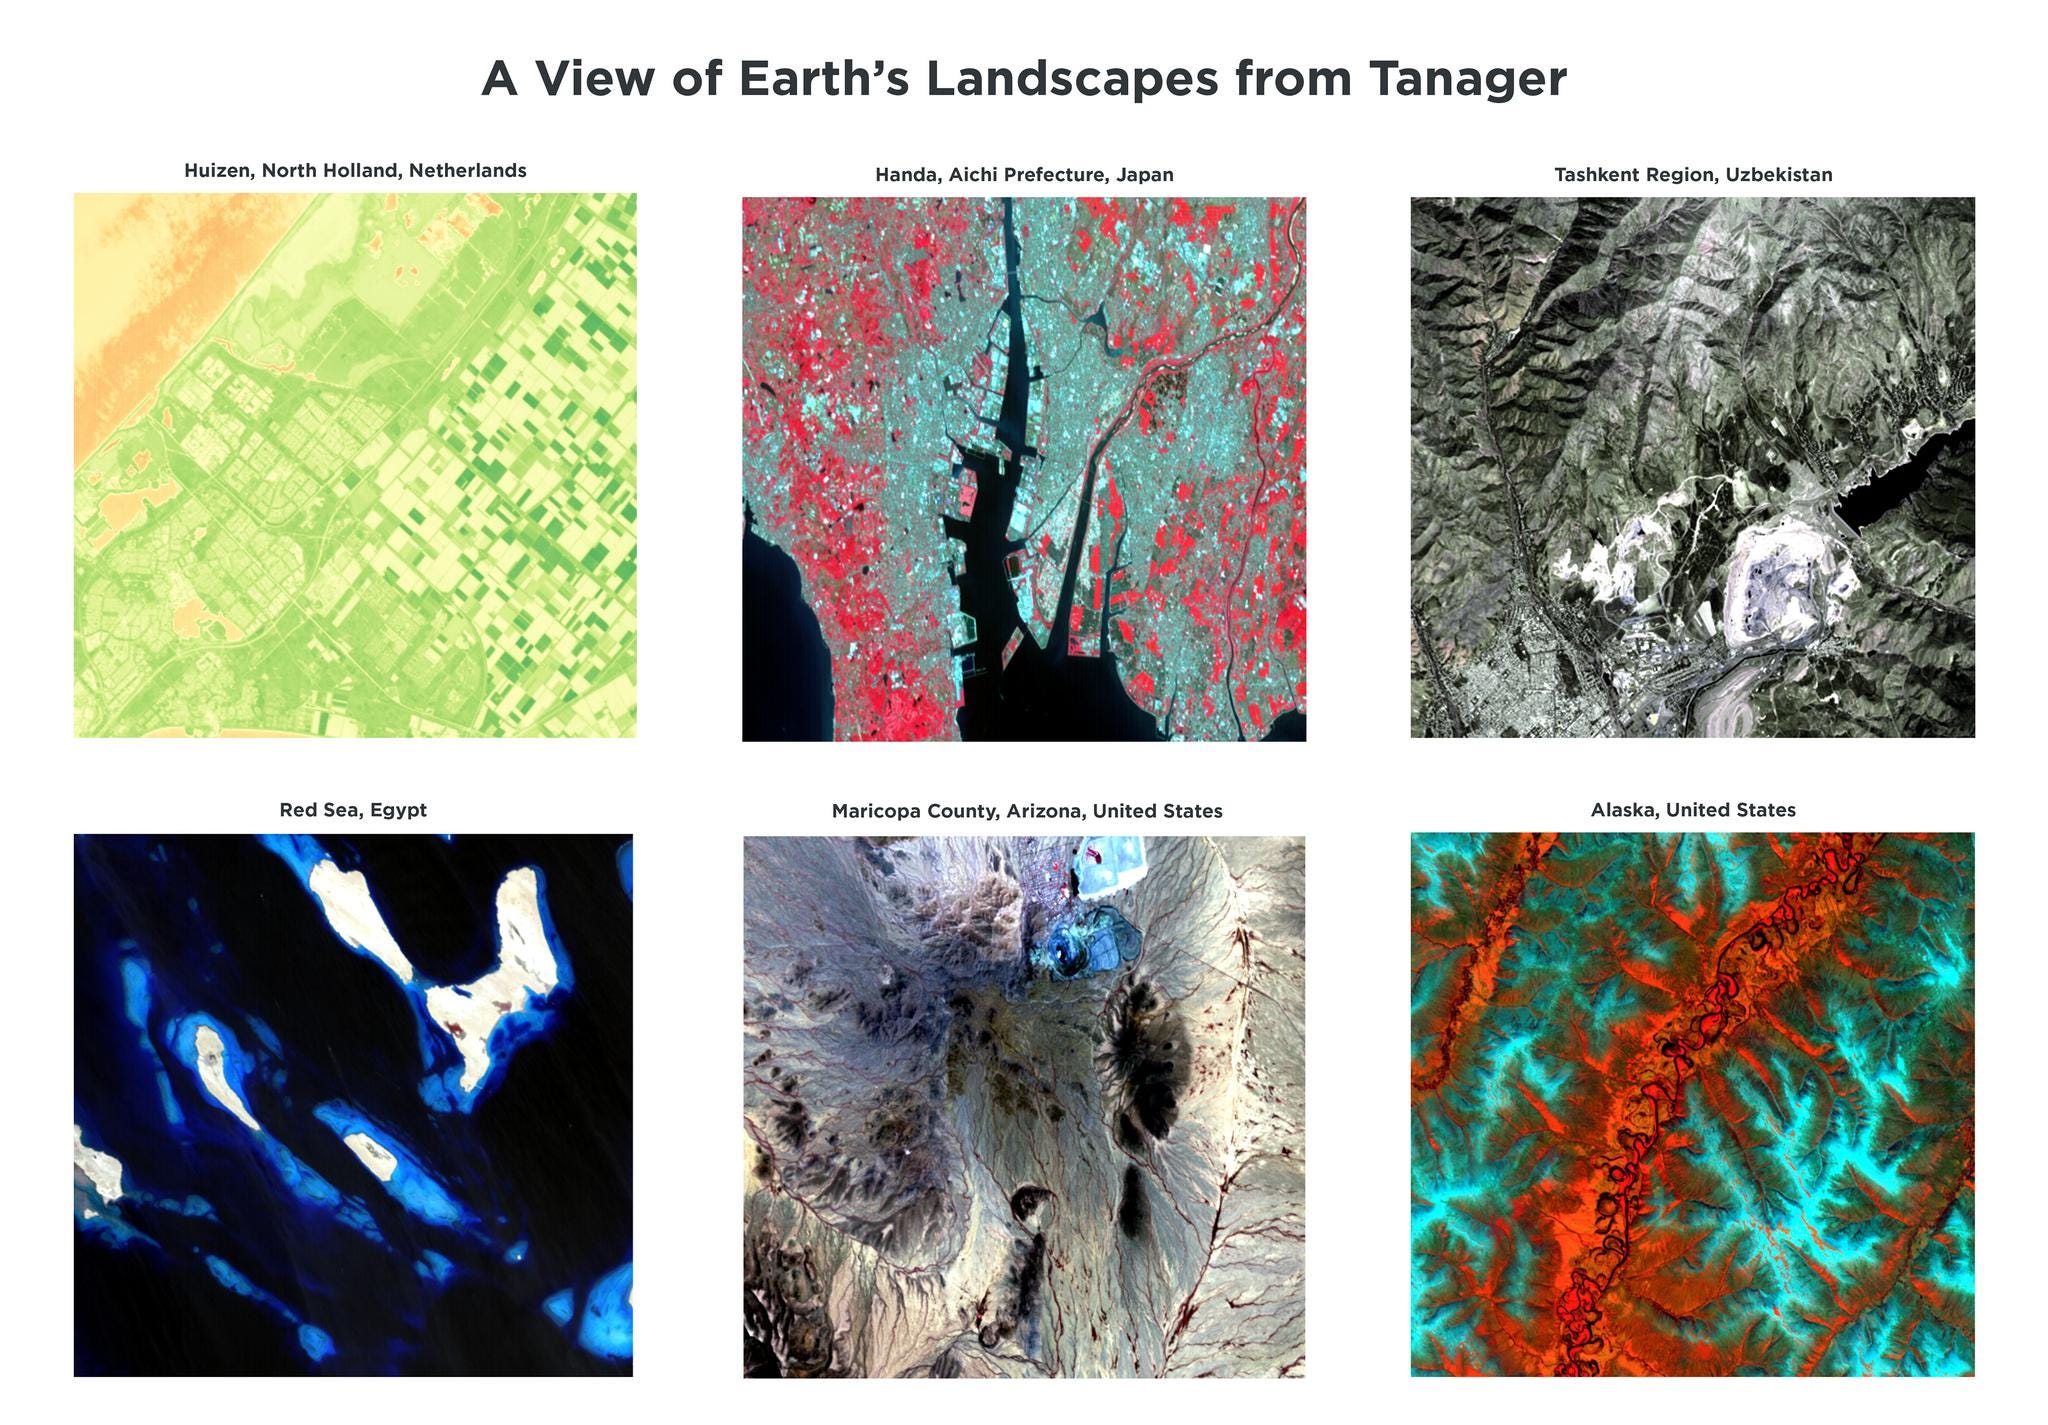
The Tanager Core Imagery collection provides open hyperspectral data from Planet’s Tanager-1 satellite, covering the visible to shortwave infrared range (380–2500 nm) at ~5 nm resolution. The first 50+ scenes are available under a CC BY 4.0 licence on the Planet Open Data STAC. You can access the collection here.
Other useful bits
")
Satellite imagery has revealed a sharp rise in rare earth mining in rebel-held Shan state, Myanmar, with 28 sites identified, including two new mines near Thailand’s border. Researchers and Thai authorities link the operations to toxic heavy metal pollution in rivers like the Kok and Mekong, threatening health, crops, and livestock downstream.
Astronomers from the University of Warwick and Spanish partners have developed Astroclimes, an algorithm that uses starlight to measure greenhouse gases at night. By analysing “telluric lines” in light passing through Earth’s atmosphere, the system can track carbon dioxide, methane and water vapour, complementing daytime solar-based measurements and helping improve climate change monitoring.
The Philippine Space Agency will launch MULA: the country’s most advanced Earth observation satellite. Built mainly by Filipino engineers, MULA’s high-res multispectral camera will support agriculture, disaster response, coastal monitoring and urban planning, marking a major step in the nation’s space capability.
The US Space Command is moving towards satellite-on-satellite combat, demonstrating joint manoeuvres with France to indicate its ability to operate near other countries’ satellites. Plans include AI-enabled satellites, in-orbit refuelling, and vast low-Earth orbit constellations to bolster space warfare capabilities.
Jobs
UNEP is looking for a CCAC National Expert in Silvo-pastoral Systems and Spatial Analysis based in Paris.
Mercy Corps is looking for a Geospatial Analytics and Mapping Intern based in the US.
Mapbox is looking for a (1) Machine Learning Engineer III for Routing Cost based in Germany and a (2) Machine Learning Engineer II for Navigation API based in the UK.
Just for Fun

NASA’s Hubble Space Telescope has captured the sharpest image yet of 3I/ATLAS, an interstellar comet speeding through our solar system at 130,000 mph.
That’s it for this week.
I’m always keen to hear from you, so please let me know if you have:
new geospatial datasets
newly published papers
geospatial job opportunities
and I’ll do my best to showcase them here.
Yohan