

🌐 How 180 firms shaped today’s heatwaves
PLUS: Where shared rivers are most likely to spark conflict, mapping the hidden value of urban voids and more.

Hey guys, here’s this week’s edition of the Spatial Edge — a newsletter designed for people who know what ggplot2 is. In any case, the aim is to make you a better geospatial data scientist in less than five minutes a week.
In today’s newsletter:
Heatwaves and Carbon: Linking 180 firms to extreme events.
River Conflicts: Monthly scarcity predicts flashpoints across basins.
Urban Voids: Mapping leftover land for social potential.
Vulnerability Projections: Country-level socioeconomic risk data to 2100.
Weather Dataset: U.S. infrastructure-critical extremes at high resolution.
Research you should know about
1. Tracing heatwaves back to fossil fuel firms

Carbon warming has made every one of 213 major heatwaves between 2000 and 2023 both hotter and more likely, and roughly half of that extra heat is traceable to the emissions of 180 named fossil fuel and cement producers. With this context in mind, a new Nature study has systematically traced the fingerprints of human-induced climate change across these heatwaves. The analysis shows that global warming made every single event both more likely and more intense. In the early 2000s, such heatwaves were about 20 times more likely than in preindustrial times. By the 2010s, they were about 200 times more likely. Roughly one in four of these events would have been virtually impossible without climate change.
Across events, intensification since preindustrial times spans about 0.3 to 2.9 °C, with medians rising from 1.4 °C in the 2000s to 1.7 °C in the 2010s and 2.2 °C in 2020–2023. Odds have exploded too, with a quarter of heatwaves effectively impossible in a preindustrial climate. By 2023, global mean temperature had increased about 1.30 °C relative to 1850–1900, of which around 0.67 °C is linked to these 180 “carbon majors” and 0.33 °C to the top 14 alone. Individually, the largest emitter enabled 53 of the heatwaves that would otherwise have been near impossible, while even the smallest listed firm still enabled 16.
The largest emitters they discuss include:
The former Soviet Union
Suadi Aramco
Gazprom
ExxonMobil
Chevron
National Iranian Oil Company
The team systematised event attribution for all EM-DAT heatwaves using the reported footprints and dates, then modelled each event’s intensity with a non-stationary GEV whose location depends on global mean temperature. They trained on ERA5 and Berkeley Earth, pulled in vetted CMIP6 models, bootstrapped uncertainty, and required both good statistical fit and non-linear Granger causality. To link companies to events, they reconstructed each firm’s CO₂ and CH₄ since the 1850s from the Carbon Majors dataset, ran the OSCAR Earth-system model to get each firm’s contribution to global warming, then decomposed each heatwave’s probability and intensity change using a combined remove-one and add-one approach that copes with non-linearity.
There are caveats. EM-DAT under-reports heatwaves in Africa and Latin America, aerosol cooling from fossil use is not allocated to firms and would shave about 10 percent off attributed warming, and the study attributes physical hazard rather than mortality or economic losses. Even with those limits, the pattern is clear. Heatwaves are getting more extreme, small producers still matter a lot, and there is now a defensible quantitative chain from company emissions to the likelihood and severity of specific events that people actually experienced.
You can access the code here.
2. Where shared rivers are most likely to spark conflict

Transboundary river basins supply around 60% of global water resources, yet upstream and downstream countries often compete for how this water is used. A new Nature Communications study builds a framework to link monthly water scarcity with the likelihood of conflict. Testing it against data from 2005–2014, the model explained over 80% of recorded water scarcity-related disputes. These included familiar flashpoints like the Nile, Indus and Rio Grande basins, where both cooperation and conflict have long coexisted.
The framework distinguishes two main pathways to conflict:
Type I occurs when downstream regions push to secure greater usage rights from upstream flows, often by challenging existing treaties.
Type II arises when upstream regions retain more water, for example through diversion or storage, which reduces downstream supply.
Historical records suggest Type I disputes dominate, meaning rising downstream demand is the main trigger. Interestingly, the study shows that water scarcity measured at the monthly scale provides far clearer signals of conflict risk than annual averages.
Projections indicate that, without action, nearly 40% of the world’s transboundary basins could face scarcity-driven conflict by mid-century, particularly in Africa, South Asia, Central Asia and the Middle East. The population exposed could reach over 2 billion. Yet the study also finds that cooperation makes a massive difference: effective intra-basin agreements and coordinated management could reduce the share of vulnerable basins to under 10%. Other measures such as expanding rainfed crops or desalination can help, but basin-wide cooperation stands out as the most effective safeguard.
3. Mapping the hidden value of urban voids
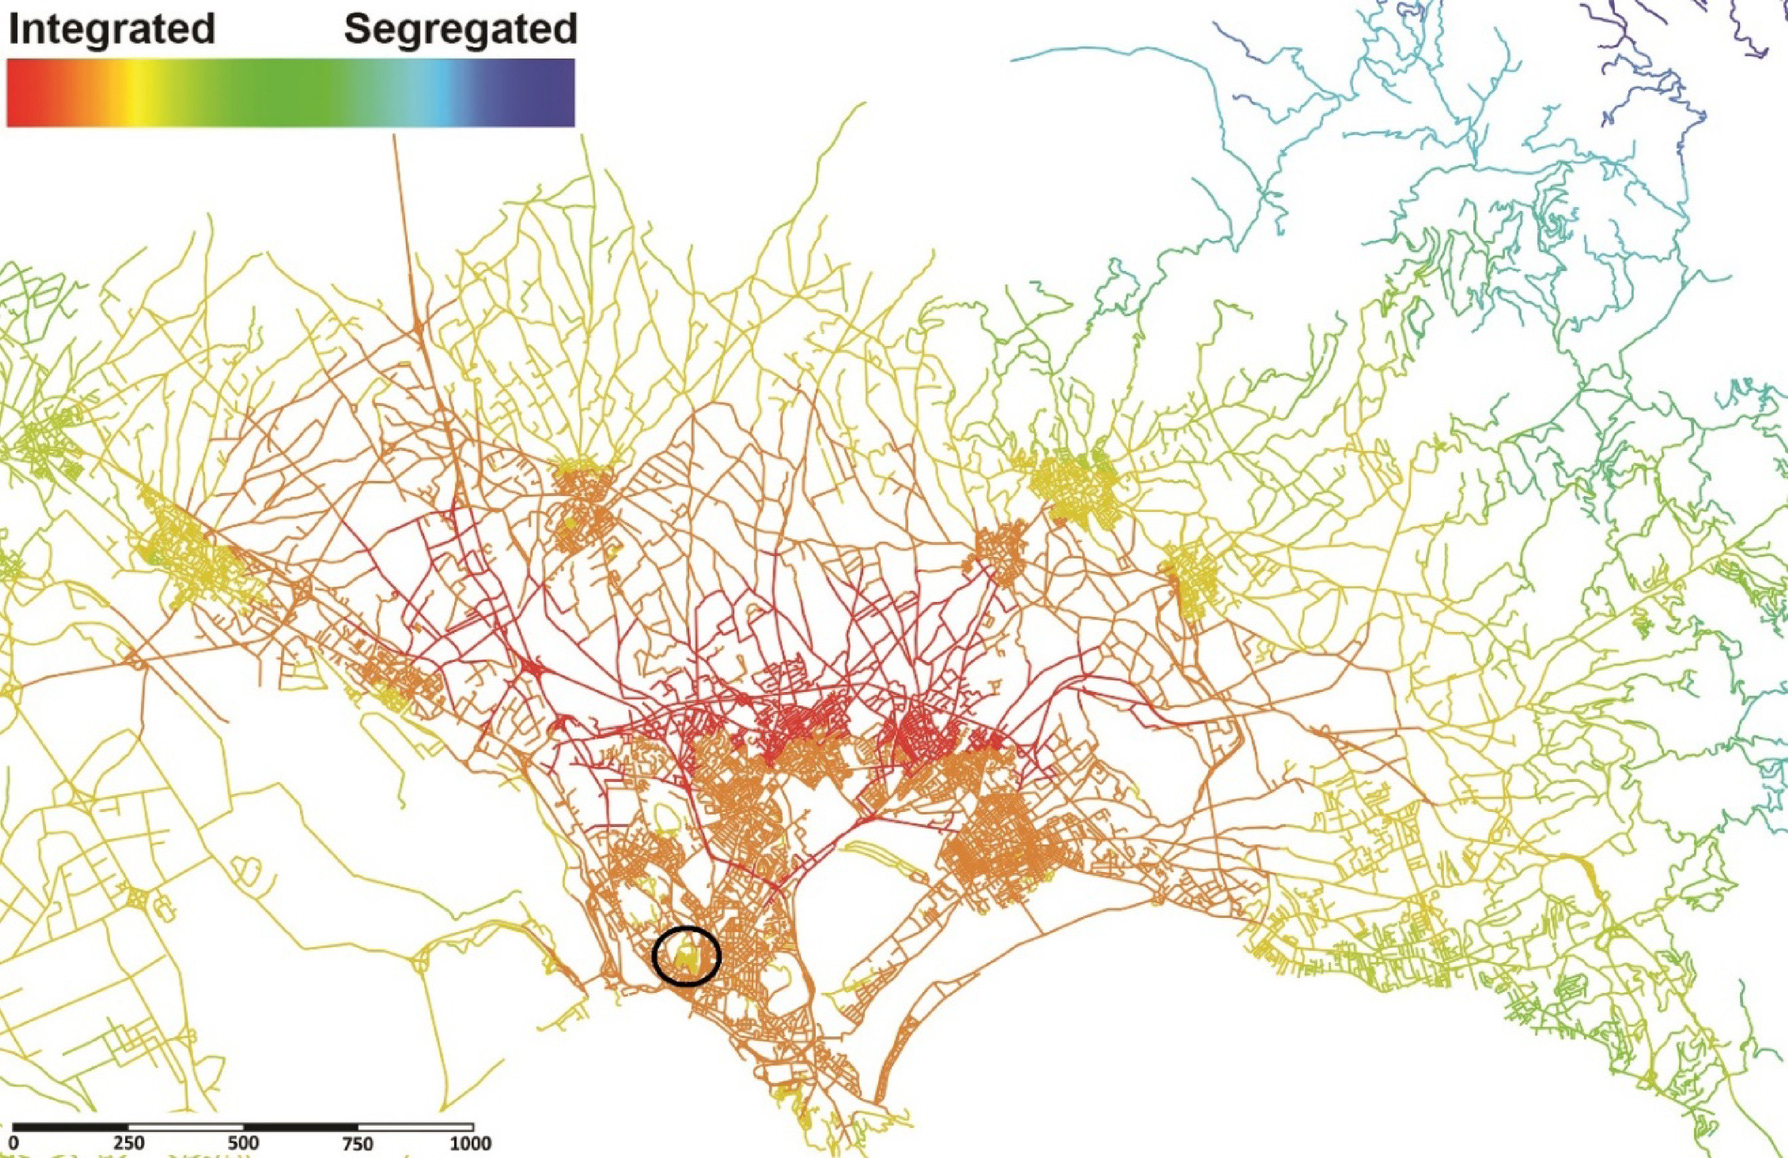
If you’ve ever been to a city (which I reckon might be some of you), you’ll know that they are full of small, underused bits of land. E.g. widened alleys, random corners, empty lots, etc.. These “residual spaces” often get ignored in planning, yet they can be pretty interesting spaces for improving everyday life. A new study in Scientific Reports looks at how these neglected fragments could be transformed into lively social hubs.
The researchers combined geospatial analysis with fieldwork in Cagliari, Italy. Using stuff like Space Syntax and GIS, they mapped which areas were well-positioned to attract pedestrian activity. They then added qualitative assessments of things like visibility, greenery, and aesthetic appeal. This produced a ranked list of sites that balance strong spatial integration with clear potential for social interaction.
Places such as Piazza Palazzo, Piazza Carlo Alberto, and Bastione di Saint Remy emerged as prime candidates. Each has high integration, connectivity, control and clustering and strong visual connections, yet remains underutilised due to limited design features or programming. The proposed framework is supposed to be replicable: it links data-driven spatial analysis with on-the-ground observation, giving cities a practical way to unlock the social potential of their leftover spaces.
Geospatial Datasets
1. GDL Vulnerability Index projections database

The GVI Projections Database (2020–2100) provides country-level projections of socioeconomic vulnerability under three Shared Socioeconomic Pathways (SSP1–3). It combines ten key indicators across economy, education, health, gender, governance, demographics, and infrastructure, providing a people-centred view of climate risk. You can access the data and code here.
2. Unified infrastructure-critical weather dataset

This new dataset provides daily and sub-daily records of extreme weather variables critical for infrastructure risk analysis, including wind gusts, freezing rain, lightning, snowfall, and wildfire metrics. It spans the entire U.S. from 1979 to 2100 at 0.25° resolution. You can access the data here and the code here.
3. Satellite detection and precipitation estimation benchmark dataset
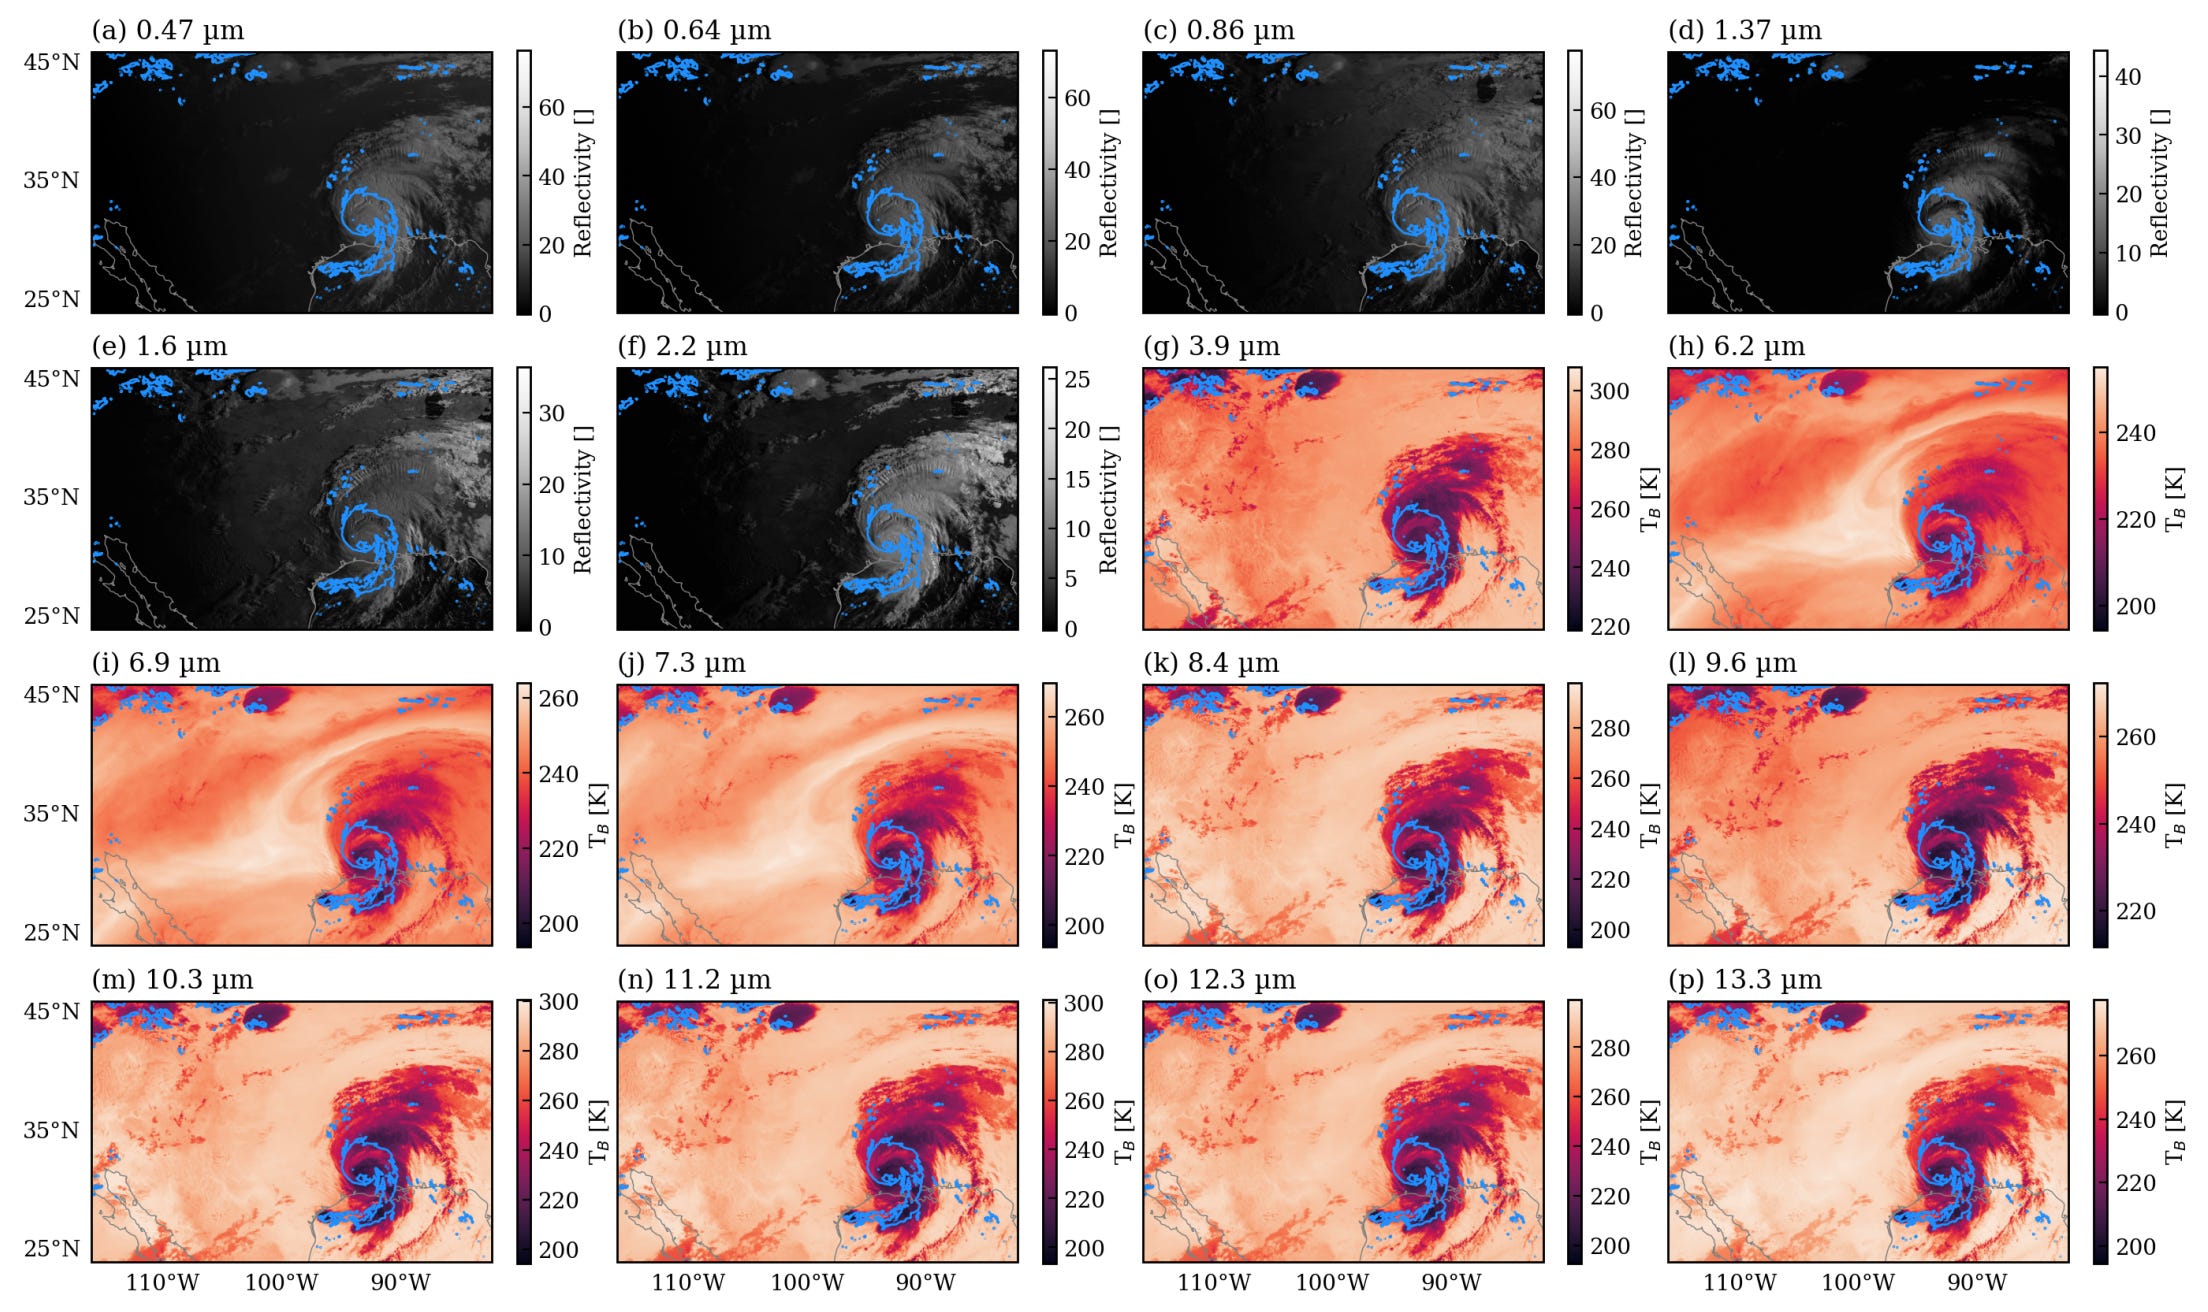
SatRain is the first AI-ready benchmark dataset for satellite-based detection and estimation of precipitation, developed by the International Precipitation Working Group. It brings together multi-sensor satellite observations (microwave, visible, infrared) with high-quality ground radar and rain gauge references, covering rain, snow, graupel, and hail. You can find the data here and the code here.
4. Oil palm mapping benchmark dataset
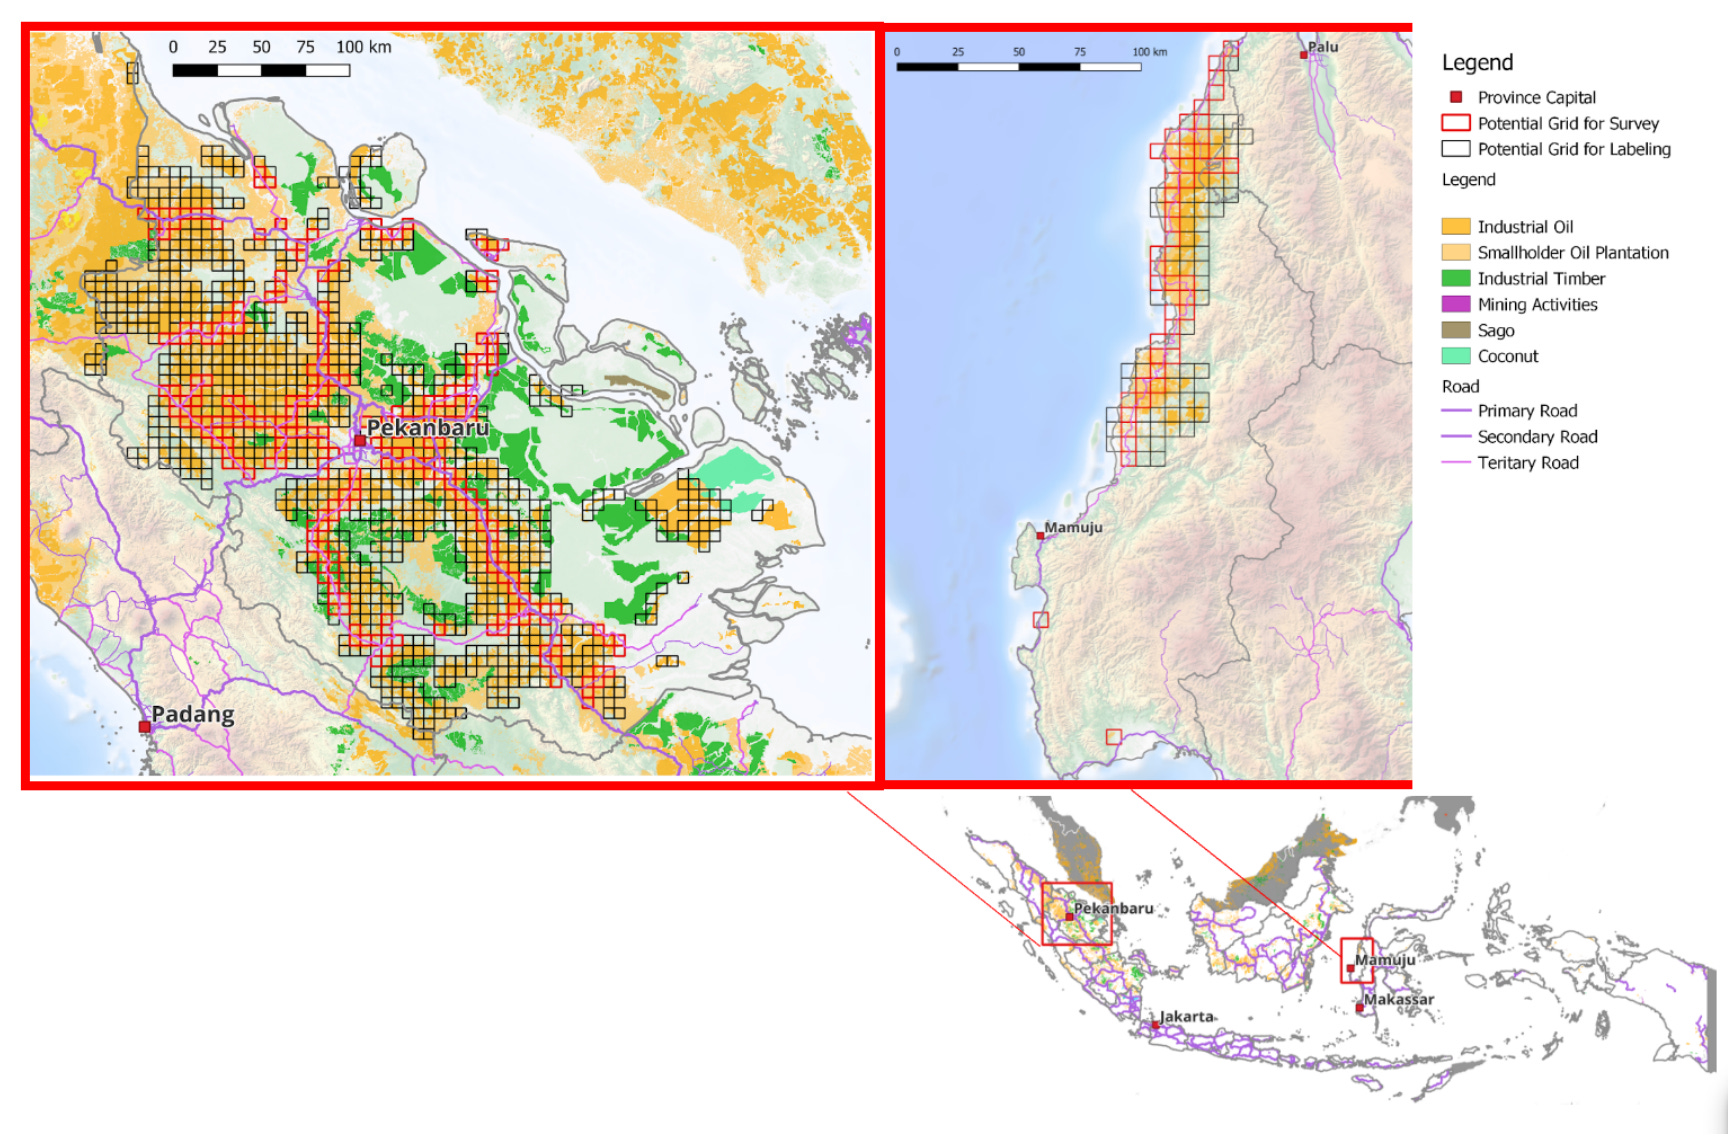
A new open-access dataset provides wall-to-wall, polygon-based annotations of oil palm plantations and related land cover types across Indonesia. It captures planting stages and similar perennial crops, with quality ensured through expert labelling, multi-annotator checks, and field validation. You can access the data and code here.
Other useful bits
Climate TRACE has launched an interactive map that shows air pollution plumes and their sources across 2,500 cities worldwide. The tool reveals how “super polluters” expose nearly a billion people to hazardous air and makes the full emissions data freely available here.
Philippine local government units are adopting REDAS with 3D mapping to simulate earthquakes and tsunamis, boosting disaster preparedness in hazard-prone areas. The tool helps identify high-risk zones, plan evacuations, and produce accurate hazard maps to guide safer infrastructure and early warning systems.
Amazon’s Project Kuiper is starting to win customers, with JetBlue set to use its satellite WiFi from 2027, but it still trails far behind SpaceX’s dominant Starlink. With over 70,000 LEO satellites planned globally by 2031, the race to connect the unconnected is heating up.
ESA’s GDA Impact Dashboard has a new look, making it easier to track projects, case studies, and country collaborations. You can also follow project life cycles and see how Earth Observation is driving real-world impact.
Jobs
ISW is accepting applications for its Geospatial Intelligence and National Security Technologies Internship based in Washington.
The UN Office for Outer Space Affairs is looking for an Earth Observation Intern for Water Management based in Vienna.
The UN Economic and Social Commission for Western Asia is looking for a remote Consultant in Geospatial Groundwater Analysis.
Just for Fun

An amazing image of lightning over a volcano.
That’s it for this week.
I’m always keen to hear from you, so please let me know if you have:
new geospatial datasets
newly published papers
geospatial job opportunities
and I’ll do my best to showcase them here.
Yohan