

🌐 How exposed are we to toxic metal pollution?
PLUS: using geospatial data to select power plant locations, new open-source geospatial tools from Microsoft, and more.


Hey guys, here’s this week’s edition of the Spatial Edge — a weekly round-up of geospatial news. The aim is to make you a better geospatial data scientist in less than five minutes a week. And if your pet dog is called ‘Sinusoidal’, then we have one thing to say to you: welcome home.
In today’s newsletter:
Toxic Metals: Mapping global soil contamination hotspots.
Power Plants: Geospatial data for site selection.
Electricity Access: Assessing the quality of informal grid connections.
Urban Spaces: Global map of open spaces in megacities.
Image Segmentation: Microsoft toolkit for better training data.
Research you should know about
1. Mapping exposure to toxic metal pollution in soil

A new study published in Science presents the first high-resolution global map of toxic metal pollution in soil, revealing that 14–17% of cropland worldwide exceeds safety thresholds for at least one toxic metal. This is the first globally consistent picture of toxic‑metal hotspots and the people who live on them.
The researchers compiled over 796,000 soil samples from 1,493 studies across the world. They focused on seven metals:
arsenic
cadmium
cobalt
chromium
copper
nickel
Lead
Using a machine learning method called Extremely Randomised Trees (ERT), they predicted areas likely to exceed agricultural and human health safety thresholds. These predictions were based on a mix of climatic, geological, topographic, soil texture, and socioeconomic data, and then validated with independent datasets.
The results show that cadmium poses the greatest risk, particularly in parts of South Asia, southern China, and the Middle East. In total, between 0.9 to 1.4 billion people were found to live in areas exposed to high-levels of toxic metals. This is nuts…
Additionally, 16% of global cropland was found to be contaminated by toxic metals.

They also identified, for the first time, a “metal-enriched corridor” which stretches across low-latitude Eurasia.
The study’s maps provide a pretty important screening tool to prioritise soil surveys and inform policy on soil remediation. Scarily for me, the authors suggest that contamination will get worse as global demand grows for critical metals used in green technologies.
2. Using geospatial data to select power plant locations

A new study published in Scientific Data presents a new dataset called GRIDCERF, designed to support power plant site selection. The dataset is focussed on China. As China pushes to decarbonise its energy system, high-resolution, technology-specific land suitability data is pretty important for avoiding conflicts with protected areas, farmland, and other land uses during the expansion of solar, wind, and other generation technologies.
To build this dataset, the team compiled over 20 geospatial datasets covering:
topography
land cover
population density
resource availability (like wind speed and solar irradiation)
infrastructure (like airports and railways).
They harmonised these inputs into 1 km × 1 km raster layers. For each of the seven generation technologies (coal, gas, biomass, nuclear, solar PV, CSP, and onshore wind), they created suitability maps by combining relevant constraints. The final dataset is stored in GeoTIFF format and designed for direct use in integrated assessment and power system models.
The team validated GRIDCERF using the Global Integrated Power Tracker. Over 90% of existing non-renewable, solar, and wind power plants that violated the suitability rules were found to be within 5 km of a suitable grid cell.
The code is available on Github.
3. Examining the quality of informal electricity access
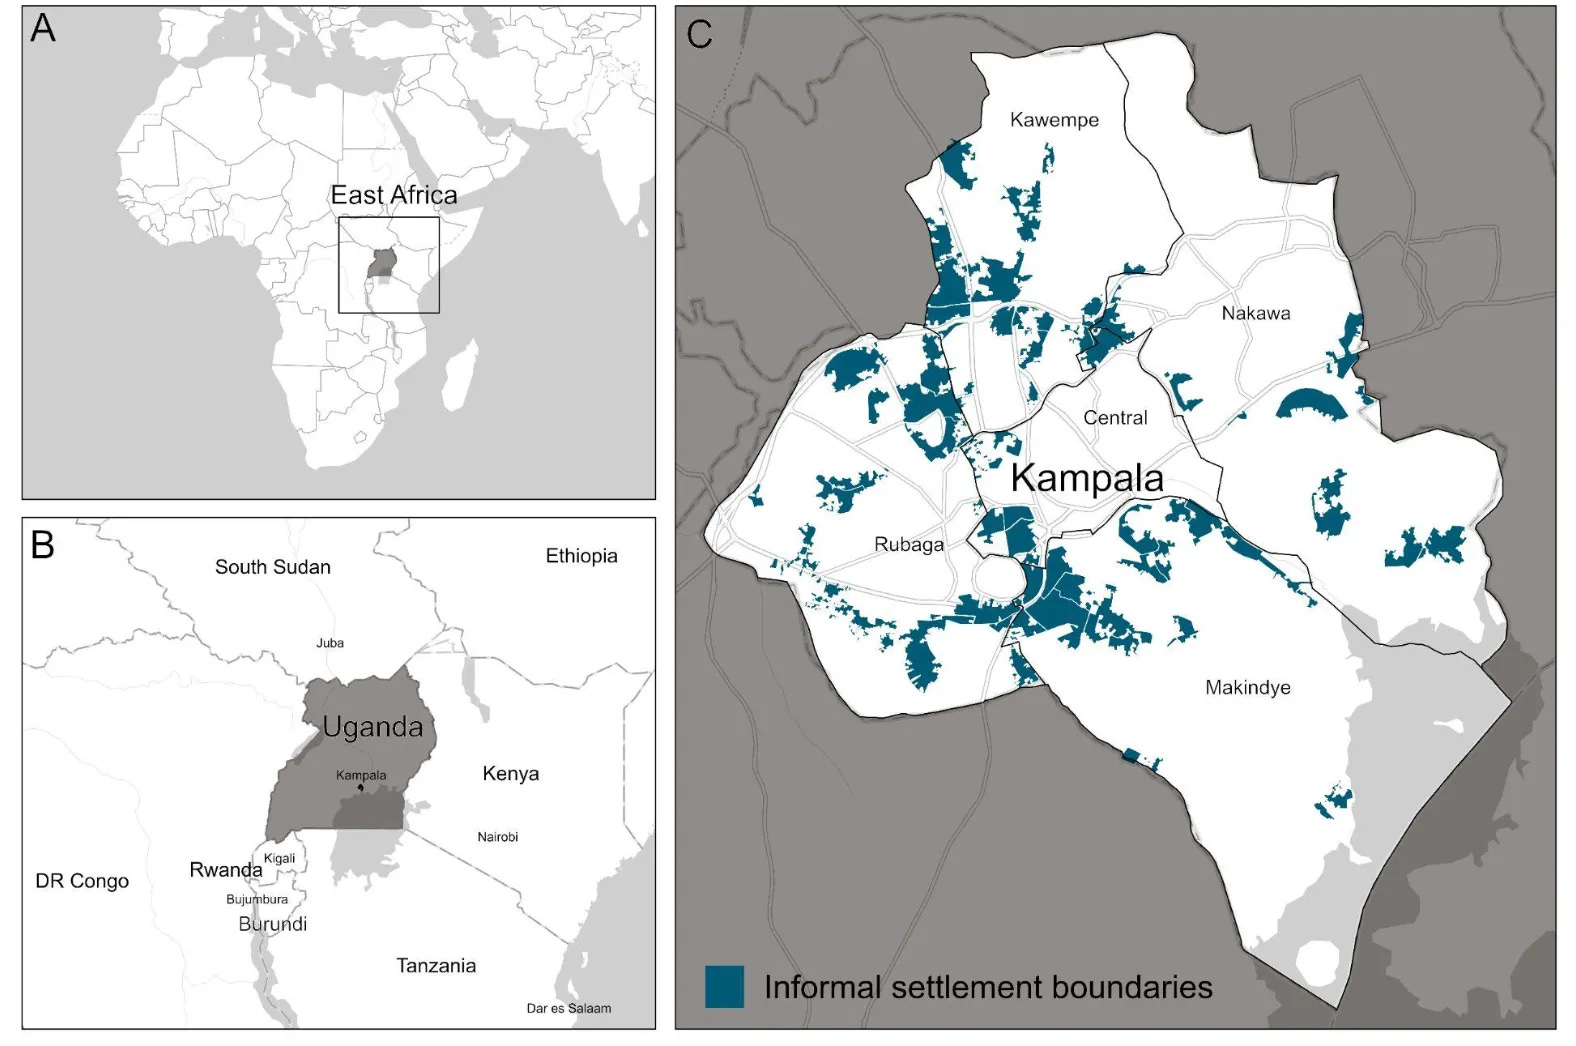
A new study published in Nature Cities examines how electricity access in African cities is shaped by informal arrangements. Focusing on Kampala, Uganda, the researchers show that many urban residents in informal settlements rely on non-standard grid connections managed by local intermediaries rather than direct utility access. These arrangements complicate traditional measures of electricity access and expose widespread inequalities.
The team used a mix of:
surveys (500 households and businesses)
interviews (66 stakeholders), and
remote voltage monitoring (146 sites)
to capture the diversity and quality of grid access across 25 informal settlements.
They identified 29 distinct service arrangements involving different combinations of payment methods and connection types. While 70% of users had prepaid meters, most shared these with others. Informal providers, such as local electricians, were often used to bypass formal connection processes due to high upfront costs and rental constraints.
The study found that informal connections delivered lower quality electricity, with users on unmetered networks experiencing the most frequent outages (roughly 12 hours per week) and poorest voltage stability. Even users with formal individual meters averaged 3.5 hours of weekly outages. Importantly, nearly all users made regular payments for electricity, but often to landlords or neighbours rather than the utility.
Anyway, a key takeaway here is that electricity access metrics, like the World Bank’s Multi-Tier Framework, may significantly overstate true access. The authors recommend that policymakers recognise and build on existing informal practices (such as shared metering) to improve affordability and safety, rather than focusing only on formalisation.
The code and data is available at Harvard Dataverse
Geospatial Datasets
1. OpenspaceGlobal urban open space dataset

OpenspaceGlobal is the first high-resolution map of urban open space (UOS) for 169 global megacities, built from 8.5TB of satellite imagery and crowdsourced geospatial data. The team mapped five categories (parks, sports areas, roads, water bodies, and background) at 1.19 m resolution. You can access the data here and the code here.
2. FAO global administrative unit layers data

FAO has released the 2024 edition of the Global Administrative Unit Layers (GAUL) dataset, covering level 1 and 2 sub-national boundaries. If you’re interested in annual changes to administrative boundaries, this is the go-to dataset. You can access the level 1 data here and the level 2 data here.
3. EuroCropsML crop type dataset

EuroCropsML is a new benchmark dataset for few-shot crop type classification in Europe. It contains 706,683 labelled agricultural parcels across 176 crop classes, using Sentinel-2 satellite imagery time series from 2021. You can access the data here and the code here.
Other useful bits

Google’s new Geospatial Reasoning framework combines generative AI with foundation models to fast-track insights from satellite and geospatial data. This can be used to map buildings, detect damage, and even find “residential buildings with solar panels” using natural language.
Microsoft released MarkItDown, a free Python library that converts almost any document into Markdown — perfect for LLMs and text analysis workflows. It supports formats like PDFs, Word, Excel, images (with OCR), audio, YouTube links, and even ZIPs.

Microsoft also open-sourced a toolkit for smarter satellite image segmentation. It helps users pick the best regions to label or train on, which essentially helps boost model performance while saving time and compute.
SpaceNet 9 is live with a challenge focused on aligning high-res optical and SAR imagery for disaster response. The goal is to build algorithms that make cross-modal satellite image integration faster and more accurate. This is brought to you by MAXAR and UMBRA.
Jobs
FSC Global Development is looking for a Geospatial Engineer under its Information and Technology Unit in Bonn.
OECD is looking for a Data Scientist under its Centre for Entrepreneurship, SMEs, Regions and Cities in Paris.
Preferred by Nature is looking for a fully remote Forestry and Sustainability Specialist in Gabon.
Just for Fun
A stunning image taken from the International Space Station of the Aurora.
That’s it for this week.
I’m always keen to hear from you, so please let me know if you have:
new geospatial datasets
newly published papers
geospatial job opportunities
and I’ll do my best to showcase them here.
Yohan