

🌐 How global warming is impacting water gaps
PLUS: the link between population growth and flooding, satellite object detection with RS-YOLO, and more.


Hey guys, here’s this week’s edition of the Spatial Edge — a weekly round-up of geospatial news that’s more niche than someone whose LLM of choice is Gemini. The aim is to make you a better geospatial data scientist in less than 5 minutes a week.
In today’s newsletter:
Water Gaps: Climate change widens global water shortages.
Flood Exposure: Population growth drives rising flood risks.
Digital Inequality: Stronger institutions reduce tech-driven disparities.
Object Detection: RS-YOLOX improves satellite image analysis.
GPR Data: Benchmark dataset for ground-penetrating radar models.
Research you should know about
1. How global warming increases water gaps

A new study published in Nature Communications looks at how climate change is making global water scarcity worse.
Researchers measured “water gaps” — these are essentially the shortfall between water supply and demand. This was done using climate projections under two warming scenarios.
Right now, the global water gap is 457.9 km³ per year, but it’s expected to grow by 5.8% if temperatures rise by 1.5°C and by 14.7% under a 3°C warming scenario. The impacts won’t be the same everywhere. Major agricultural regions like India’s Indo-Gangetic Plains, the North China Plain, and the US High Plains are set to see the biggest increases in water shortages.
The study used data from five climate models and high-resolution hydrological data to estimate water availability and demand across different regions. The results show that warming will widen water gaps in many areas, with India, China, and the US facing some of the biggest increases. On the other hand, some places, including Nigeria and Vietnam, could see slight improvements due to changing rainfall patterns.
As shortages become more severe, solutions like more efficient irrigation, water reuse, and better storage systems will become pretty important.
PS the underlying data is available here.
2. Links between population growth and flood exposure
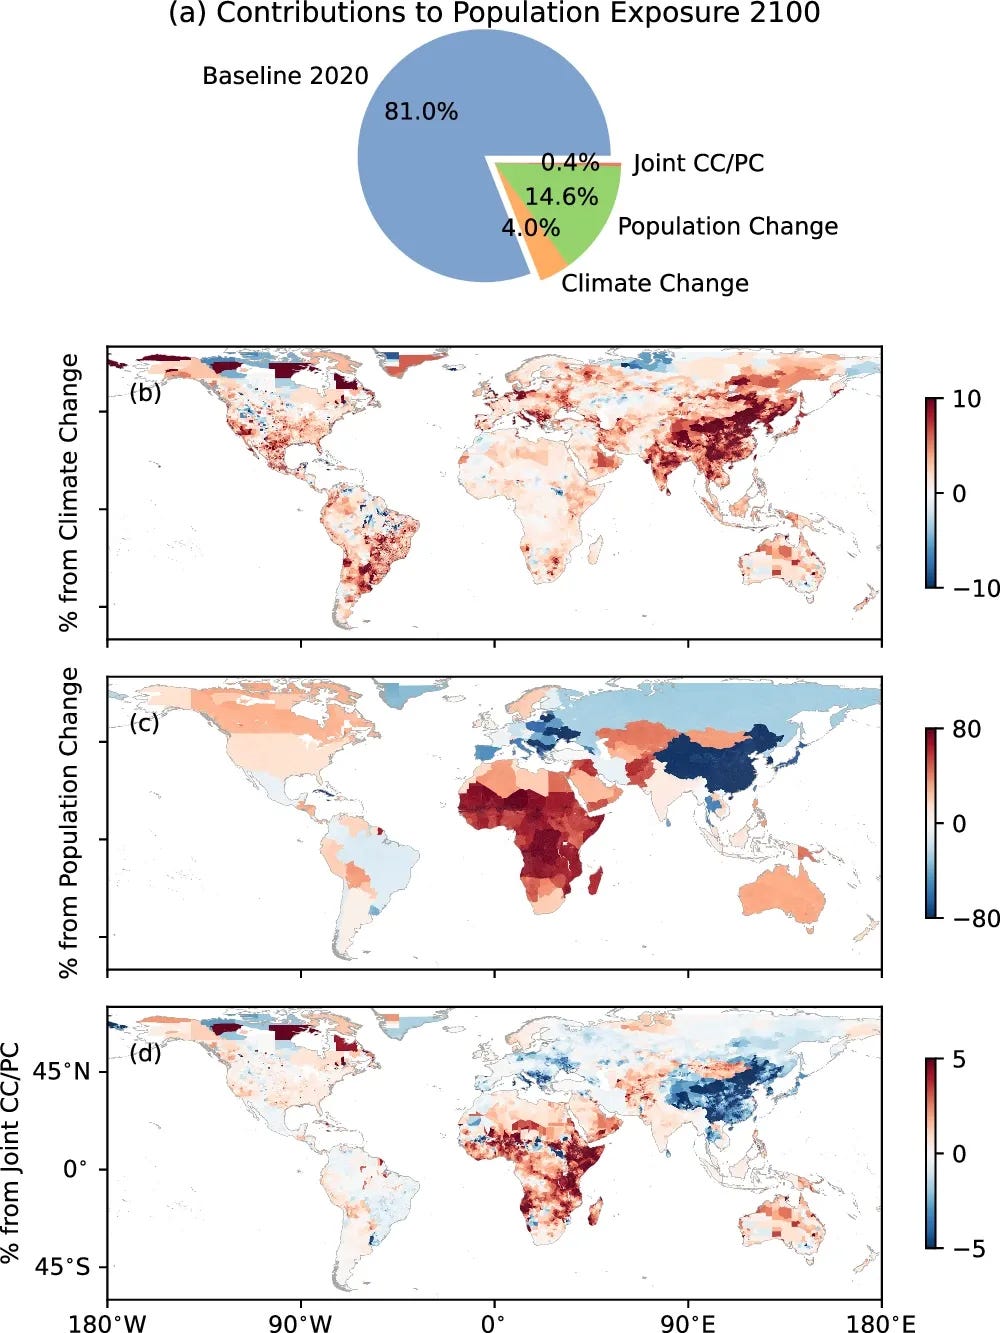
A new paper published in Nature Communications examines how climate change and population growth are shaping future flood risks.
By 2100, around 1.9 billion people will be exposed to severe floods. This is up from 1.6 billion in 2020. What I find interesting is that population growth is the main driver. It’s responsible for nearly 77% of the increase, while climate change accounts for just over 21%. The biggest burden will fall on low-income regions, where flood exposure is expected to rise the most. Urban areas, in particular, will see a 33% jump in people at risk.
The researchers built a high-resolution global flood model that combines coastal, river (fluvial), and rainfall-driven (pluvial) flooding. Their approach integrates data from global climate models, population projections, and historical flood records. The model, which includes detailed 90m-resolution data (and even 10m in some places), suggests that coastal flooding will expand the most, while pluvial flooding remains highly uncertain due to unpredictable rainfall patterns.
The takeaway?
Flood risk is rising fast, but human settlement patterns are the main accelerator. By 2100, 63% of people at risk will live in low-income areas.
3. Stronger institutions minimise digital-driven inequality

A new study published in Papers in Regional Science examines how digital technology impacts regional income inequality across Europe and whether strong institutions can mitigate this effect.
Using data from 140 NUTS2 regions between 2006 and 2016, the researchers find that higher investments in digital technology (covering computing equipment, communication tools, and software) are linked to greater income inequality. However, this effect is less pronounced in regions with strong formal institutions (effective governance) and high levels of informal institutions (bridging social capital, or networks that connect diverse groups).
The study applies a panel fixed-effects model and an instrumental variable approach to address endogeneity concerns. The Gini index is used as a measure of inequality, while digital technology investment per employee is estimated from EU-KLEMS data. The findings suggest that without institutional safeguards, digital investments can deepen economic disparities. However, when governance is effective and social capital is strong, digital technologies may contribute to a more equitable income distribution.
These results highlight the need for policies that go beyond digital infrastructure investment. Strengthening institutions, both in terms of governance and community networks, can supposedly help regions make the most of digital advancements while minimising inequality.
4. Satellite object detection with RS-YOLOX
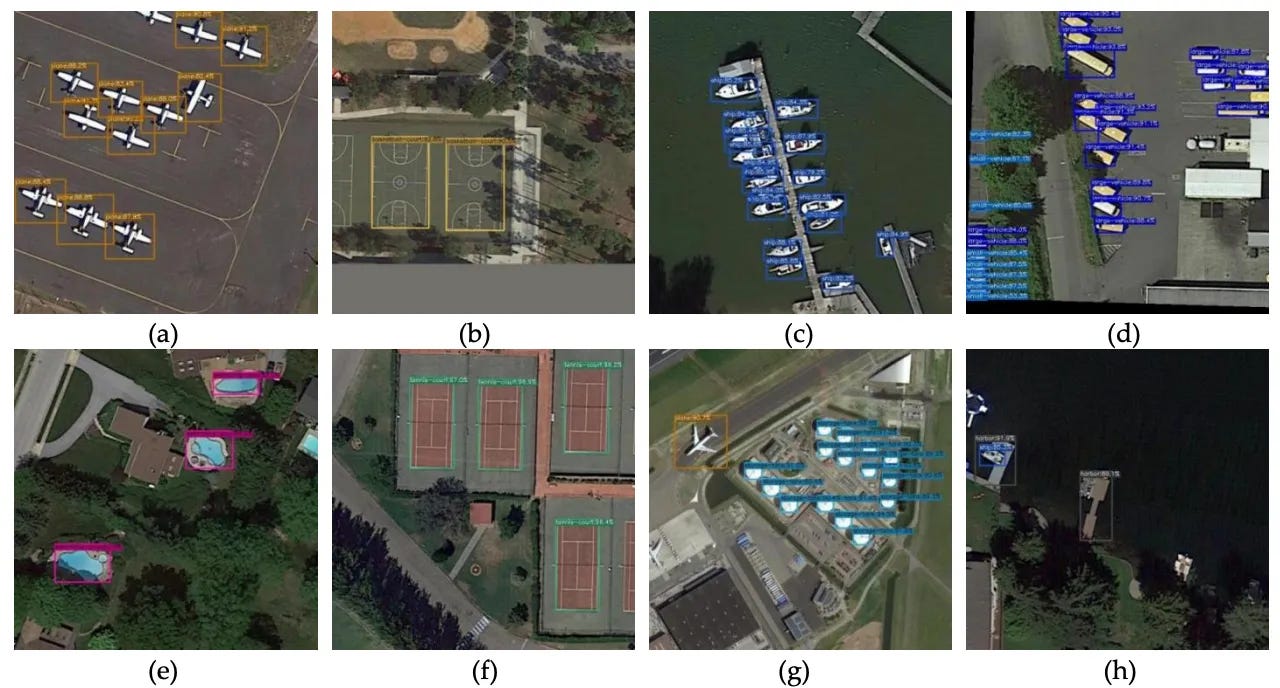
New research introduces RS-YOLOX, a high-precision model for detecting objects in satellite images.
Accurate object detection in remote sensing is pretty important for applications like disaster response and infrastructure monitoring, but existing models struggle with detecting small objects in high-res images. The researchers enhanced an existing deep learning model, YOLOX, with improved feature extraction, better handling of class imbalances, and a technique to process large images more efficiently.
Basically, RS-YOLOX is a type of object detection model. This means it can automatically identify and outline objects in an image. Unlike traditional methods that rely on manual feature selection, modern deep learning-based models learn patterns directly from the data. The researchers improved YOLOX by adding Efficient Channel Attention (ECA), which helps the model focus on important parts of an image while ignoring background noise. They also used Adaptively Spatial Feature Fusion (ASFF), which enhances the detection of small objects by combining information from different scales in an image. Additionally, they replaced the standard training loss function with Varifocal Loss (VFL) to better balance the learning of hard-to-detect objects.
The model was tested on three benchmark datasets:
DOTA-v1.5: A large-scale dataset containing 16 categories of objects, including airplanes, ships, and vehicles. RS-YOLOX outperformed other models, achieving a mean average precision (mAP) of 78.49%.
TGRS-HRRSD: A dataset with 21,761 images of urban and rural environments, containing 13 object categories, such as roads, bridges, and sports fields. RS-YOLOX reached an mAP of 68.26%.
RSOD: A smaller dataset of 976 images with 4 categories (aircraft, oil tanks, playgrounds, and overpasses). Despite its small size, RS-YOLOX achieved 78.56% mAP, showing strong performance even with limited training data.
These results show that RS-YOLOX is pretty effective at detecting small objects in high-resolution satellite images. This is valuable for tasks such as monitoring urban expansion, identifying ships in coastal waters, or detecting vehicles in disaster zones. While the model is more computationally intensive than previous versions, it provides some pretty decent improvement in accuracy.
Geospatial datasets
1. Synthetic GPR dataset

The 2D Multi-Offset, Multi-Frequency Synthetic GPR Dataset is designed as a benchmark for testing and improving ground-penetrating radar (GPR) processing and inversion algorithms. It includes realistic multi-offset profiles at 50, 100, and 200 MHz, covering four sections of a subsurface model. You can access the data here and the code here.
2. Rainfall-induced landslide catalogue

The e-ITALICA dataset expands the ITALICA catalogue by providing rainfall-triggering conditions for 6,312 landslides in Italy (1996–2021). It includes detailed spatial and temporal data, rainfall duration and intensity, topographic features, and land cover information. You can access the data here and the code here.
3. NASA GEDI level 4C dataset

NASA's ORNL DAAC has released the GEDI Level 4C Version 2 dataset, which provides global predictions of the Waveform Structural Complexity Index (WSCI) with 95% confidence intervals. You can access the dataset here.
Other useful bits
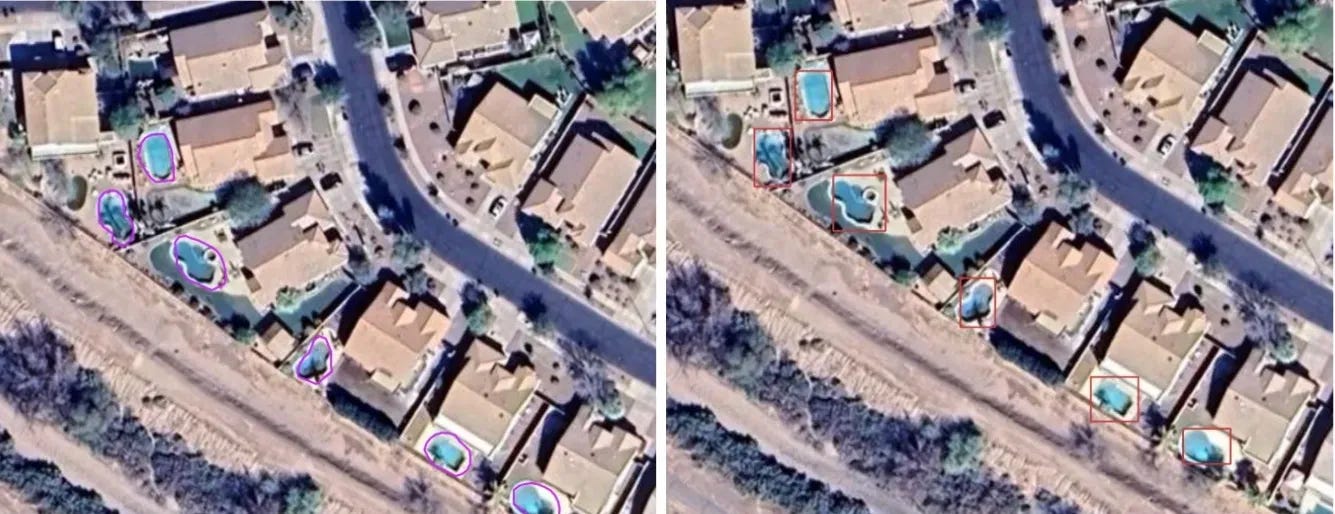
GeoAlert put together a super interesting blog on their mixed experiences with geospatial foundation models (GFMs). They tried to use GFMs to detect swimming pools in aerial imagery but found that a normal deep learning model worked best. After testing text-prompted segmentation with mixed results, they switched to pseudo-labeling with Mapflow and fine-tuned a CNN-based model for higher accuracy. This is a pretty interesting finding given the ongoing debate on the usefulness of geospatial foundation models (more on that here).
OpenEuroLLM is the first open-source LLM family covering all EU languages. Let’s be honest — this is pretty bizarre given that pretty much all the main LLMs cover all EU languages. But still, you gotta hand it to the European Commission for getting involved in the LLM game I suppose…
The EU-Africa Space Partnership Programme is launching in 2025 with a €100 million investment, strengthening space cooperation between the EU and Africa. It’ll support climate monitoring, disaster response, and digitalisation, while promoting private sector growth and innovation in Africa’s space industry.
Suomi NPP VIIRS Black Marble products are saying goodbye (sort of). Production of Version 1.0 will stop on January 31, 2025, but past data will stay available until September 30, 2025. Learn more about the discontinued VIIRS Black Marble products here. However, rest assured, Version 2.0 is being rolled out in its place.
Jobs
ESA is looking for a Graduate Trainee in Earth Observation Commercialisation.
The Humanitarian OpenStreetMap Team is looking for a Project Coordinator (Consultant) who will focus on engaging with government disaster management agencies.
Carbon Direct is looking for a Research Associate (Forestry Landscape Decarbonization) to join their Science & Advisory team(s), with an emphasis on nature-based climate solutions.
MSF is looking for a Graphics and Communication Intern based in Geneva, Switzerland to help their GIS Team.
Just for fun

Here’s a random fact which I thought was pretty cool: the International Space Station spans 357ft (roughly 109m) from end to end, which is about the length of a football field. I wonder if they’ve got Kendrick lined up to perform up there next.
That’s it for this week.
I’m always keen to hear from you, so please let me know if you have:
new geospatial datasets
newly published papers
geospatial job opportunities
and I’ll do my best to showcase them here.
Yohan