

🌐 How migration trauma impacts refugees
PLUS: infrastructure improves childhood outcomes, new methods of identifying buildings in satellite images, and more.

Merry Christmas everyone. To get you in the holiday spirit, we’ve cooked up something more delicious than Yule Log (I’ve just learnt this is a thing): a new edition of the Spatial Edge. Reading it is guaranteed to make you the coolest person at Christmas lunch.
In today’s newsletter:
Migration trauma: how it shapes refugees’ economic choices.
Critical infrastructure: reduces child mortality in sub-Saharan Africa.
Object detection: GeoFormer simplifies building delineation from satellite imagery.
Mobility data: issues in early COVID-19 research
New geospatial datasets: embeddings and fracture segmentation.
Research you should know about
1. How migration trauma impacts refugees

A new study published in World Development explores how migrants, who experienced victimisation during their journey to a new country, impact their economic decisions after they arrive. The research focuses on asylum seekers who arrived in Germany in 2015.
The study relies on data from the IAB-BAMF-SOEP refugee survey, which tracks over 3,000 refugees in Germany. Researchers created indicators for physical and financial victimisation based on experiences like physical attacks, extortion, or fraud. They then assessed how these events impacted employment and education.
Key findings:
physical victimisation increases refugees’ likelihood of taking low-skilled/low-income jobs (by 6.1%)
physically victimised refugees were less likely to undertake further education or training in the country they arrived in (by 3.1% points)
financial victimisation didn’t massively affect the results
So the bottom line here is that physical victimisation led asylum seekers to ‘loss of future orientation’, which means they prefer getting a (lower) income immediately than skilling up and getting higher-paid jobs in the future.
2. How infrastructure improves child health and nutrition
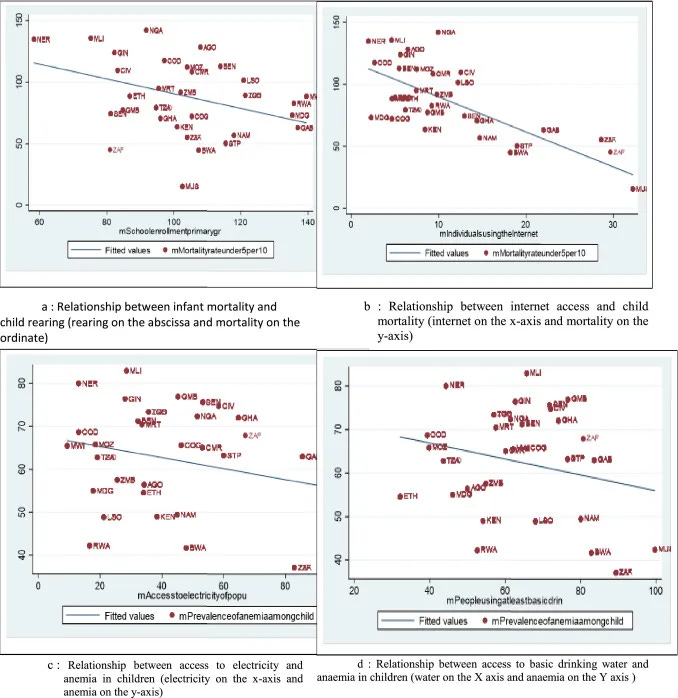
A new paper in Sustainable Futures investigates the role of infrastructure in improving child well-being in sub-Saharan Africa, addressing critical challenges such as high child mortality and malnutrition. This research spans 30 countries from 2000 to 2020, employing the Generalised Method of Moments (GMM) to analyse the impact of various infrastructure types—including education, healthcare, electricity, water, and sanitation—on child health and nutrition.
The researchers used datasets from the World Development Indicators, World Governance Indicators, and other sources to assess two main indicators of child well-being: child mortality and anaemia prevalence.
Key finding:
access to electricity, clean water, and sanitation significantly reduced child mortality and anaemia rates.
E.g. access to electricity correlated with a 37.4% reduction in child mortality, while primary school enrolment decreased anaemia rates by 26.1%.
3. Making building delineation models more efficient

A team from the Technical University of Denmark introduce GeoFormer, a transformer-based architecture designed to improve building delineation from satellite imagery.
This basically addresses the challenges of converting segmentation maps into vectorised polygons by learning to generate multi-polygon outputs in an end-to-end manner. Unlike traditional methods that rely on multiple loss functions and complex post-processing, GeoFormer simplifies the process and delivers better results.
The methodology centres on an auto-regressive approach, where polygons are predicted as sequences of spatial tokens. The model was trained and evaluated on the Aicrowd Mapping Challenge dataset, which includes over 340,000 high-resolution satellite images annotated with building footprints.
4. Was mobility data cherrypicked to measure the impacts of the pandemic?
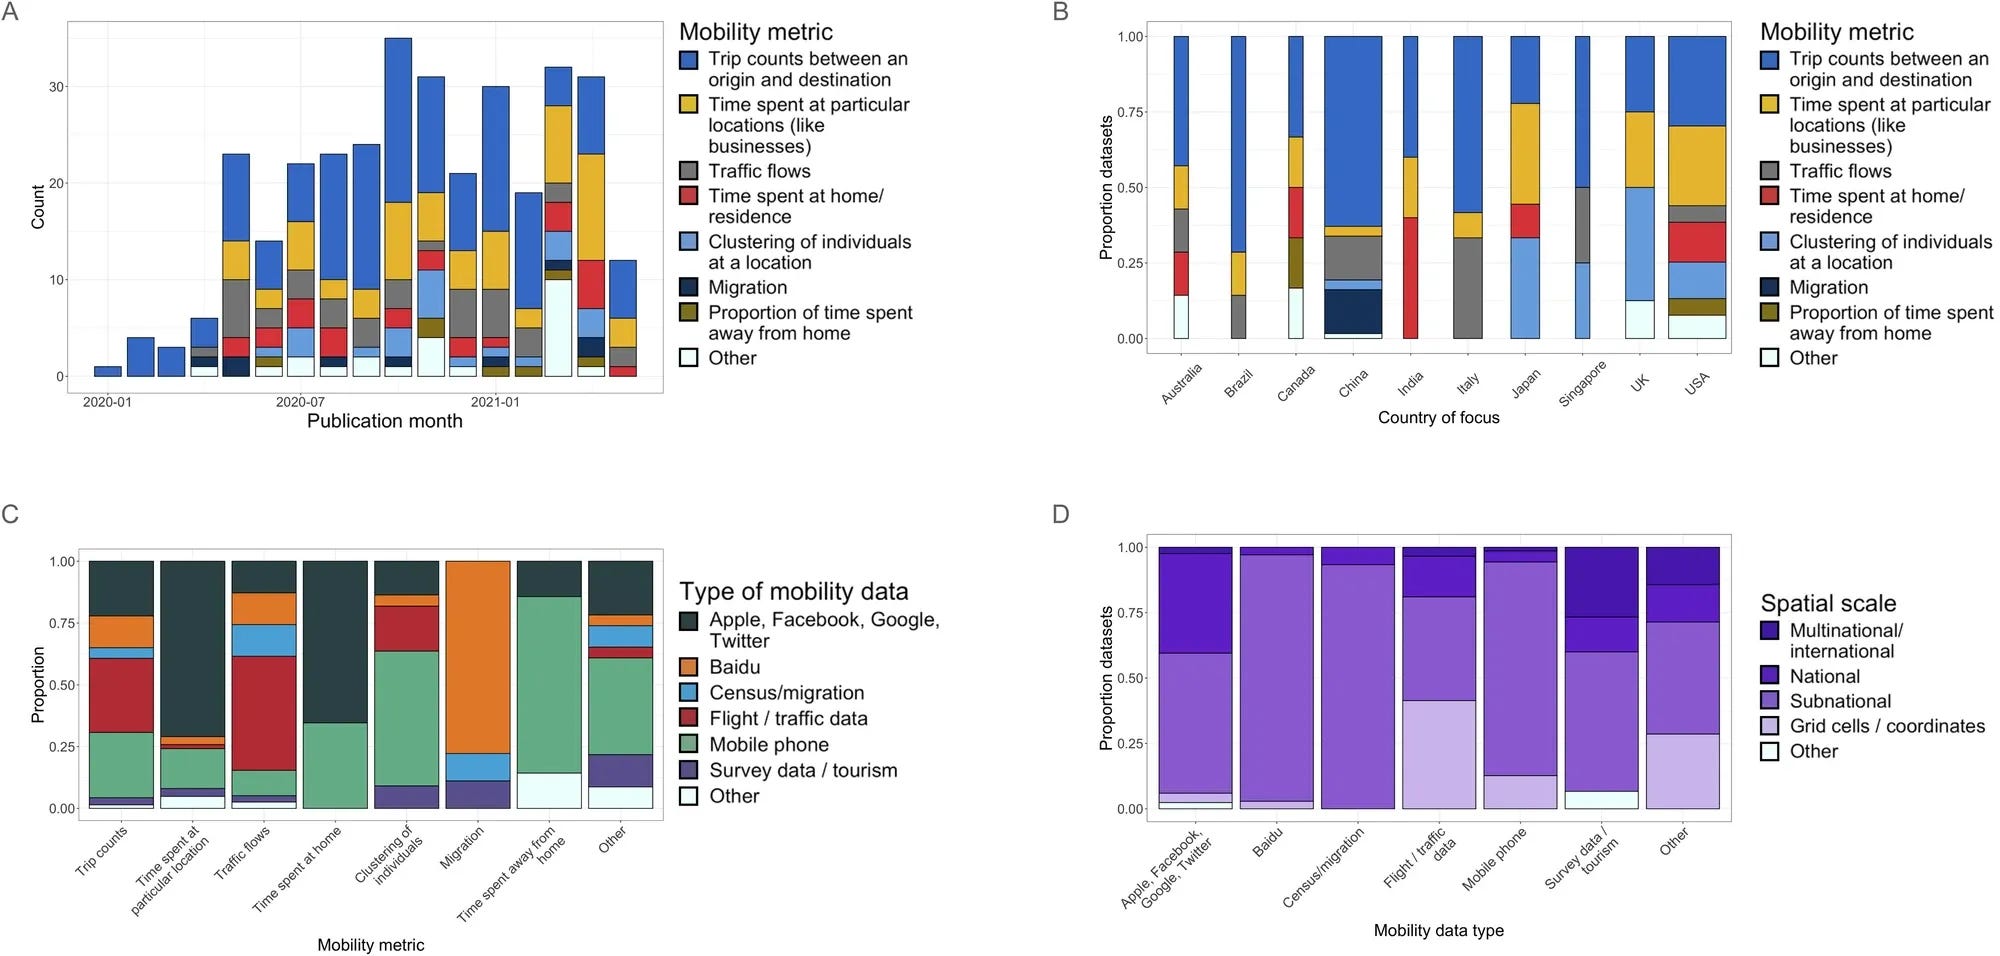
A new study published in Nature Communications looked at over 200 papers that used population-level mobility data (like phone location traces or travel records) to analyse how COVID-19 spread in the early stages of the pandemic.
The researchers reviewed articles published from January 2020 to May 2021, focusing on which datasets were used (e.g., Google’s mobility reports, flight data, mobile phone app data), how they were processed, and what modelling approaches were taken. They found that while many studies relied on widely accessible data, few provided details on population representativeness or adjusted for bias. Many analyses modelled daily movements at subnational scales using statistical or mechanistic methods, but there was no standard approach, and many didn’t validate their results against external datasets.
The key takeaway is that although mobility data was assessed in relation to the observed decreases in COVID-19 cases following lockdowns or travel restrictions, no consistent or standardised methodology emerged. I guess the bottom line here is that standardisation would help us use mobility data in a more reliable way.
You can access the dataset and code here.
Geospatial datasets
1. EO embeddings dataset

Major TOM has released a new embeddings dataset, covering 170m embeddings from over 60TB of satellite data. This essentially aims to standardise geospatial embedding sharing across four models and three unique modalities.
2. Fracture edges dataset

GeoCrack is the first large-scale open-source dataset focused on fracture segmentation in geological outcrops. It features over 12,000 high-res image-mask pairs of annotated fracture edges compiled from 11 sites across Europe and the Middle East. You can access the dataset here and the code here.
3. Grassland maps dataset

A new study in Scientific Data introduces a dataset of 30m annual global grassland maps (2000–2022). It looks at cultivated and natural/semi-natural grasslands, which have been derived from Landsat imagery, climate data and ML. You can access the source code here.
Other useful bits

ESA has launched a new open competitive bidding for designing advanced applications for the Destination Earth (DestinE) Platform.

IBM Research introduced TensorLakeHouse, an open-source platform for managing and analysing geospatial data better. It uses hierarchical statistical indices to accelerate data querying and processing, enabling faster insights for large-scale geospatial applications.
The OpenGeoHub 2025 EO Summer School will run from 1-6 September. I’m a big fan of their sessions (which are posted on YouTube for free). And they do a bunch of hands-on tutorials on geospatial programming using Python and R. You can apply here.
An online version of the book "Introduction to Python for Geographic Data Analysis" is now available, which is an excellent resource for learning Python in geospatial contexts. It covers a bunch of topics from processing data to visualisation, and specific case studies on spatial network analysis and spatial interpolation.
Laos is using geospatial analysis to improve access to primary healthcare, particularly in remote areas. They’re using geospatial data to map demographics, health facilities, and resources to better design health services in the country.

Jobs
Weyerhaeuser is looking for a Remote Sensing Scientist with a strong background in remote sensing, advanced image processing and analysis, and programming.
The ESA Φ-lab CIN is looking for a Visiting Researcher in Satellite meteorological image processing.
Flood Base is looking for a Machine Learning Engineer to build algorithms to synthesise data from satellites, hydrologic models, and ground sensors into actionable insights.
Amazon Prime Air is looking for a Geospatial Engineer with a strong GIS background.
Oxford Economics is looking for a Geospatial Data Scientist with experience in economic geography, geospatial analytics, data science, or machine learning.
Global Risk Assessment Services (GRAS) is looking for a Geospatial Data Engineer / Specialist under its Technology Projects Department.
Forschungszentrum Jülich is looking for a Postdoc in Hybrid Quantum Computing for EO.
Just for Fun

The "rainbow airplane" seen in satellite imagery is an artefact caused by Multi-Spectral Imagery (MSI) sensors. These sensors capture spectral bands at slightly different times, so moving objects, like airplanes, appear in shifted positions for each band, and can create a rainbow effect. It’s a pretty fascinating quirk of advanced satellite imaging tech.
That’s it for this week.
I’m always keen to hear from you, so please let me know if you have:
new geospatial datasets
newly published papers
geospatial job opportunities
and I’ll do my best to showcase them here.
Yohan