


Hey guys, here’s this week’s edition of the Spatial Edge, a place where every CRS is always declared. Anyway, the aim as usual is to make you a better geospatial data scientist in less than five minutes a week.
In today’s newsletter:
Mobile Internet: Cell towers raise household wealth in the Philippines.
HLS Check: NASA’s harmonised Landsat-Sentinel product closely matches MODIS.
Crop Calendars: Sentinel-1 pins sowing dates to within eight days.
Travel Friction: A global 30 m walking and driving surface.
Water Transfers: Mapping 435 major water transfer projects worldwide.
Research you should know about
1. How mobile internet raised household wealth in the Philippines
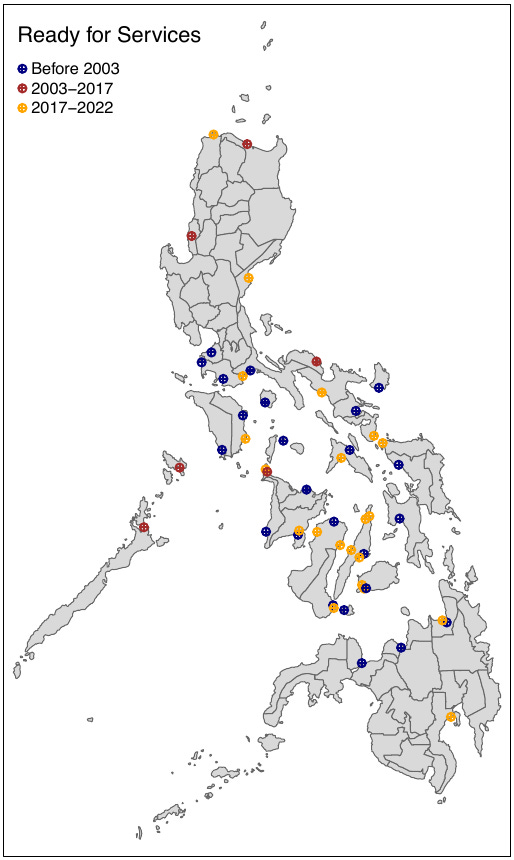
Alright, I’m gonna own this one. This first paper is one I co-authored with Zhiwu Wei and Neil Lee (riding on their coattails of course). It’s one that we’ve been working on for about 2.5 years, so we’re pretty thrilled it’s finally out. Mobile internet is now basic infrastructure across the developing world, but it’s hard to measure its causal effect on living standards because better-off places tend to get connected first. Our paper in the Journal of Development Economics to attempts to examine this for the Philippines.
We built a granular measure of local connectivity from about 270,000 geocoded cell towers, then used distance to submarine cable landing points as an instrument for that connectivity. The idea is that being closer to where undersea internet cables come ashore makes it cheaper to roll out towers, but shouldn’t affect wealth through any other channel. We linked this to household wealth from the 2017 and 2022 Demographic and Health Surveys, and checked the instrument with a placebo test on 2003 survey data, collected before towers were rolled out.
Mobile internet connectivity increases household wealth, with effects across education levels and most pronounced in urban areas. We find that doubling local tower density raises the household wealth index by about 0.04 standard deviations, roughly ten times the naive estimate, and the effect in towns and mid-sized cities is around 3.6 times that in rural areas. Better connectivity also boosts activity in key economic sectors, improves educational outcomes and raises female labour force participation, mostly in occasional work. We conducted an event study, which suggests tower rollout may also make it easier for people to migrate abroad for work and send remittances home.
2. How well NASA’s harmonised Landsat-Sentinel product lines up with MODIS
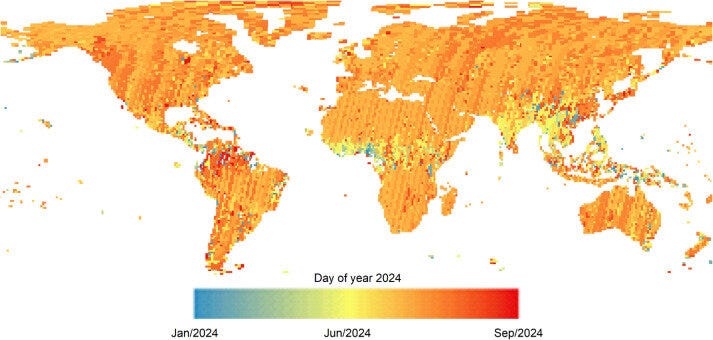
NASA’s Harmonized Landsat and Sentinel-2 (HLS) product gives 30 m surface reflectance every 2–3 days on average, but it’s important to know how consistent it is with the long-established products people have been using for years. A new study in Remote Sensing of Environment from folks at NASA and others compares HLS Version 2.0 with MODIS’s BRDF-adjusted reflectance (NBAR).
They compared the two products globally across the six spectral bands they share, looking at correlations, mean absolute differences and where the biggest gaps show up. Because MODIS pixels are much coarser, this also shows how resolution affects what each product records over mixed surfaces.
HLS and MODIS NBAR agree closely, with R² values of 0.939 to 0.986 across the six bands. Mean absolute differences are generally under 0.03 for visible bands and under 0.05 for near- and shortwave-infrared, with the largest discrepancies in the blue and SWIR1 bands. The biggest spatial differences are in polar regions, where patches of snow, ice and water get mixed into coarse MODIS pixels but are filtered out of HLS. The authors suggest this could explain some past disagreements between greening trends measured at different resolutions.
3. Pinpointing sowing and harvest dates with Sentinel-1
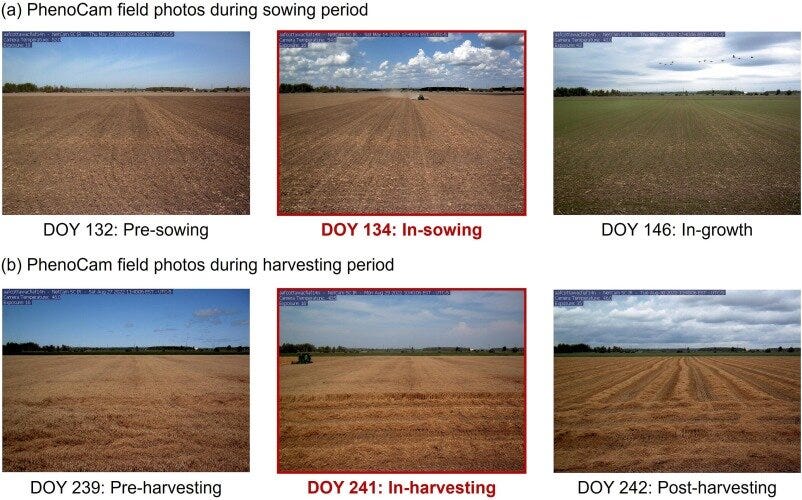
Knowing when crops are sown and harvested matters for yield estimation and crop modelling, and Sentinel-1 radar can see through clouds, but SAR-based methods tend to work well for some crops and badly for others. A new study in Remote Sensing of Environment from the Hong Kong Polytechnic University works out why, and builds a method that adapts to local conditions.
They found that the cross-polarisation ratio works best for rain-fed crops on rough soil, while VH backscatter works better for irrigated or flooded fields, and built a framework (ASIS) that picks the right indicator automatically. ASIS first clusters Sentinel-1 pixels into groups representing different crops and surface conditions, then uses a new index combining VH and the cross-polarisation ratio to delineate growing seasons. Finally, it uses VH outside the growing season to identify surface conditions and choose the best indicator for detecting sowing and harvest.
ASIS estimated sowing dates with a mean absolute error of 7.62 days and harvest dates with 8.48 days. That cuts sowing-date errors by 32.4% compared with using VH alone and by 52.7% compared with the cross-polarisation ratio alone (7.5% and 9.5% for harvest). It works without prior crop labels or field boundaries, which makes it useful in places where that information doesn’t exist.
4. One model for mapping buildings from any optical imagery
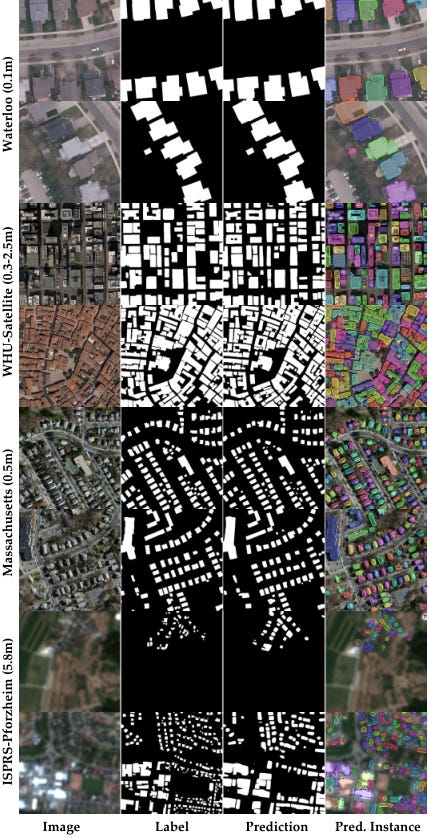
Most building extraction models are trained for one dataset or sensor and struggle when you switch to imagery with a different resolution. A new study from the Technical University of Munich builds a single model that works across optical imagery from 5 cm aerial imagery to 10 m Sentinel-2.
UniBuild trains one model on 12 RGB datasets spanning 0.05 to 10 m resolution, using a DINOv3 backbone with a new high-resolution decoder. The decoder feeds fine shallow features back in to sharpen boundaries and recover small buildings. Two extra training losses keep building edges consistently oriented and stop neighbouring buildings merging in low-resolution imagery, and the model can output georeferenced vector footprints directly.
Across the 12 datasets, UniBuild reached an average IoU of 76.27, against 74.03 for a DINOv3 baseline, with a bigger gain on building boundaries (65.60 vs 61.06). On five completely unseen datasets it averaged an IoU of 63.71, ranging from 89.28 in Waterloo to 32.51 in Pforzheim. The code and model checkpoint are on GitHub.
Geospatial Datasets
1. A global 30 m map of how hard it is to get around
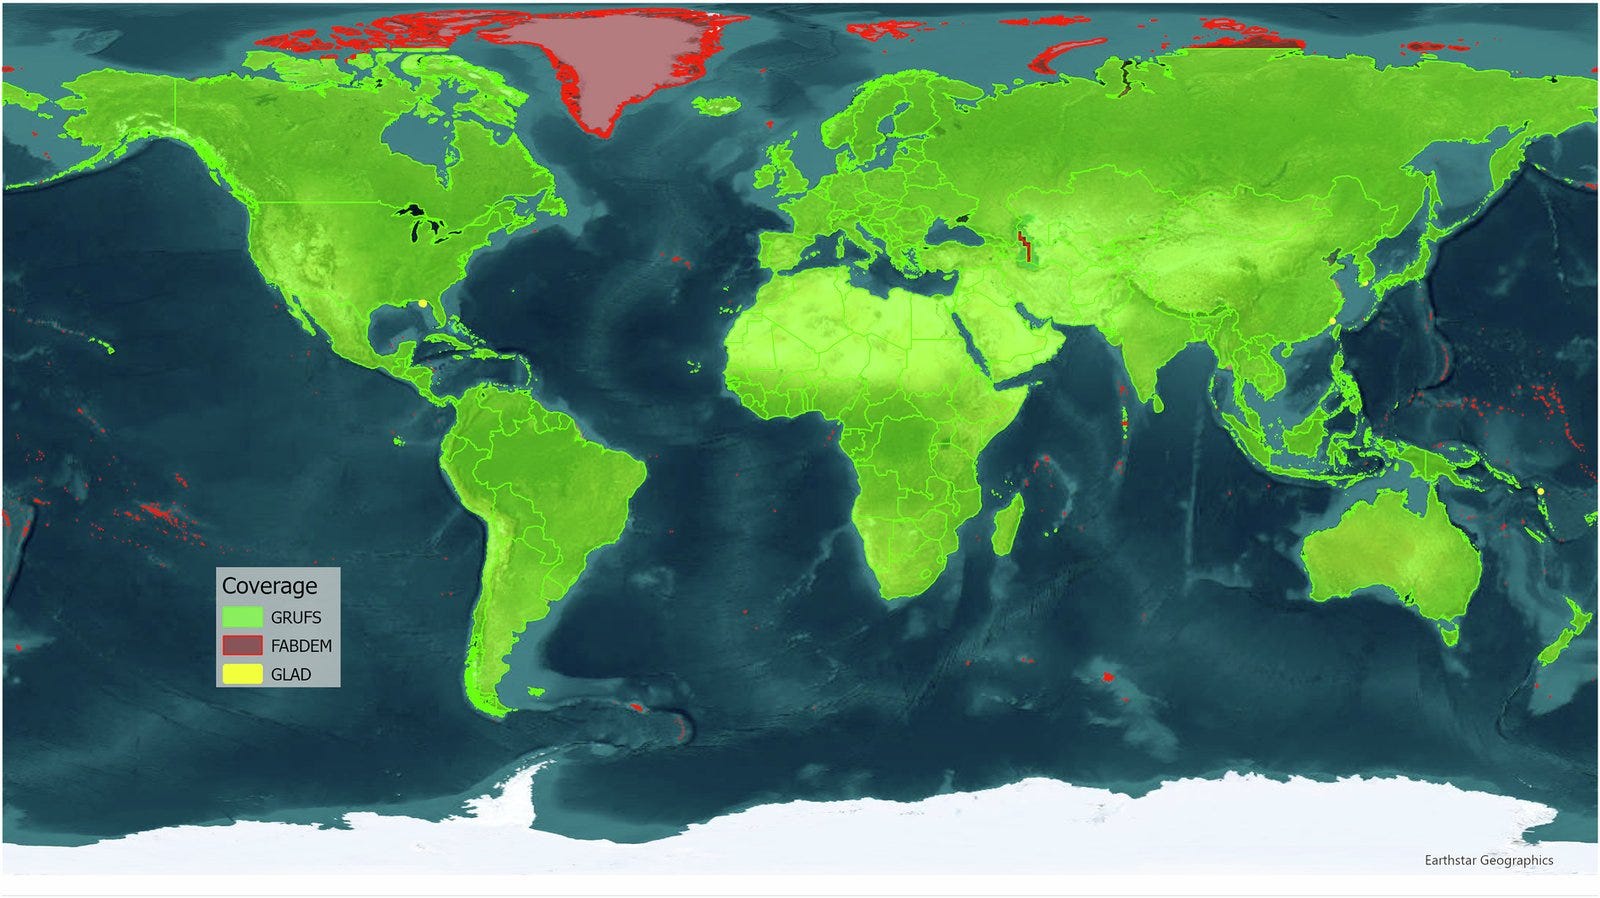
GRUFS, from the World Bank and the University of Twente, is a pair of global 30 m friction surfaces giving travel cost in minutes per metre: one for walking (on roads, paths, ferries and off-road) and one for driving on roads with walking off-road. It’s built from OpenStreetMap, GLAD land cover and FABDEM elevation, with lookup tables and production code, and is designed for accessibility and catchment analysis with planned annual updates. You can find the paper here.
2. Every major water transfer project on Earth
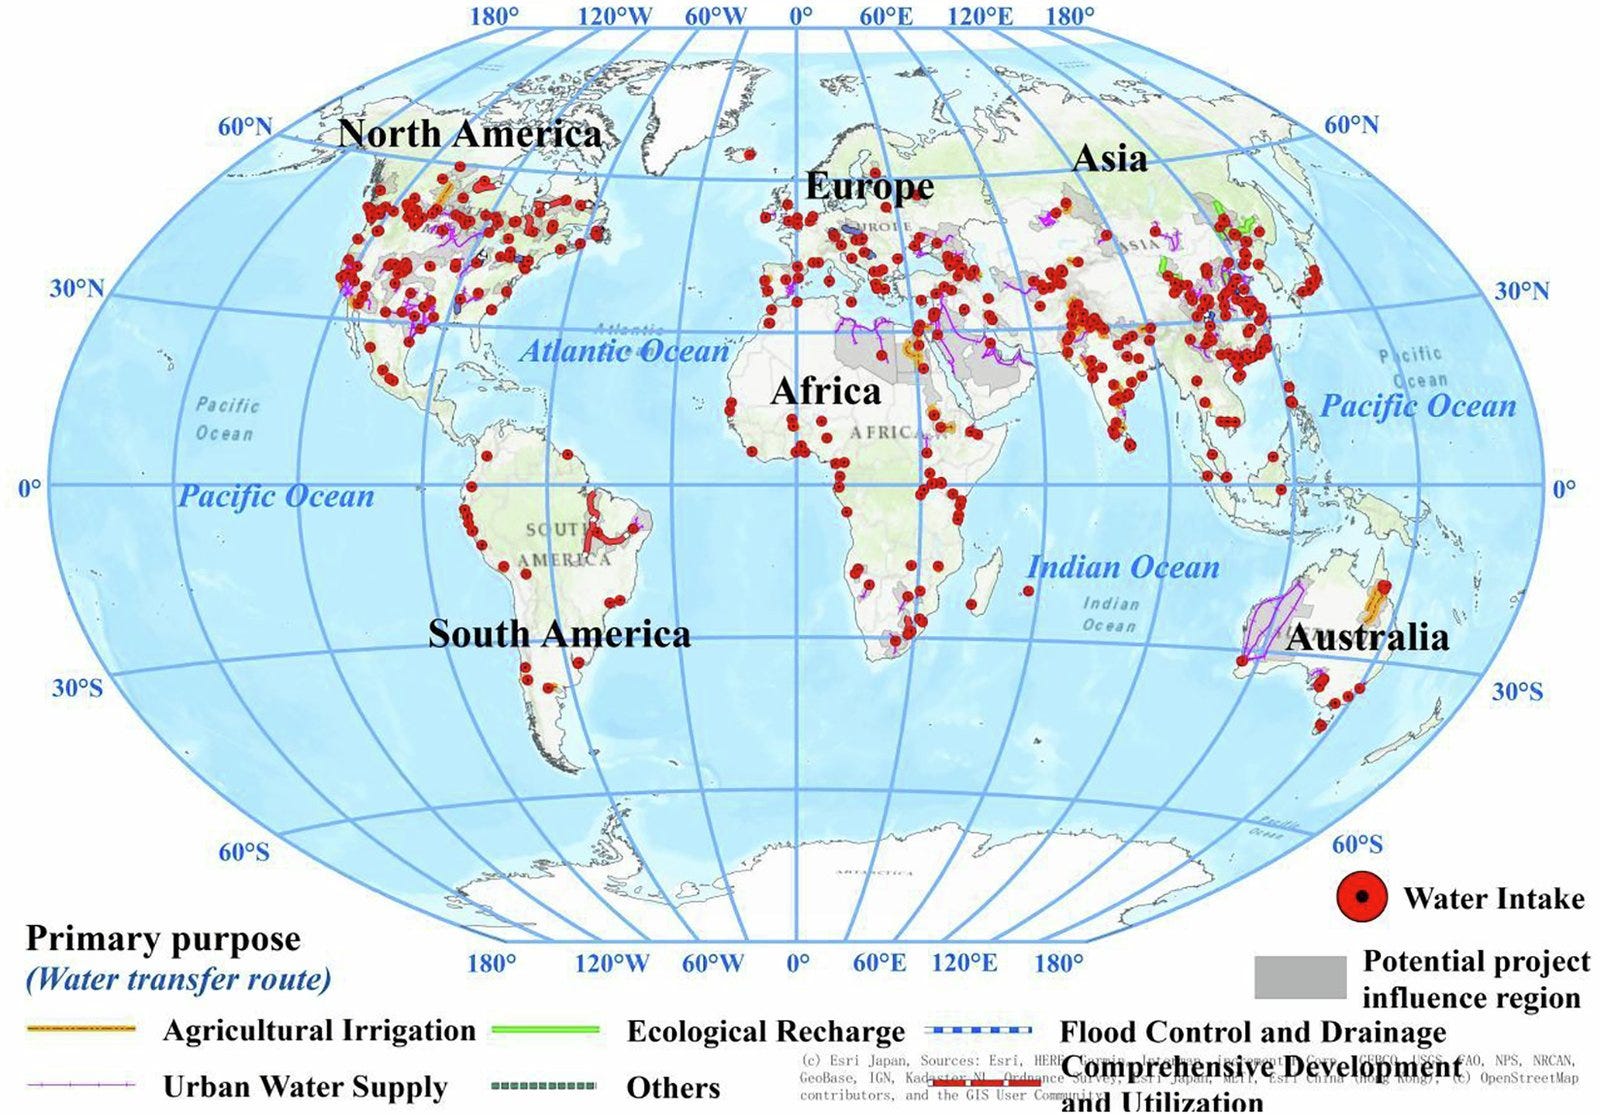
This global inventory of major water transfer projects documents 435 projects with their engineering attributes, plus spatial layers for intake points, transfer routes and the regions each project influences. You can access the data here.
3. Forty years of storm systems tracked from space
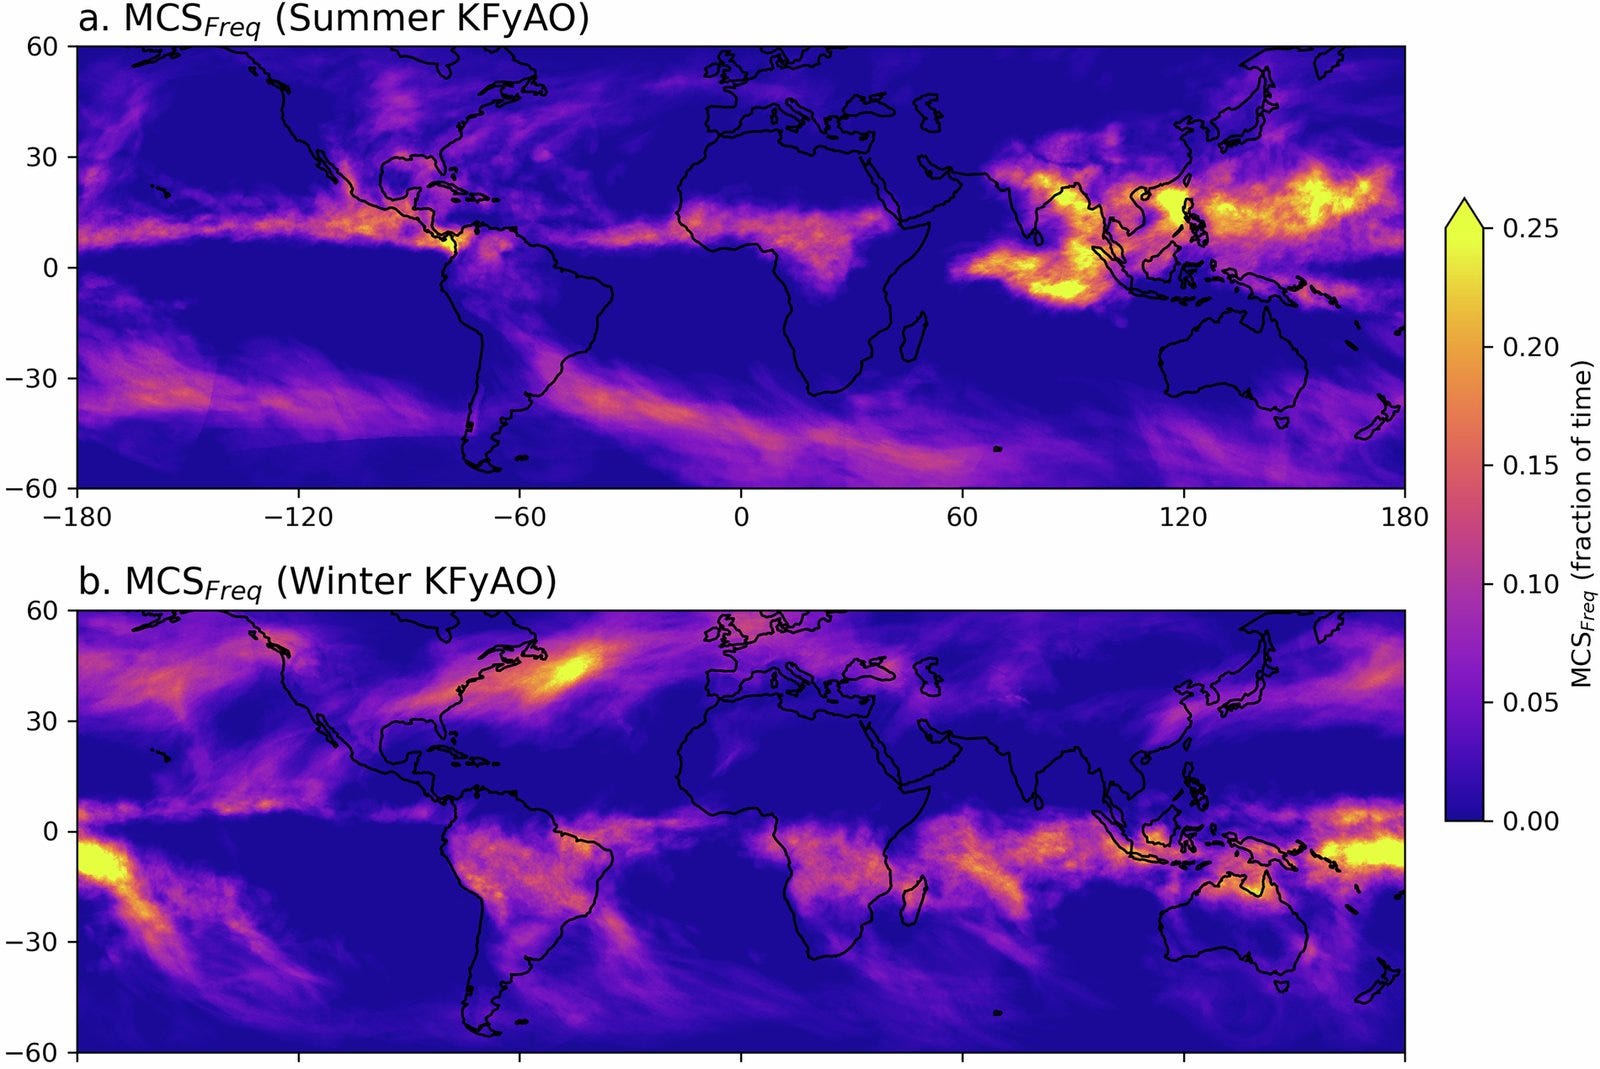
This mesoscale convective systems database tracks large organised storm systems between 60°S and 60°N from 1985 to 2024, using satellite infrared brightness temperatures. You can access the data here.
Other useful bits

ESA has released Earth Virtual Expert (EVE), an open AI assistant for Earth observation built by ESA’s Φ-lab with Pi School, Mistral and Imperative Space. It uses retrieval-augmented generation over ESA, NASA, Copernicus and peer-reviewed sources, and the model, code, training data and benchmarks are public on Hugging Face and GitHub.
GeoPandas 1.2.0 is out, with rebuilt static plotting (basemaps via a
tiles=keyword, colour bars for classified data and a “greedy” scheme so neighbouring polygons never share a colour). It also adds amake_gridfunction for square or hexagonal grids, reads and writes the upcoming GeoParquet 2.0 spec, andread_parquetcan now read directly over HTTP.The Copernicus Data Space Ecosystem has launched an openEO Agent that turns a plain-language question into a validated openEO workflow and runs it for you, so you don’t have to pick collections, bands and time periods by hand. It’s a limited first version, and you can request access through VITO.
Sentinel-3 land surface temperature is now in Copernicus Browser and the Sentinel Hub API, at 1 km with two observations a day (around 10:00 and 22:00 local time) plus uncertainty, cloud probability and NDVI layers. One catch: the Browser shows it without a cloud mask, so cloudy pixels show cloud-top temperature.
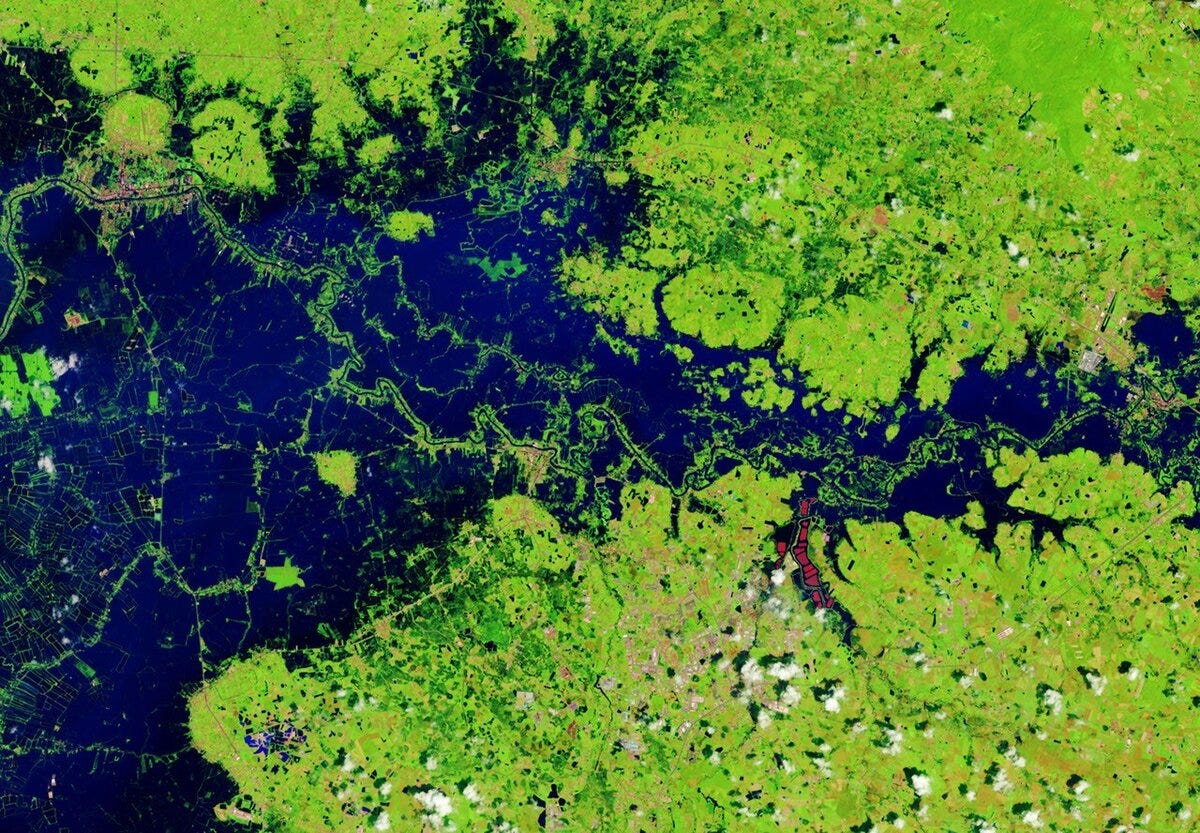
NASA Earth Observatory has mapped severe flooding in Thailand with before-and-after Landsat images from October 2025 and October 2026. Flooding since mid-September has hit 50 provinces, affected more than 4 million people and damaged about 270,000 hectares of farmland.
Jobs
ESA is looking for an Internal Research Fellow in AI on board for Synthetic Aperture Radar Missions based in Frascati, Italy.
ICEYE is looking for a Senior Geospatial Software Engineer based in Espoo, Finland (hybrid).
Oak Ridge National Laboratory is looking for a Postdoctoral Research Associate in Coastal Landscape Geospatial Modeling based in Oak Ridge, United States.
Isometric is looking for a Geospatial Data Analyst (contractor) based in London, United Kingdom.
Just for Fun
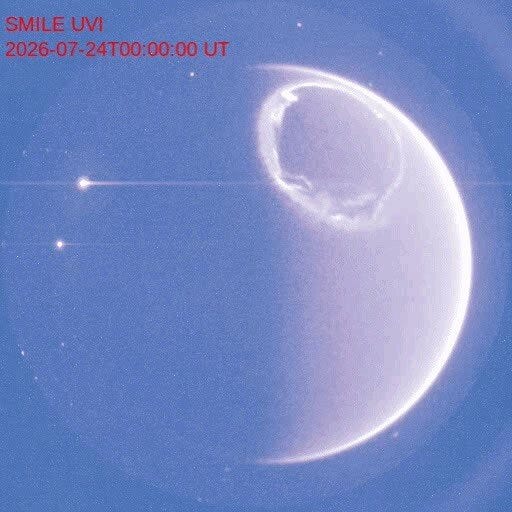
You can’t see a complete auroral oval from the ground because it’s too big a ring around the magnetic pole, but ESA and CAS SMILE spacecraft caught one in ultraviolet light, during daytime. The time-lapse covers about an hour in late July and shows how turbulent auroras really are. SMILE’s job is to study how the solar wind interacts with Earth’s magnetosphere, which helps protect satellites and power grids from solar storms.
That’s it for this week.
I’m always keen to hear from you, so please let me know if you have:
new geospatial datasets
newly published papers
geospatial job opportunities
and I’ll do my best to showcase them here.
Yohan