Identifying sick crops from hyperspectral images
PLUS: Tracking looting in archaeological sites, mapping commuter patterns, using AI to identify village borders and more.
Hey guys, welcome to this week’s edition of the Spatial Edge — a weekly round-up of geospatial news that you can digest in less than 5 minutes.
In today’s newsletter:
Crop Disease Detection: Using hyperspectral images to spot wheat diseases.
Urban Boundaries Mapping: Identifying village borders via satellites.
Crop Classification: New method improves satellite crop identification.
Looted Sites Detection: Satellites track archaeological looting.
Commuting Zones Dataset: Updated US commuter patterns post-COVID.
Research you should know about
1. How to detect crop diseases from hyperspectral images
A new study is using hyperspectral images to identify Fusarium Head Blight (FHB), a nasty fungal disease that affects crops like wheat and barley.
The team used hyperspectral images captured by drones covering wavelengths from 450 to 950 nm. After using K-means clustering, they identified the top 30 most significant spectral bands—key wavelengths that distinguish between mild and severe FHB infection. These selected bands served as inputs for some simple classifiers like LightGBM (a gradient boosting model) and Support Vector Machines (SVM), achieving nearly perfect accuracy in detecting FHB.
This essentially simplifies the detection process and lowers computational requirements, making it pretty useful for large-scale agricultural monitoring. I think it’s just a matter of time till these types of results can be replicated using hyperspectral satellite images.
I can see this being pretty useful for farmers to quickly address any crop health issues, and also for those commodity traders out there who want to forecast crop production.
P.S. the researchers have made their code publicly available on GitHub.
2. Detecting looted archaeological sites from satellite images
A new study introduces the DAFA Looted Sites (DAFA-LS) dataset, which is aimed at detecting looted archaeological sites in Afghanistan using satellite images.
The DAFA-LS dataset is made up of 55,480 satellite images collected monthly over eight years (2016–2023) from 675 Afghan archaeological sites, including 135 that were looted.
The study assessed a bunch of different classification methods that analyse sequences of images over time to detect slight changes associated with looting. They used both pixel-wise and whole-image approaches and leveraged foundation models like DOFA (which are pre-trained on large remote sensing datasets).
It found that analysing the entire sequence of satellite images over time greatly enhances the detection of looted archaeological sites compared to methods focusing on single images. Specifically, when they combined the DOFA model with a temporal attention mechanism called LTAE, they achieved the highest performance. This led to an overall accuracy of 78.7% and an F1 score of 74.9%, outperforming single-image methods by improving the F1 score by 7.9% and overall accuracy by 2%.
The code and dataset is available on GitHub
3. Using satellite images to identify village boundaries
A new study introduces UV-Mamba, a neural network model designed to accurately identify urban village boundaries in high-res satellite images. This attempts to tackle the age-old challenge of mapping densely populated urban villages.
For UV-Mamba, they used an encoder-decoder framework, which processes images by first extracting key features (encoding) and then reconstructing the image to highlight areas of interest (decoding). To enhance this process, they incorporated deformable convolutions and state space models, which essentially help the model focus on important regions and better understand overall patterns in the data.
They trained and tested UV-Mamba on high-res images from Beijing and Xi'an, cities known for their complex urban layouts.
UV-Mamba achieved some pretty impressive results, with Intersection over Union (IoU) scores of 73.3% on the Beijing dataset and 78.1% on the Xi'an dataset, surpassing previous models by up to 3.4%.
Also, it’s six times faster in inference speed and 40 times smaller in parameter count than earlier models.
PS the code is available on GitHub
4. Classifying crops from satellite imagery
If one Mamba wasn’t enough, some different researchers have introduced SITSMamba, a new method for crop classification using satellite image time series data. This is done to improve the accuracy of identifying crop types from satellite imagery over time.
The team developed SITSMamba by combining CNNs for spatial feature extraction with the Mamba architecture for modelling temporal sequences.
They used two key datasets:
PASTIS: featuring Sentinel-2 images from France with 20 crop types, and
MTLCC: comprising Sentinel-2 imagery from Germany with 18 crop types.
The model includes a multi-task learning framework with two branches:
one for crop classification and
one for reconstructing the original time series data
SITSMamba seems to outperform existing methods, achieving overall accuracies of 74.16% on PASTIS and 91.04% on MTLCC. The logic is that using a reconstruction branch allows the model to learn richer temporal representations, therefore improving classification accuracy.
This approach could benefit large-scale agricultural monitoring by providing more accurate crop maps, aiding resource management and decision-making.
PS the code is also available on GitHub
Geospatial datasets
1. World Bank Global Biodiversity Species Global Grid database
The World Bank recently launched its Global Biodiversity Species Global Grid database, a massive dataset that includes over 600,000 species. It includes a bunch of species such as birds, fish, reptiles, arthropods (which I’ve just found out are like beetles), fungi, etc.
The dataset covers info such as species populations, habitat conditions, and conservation statuses.
2. iMAP-FP evidence library
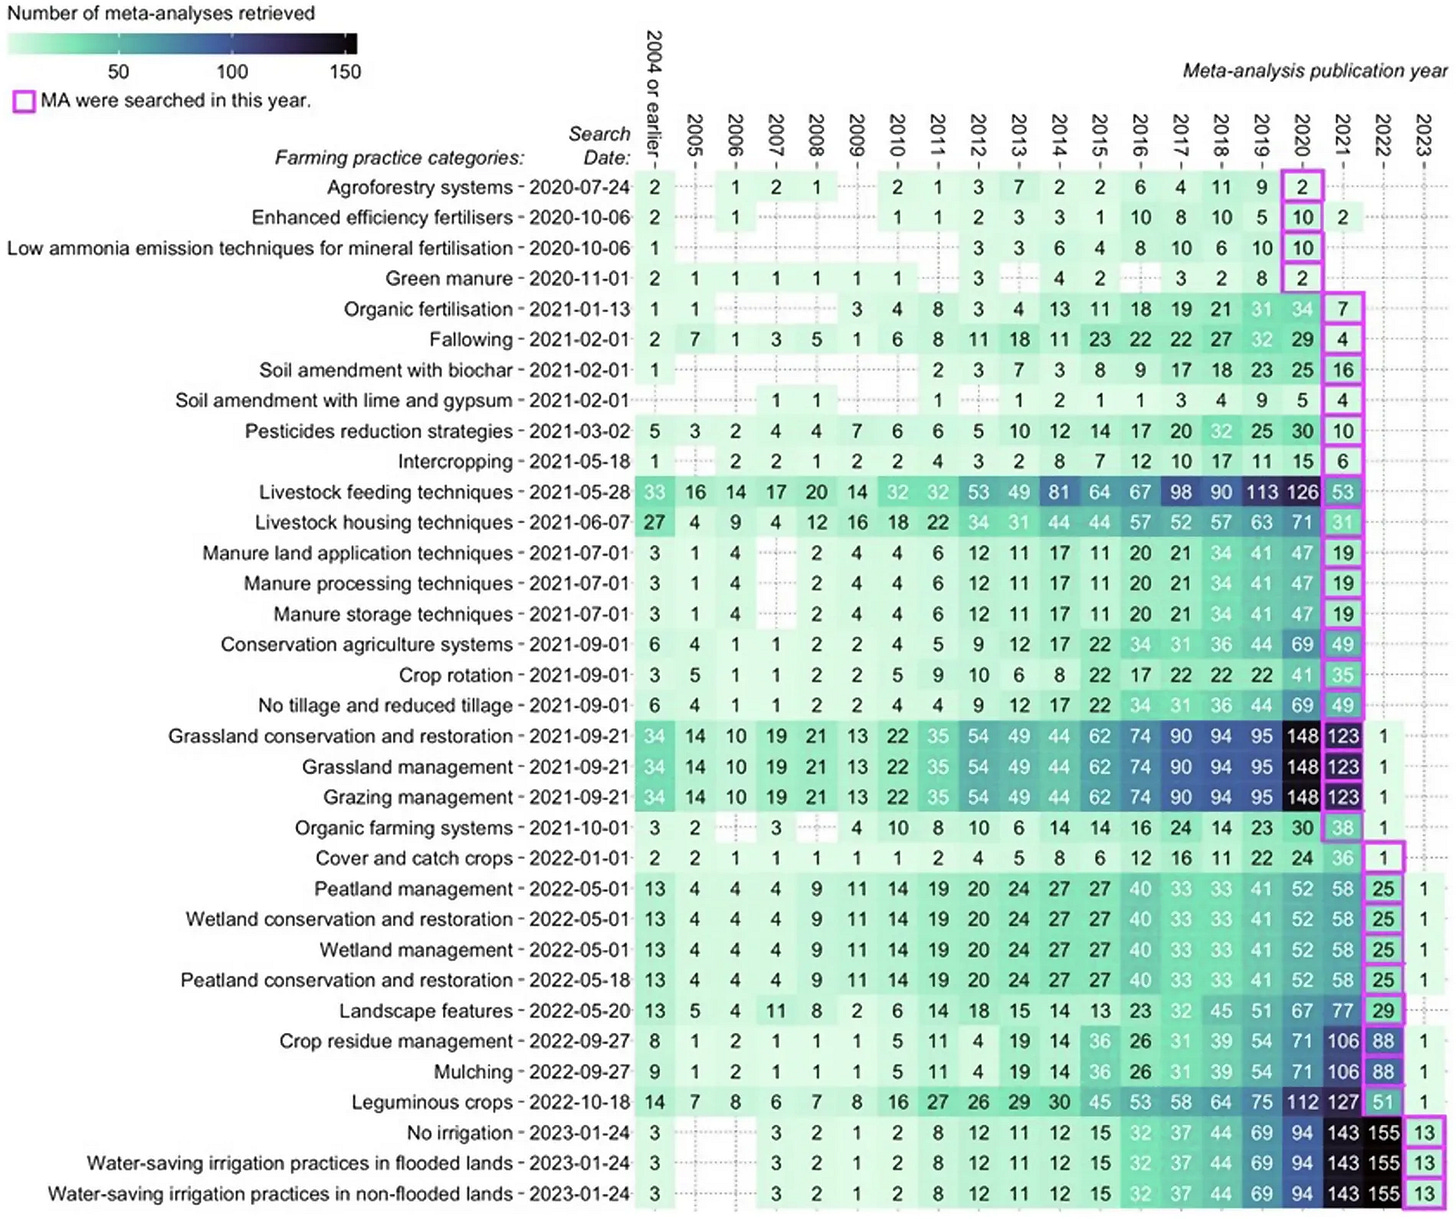
The iMAP-FP evidence library is an extensive dataset analysing the impacts of 34 farming practice (FP) categories on factors such as climate mitigation, soil health, and agricultural productivity. The researchers screened over 13,900 studies published since 2000 and selected 570 meta-analyses that met their criteria.
The code is publicly available in the JRC data catalogue repository.
3. Commuting zones dataset
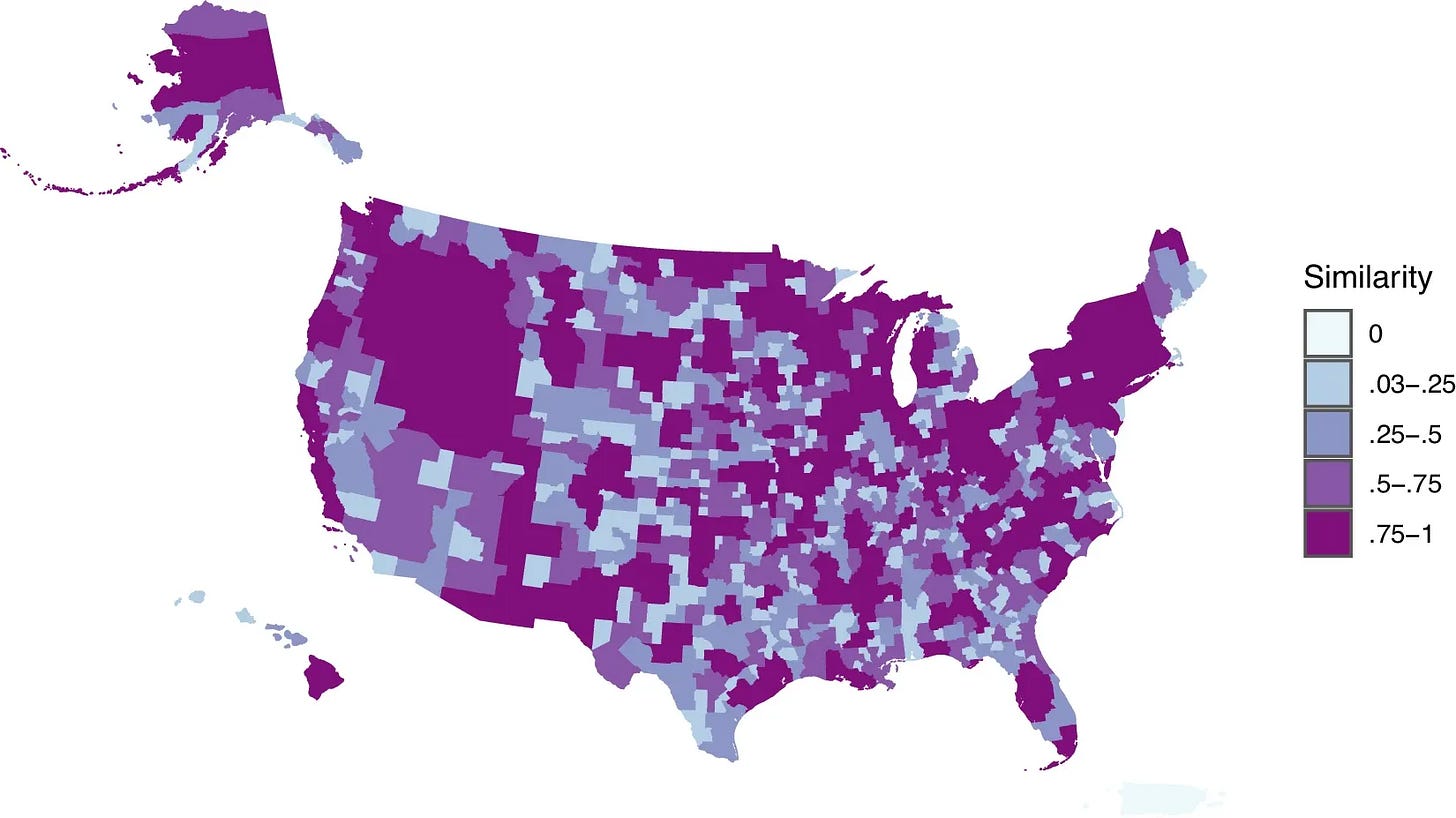
A study in Scientific Data introduces an updated dataset of commuting zones (CZs) for the US, designed to reflect the changing patterns of where people live and work, especially after the COVID-19 pandemic.
The data and scripts used in the study are available here.
4. GCoM climate and energy datasets
The GCoM dataset is a collection of climate action plans from over 6,800 cities participating in the Global Covenant of Mayors for Climate & Energy (GCoM). This dataset includes detailed information on how these cities aim to reduce greenhouse gas emissions and adapt to climate change.
The GCoM dataset collection has been published in the JRC data repository.
Other useful bits
I previously discussed Meta’s Segment Anything Model (SAM) 2 and how this a big deal for the geospatial community. This video tutorial from Open Geospatial Solutions shows how to segment objects from timeseries with SAM2. You can also access the Python package via Github here, and the notebook here.
Recent satellite images on Google Maps have reignited interest in the missing Malaysia Airlines Flight MH370. The images show what appears to be an aircraft in a pretty remote area…so could this be the lost plane?
Launched a month ago, ESA’s Arctic Weather Satellite captured its first images, which included Storm Boris in the Atlantic Ocean. The satellite is designed to improve weather forecasting in Arctic regions by providing more frequent and detailed atmospheric data, so these initial images really validate the satellite's capabilities.
Google Earth announced updates. A new home screen will make it easier to organise and share projects via Google Drive; we can now import our own KML datasets and access to historical images is now available on web and mobile. This is already more impressive than Apple’s latest Event 2024.
Ocean Ledger introduced its Restoration Suitability Index Tool — a resource for coastal ecosystem restoration. It’s designed to predict the best areas for coastal ecosystem restoration, reduce risks and costs for coastal resilience initiatives.
Jobs
Google Deep Mind is looking for a Research Engineer under their Geospatial AI team.
The UN Office of Legal Affairs is looking for a Geospatial Information Assistant under their Division for Ocean Affairs and the Law of the Sea.
The UN OCHA Centre for Humanitarian Data is looking for a Data Manager who will manage their Humanitarian Data Exchange (HDX) platform.
The Swiss Federal Institute of Technology in Lausanne has a PhD position open for Nightlights image analysis for humanitarian applications.
Amazon Web Services is looking for a Solutions Architect who will be within the AWS Aerospace and Satellite Services organisation.
The United Nations Environment Program is looking for a data scientist based in Nairobi.
Chapman Tate is looking for 2 GIS Specialists who will be based in Dublin.
Arup is seeking Geospatial graduates for its Geospatial Graduate Development Programme in Dublin, starting in September 2025.
That’s it for this week.
I’m always keen to hear from you, so please let me know if you have:
new geospatial datasets
newly published papers
geospatial job opportunities
and I’ll do my best to showcase them here.
Yohan


