

🌐 Identifying the global economic elite
PLUS: Using fiber optic cables to measure seismic activity, a new tool from IBM to finetune geospatial foundation models and more.

Hey guys, here’s this week’s edition of the Spatial Edge, where the aim is to make you a better geospatial data scientist in less than 5 minutes a week.
If you’ve given out this toy to everyone you know for Easter, then I’ve got good news for you — you’ve come to the right place.

In today’s newsletter:
Elite Mapping: Find out who holds economic power across 16 nations.
Urban planning: Using fibre optic cables as seismic sensors.
Terra torch: A new toolkit from IBM to finetune geospatial foundation models.
Carbon Offsets: Global map of 575 nature-based projects.
Trade Flows: Disaggregated global input-output dataset released.
Research you should know about
1. Identifying the economic elites within countries

In the 19th century, many countries, particularly in Europe, were run by the aristocracy. Fast forward to today, most monarchs (if they’re still around) are mainly ceremonial figures. Instead, the economic ‘elites’ are now defined by other things.
E.g. in the UK, the US or France, it might be if you’ve attended Oxbridge, the Ivy Leagues, or the grandes écoles. Or it might be that you’re a politician or business leader.
The point is, economic elites now look different for each country. But they still have an inordinate influence over the economic and political environment of the countries they live in.
A new paper, published in the British Journal of Sociology, by an consortium of 70+ researchers, has tried to systematically map who hold economic power in 16 countries.
But first, how do they define ‘economic elites’? They do this in three ways:
Organisational power: control over a company’s resources, either through ownership or by running its operations.
Market power: the ability to influence prices, block competition, or limit workers’ demands by using size or wealth.
Regulatory power: influence over economic rules—shaped through lobbying, donations, legal action, or informal political ties.
They then painstakingly map over 3500 individuals to come up with an indication of the demographics of the economic elite.
Their findings (so far) can be summed as the following:
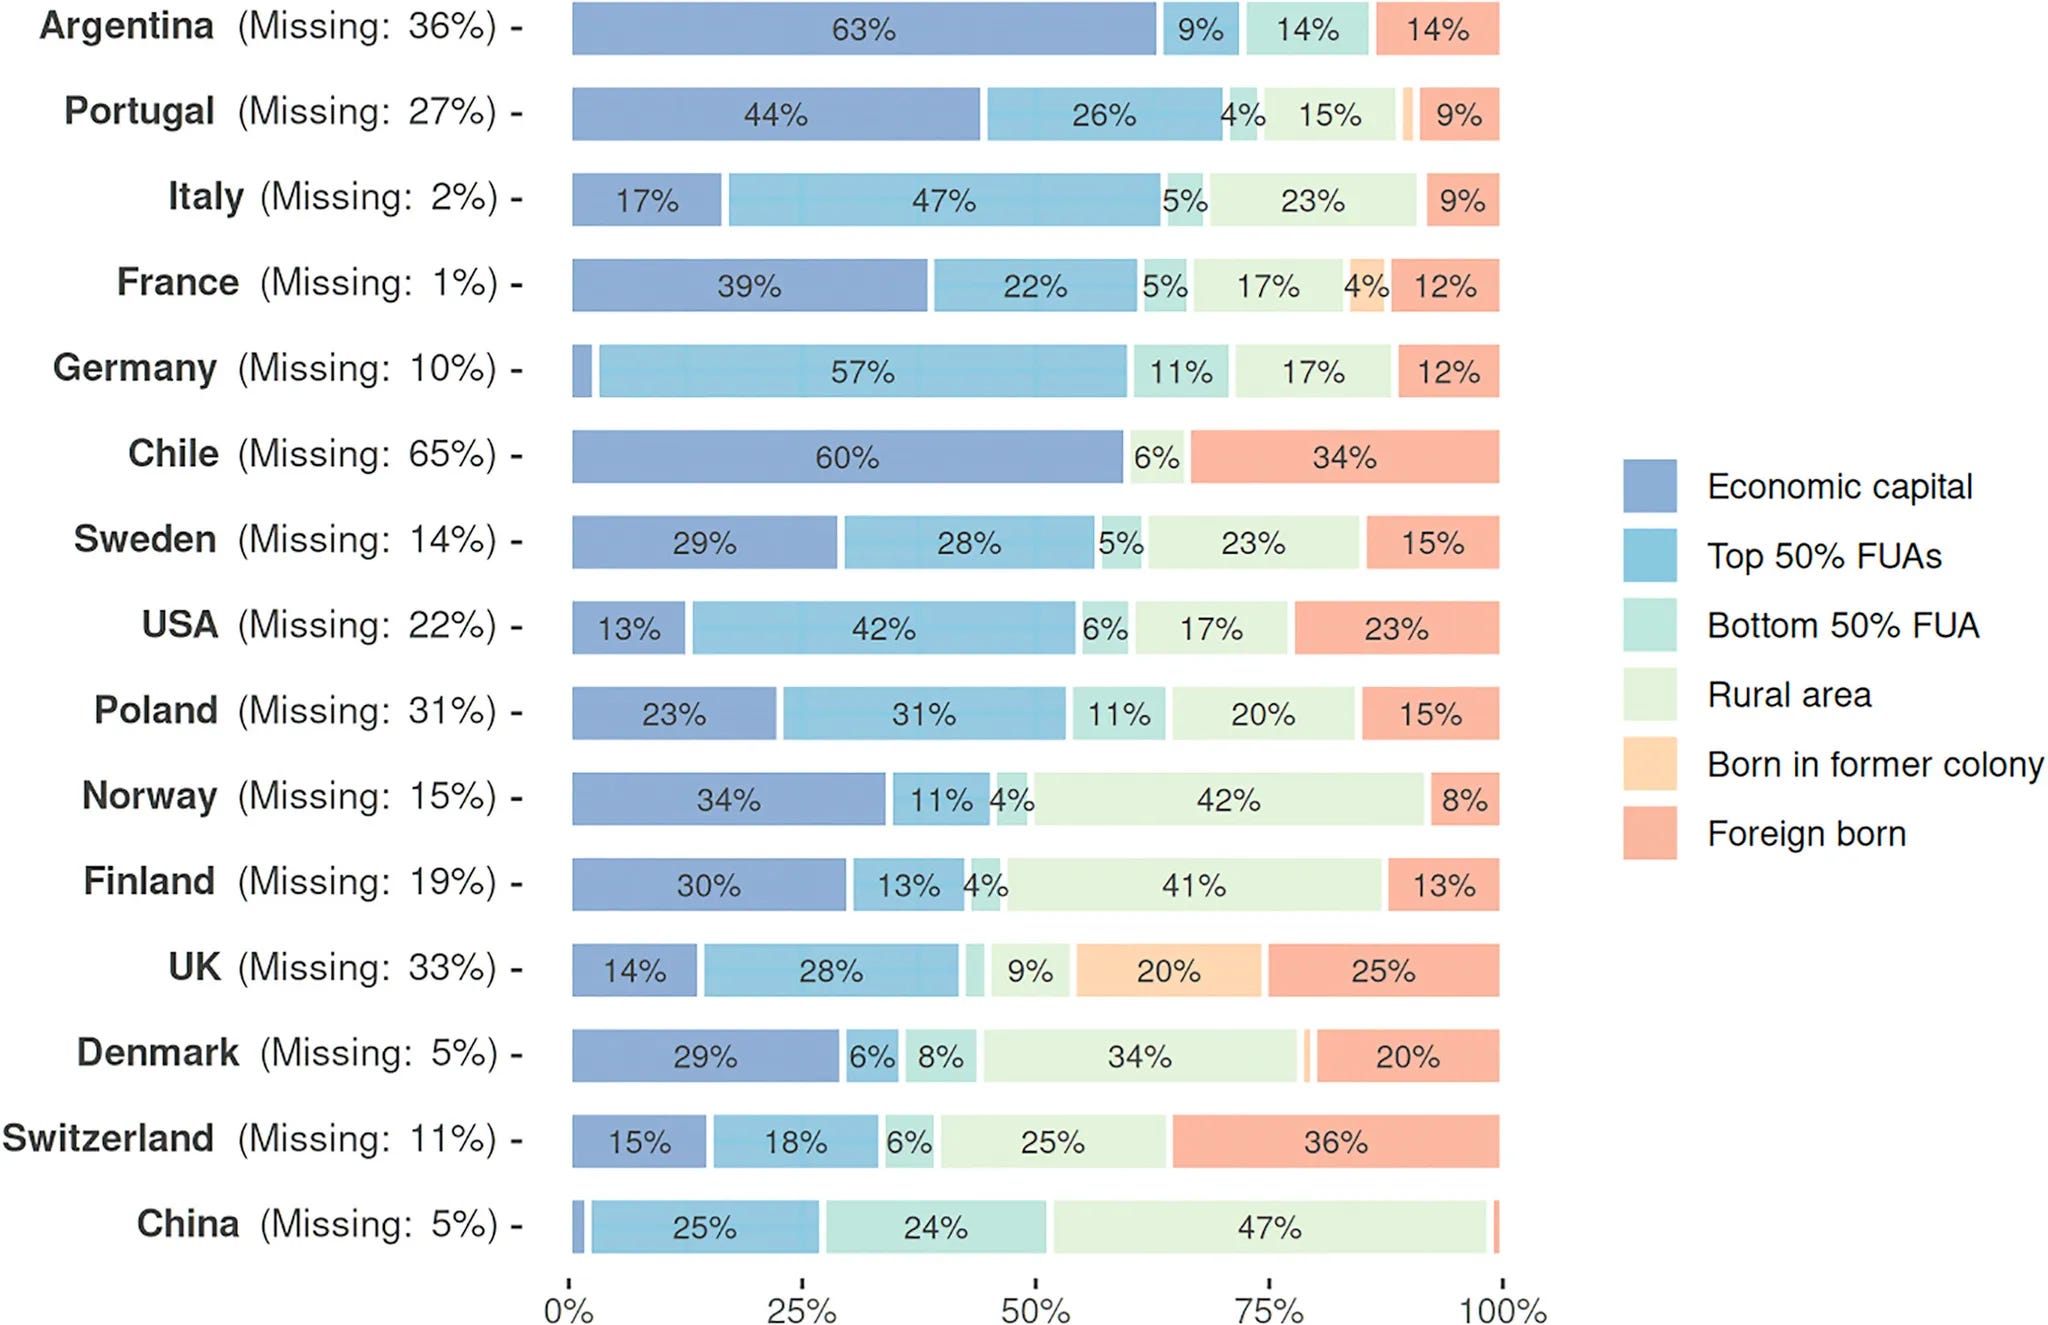
Age: The US has the oldest economic elite, with a median age of 62. The UK and France are close to the European average (mid-to-late 50s). China stands out for having a younger elite with many under 40. In most countries, business elites are younger than regulators, except in China and Poland where regulators are the older group.
Gender: Across all countries, men dominate. In the UK, France, US, and China, women are underrepresented in economic elite roles. Compared to national parliaments and corporate boards, women’s presence is lower in this top group. The gender gap is smaller in countries with stronger gender equality overall. Interestingly, in the US and Denmark, women in elite roles tend to be older than men, suggesting they may need longer to reach the top.
Place of birth: Most elites are native-born. China is highly national (only 1% born abroad), while the UK and US have far more foreign-born elites (about 20–45%) reflecting openness to international talent. UK elites also reflect its imperial history and global business networks. In terms of birthplace within countries, elites tend to come from major economic hubs. But countries like Germany and the US show more geographic diversity, with elites coming from multiple regional centres.
Education: Higher education is the norm. In the UK, a bachelor’s degree is often enough, while in France, elite degrees from grandes écoles are common. China’s and Germany’s elites are highly credentialed, with many holding PhDs, especially in economics, law, or other technical fields. Business, economics, and engineering are the most common disciplines. In China and Finland, technical skills dominate; in the UK and France, humanities and law still play a major role (which I’m guessing is a function of the main courses studied by the elite in Oxbridge and the grandes écoles).
The main caveat with this work is that the results are still preliminary, and that for now, it only covers 16 countries. I’m currently reading a book on elite families in SE Asia, so I’d be very keen to check out the data for this region once it’s available.
Anyway, you can check out the full methodology and country breakdowns at worldelitedatabase.org.
2. Using seismic signals from fiber optic cables for urban planning

A new study published in Nature Communications explores a pretty interesting approach to urban sensing by repurposing existing fibre-optic telecommunication cables to detect and map urban seismic activity. Pretty wild right?
They’re able to transform fibre optic cables into a dense seismic sensor network, which can help with monitoring stuff like traffic flow, construction activities, and public gatherings.
They used Distributed Acoustic Sensing (DAS), which sends laser pulses through fibre-optic cables to detect vibrations caused by seismic waves. They analysed data collected from 50 kilometres of telecommunication cables in San Jose, California, creating a network of 50,000 virtual sensors spaced at one-metre intervals. Combining seismic interferometry (which uses ambient seismic noise to study wave propagation) and beamforming (a technique to pinpoint the source of waves), the researchers generated detailed maps showing the locations and intensities of urban seismic sources over time.
The study successfully identified specific events such as vehicle movements, construction activities, and even routine school schedules by accurately locating seismic sources up to 2 kilometres away from the cables. They found that seismic intensity correlated strongly with environmental noise levels and various urban features such as land use types, traffic density, and demographic patterns. The use-cases could be pretty helpful across urban planning, environmental monitoring, traffic management, and disaster preparedness.
The code is available here.
Geospatial Datasets
1. Nature-based carbon offset project dataset

A new open-access database maps the boundaries of 575 nature-based carbon offset projects across 55 countries. The dataset includes avoided deforestation, reforestation, and improved forest management projects, collected via carbon registries, direct outreach, and manual georeferencing. You can access the data here.
2. High-res surface pCO2 data

pCIBR is a new long-term surface pCO₂ dataset for the Indian Ocean at 1/12° resolution (1980–2019), corrected using XGBoost and in-situ observations. You can access the data here and the code here.
3. Disaggregated multi-regional input-output dataset

FIGARO-E3 is a high-resolution multi-regional input-output (MRIO) database for 2015, extending the official Eurostat FIGARO tables to 176 industries and 213 products. It includes harmonised labour, energy, and greenhouse gas (GHG) emission accounts, aligned with OECD, IEA, EDGAR, and Eurostat data. You can access the data here and the code here.
4. Global cropland water-use efficiency dataset
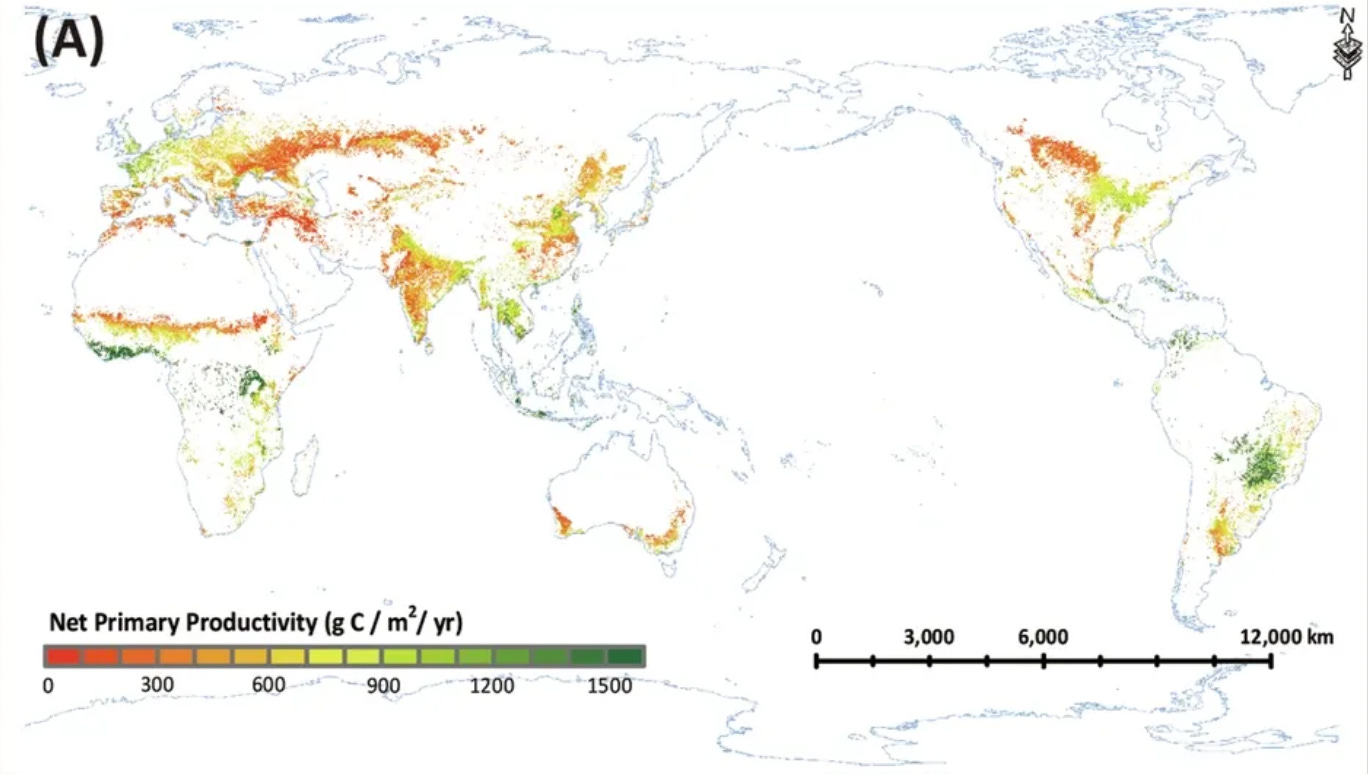
GCWUE is a 1-km resolution global dataset of cropland water-use efficiency (WUE) from 2001 to 2020, measuring the ratio of net primary productivity (NPP) to evapotranspiration (ET). You can access the data here and the code here.
Other useful bits
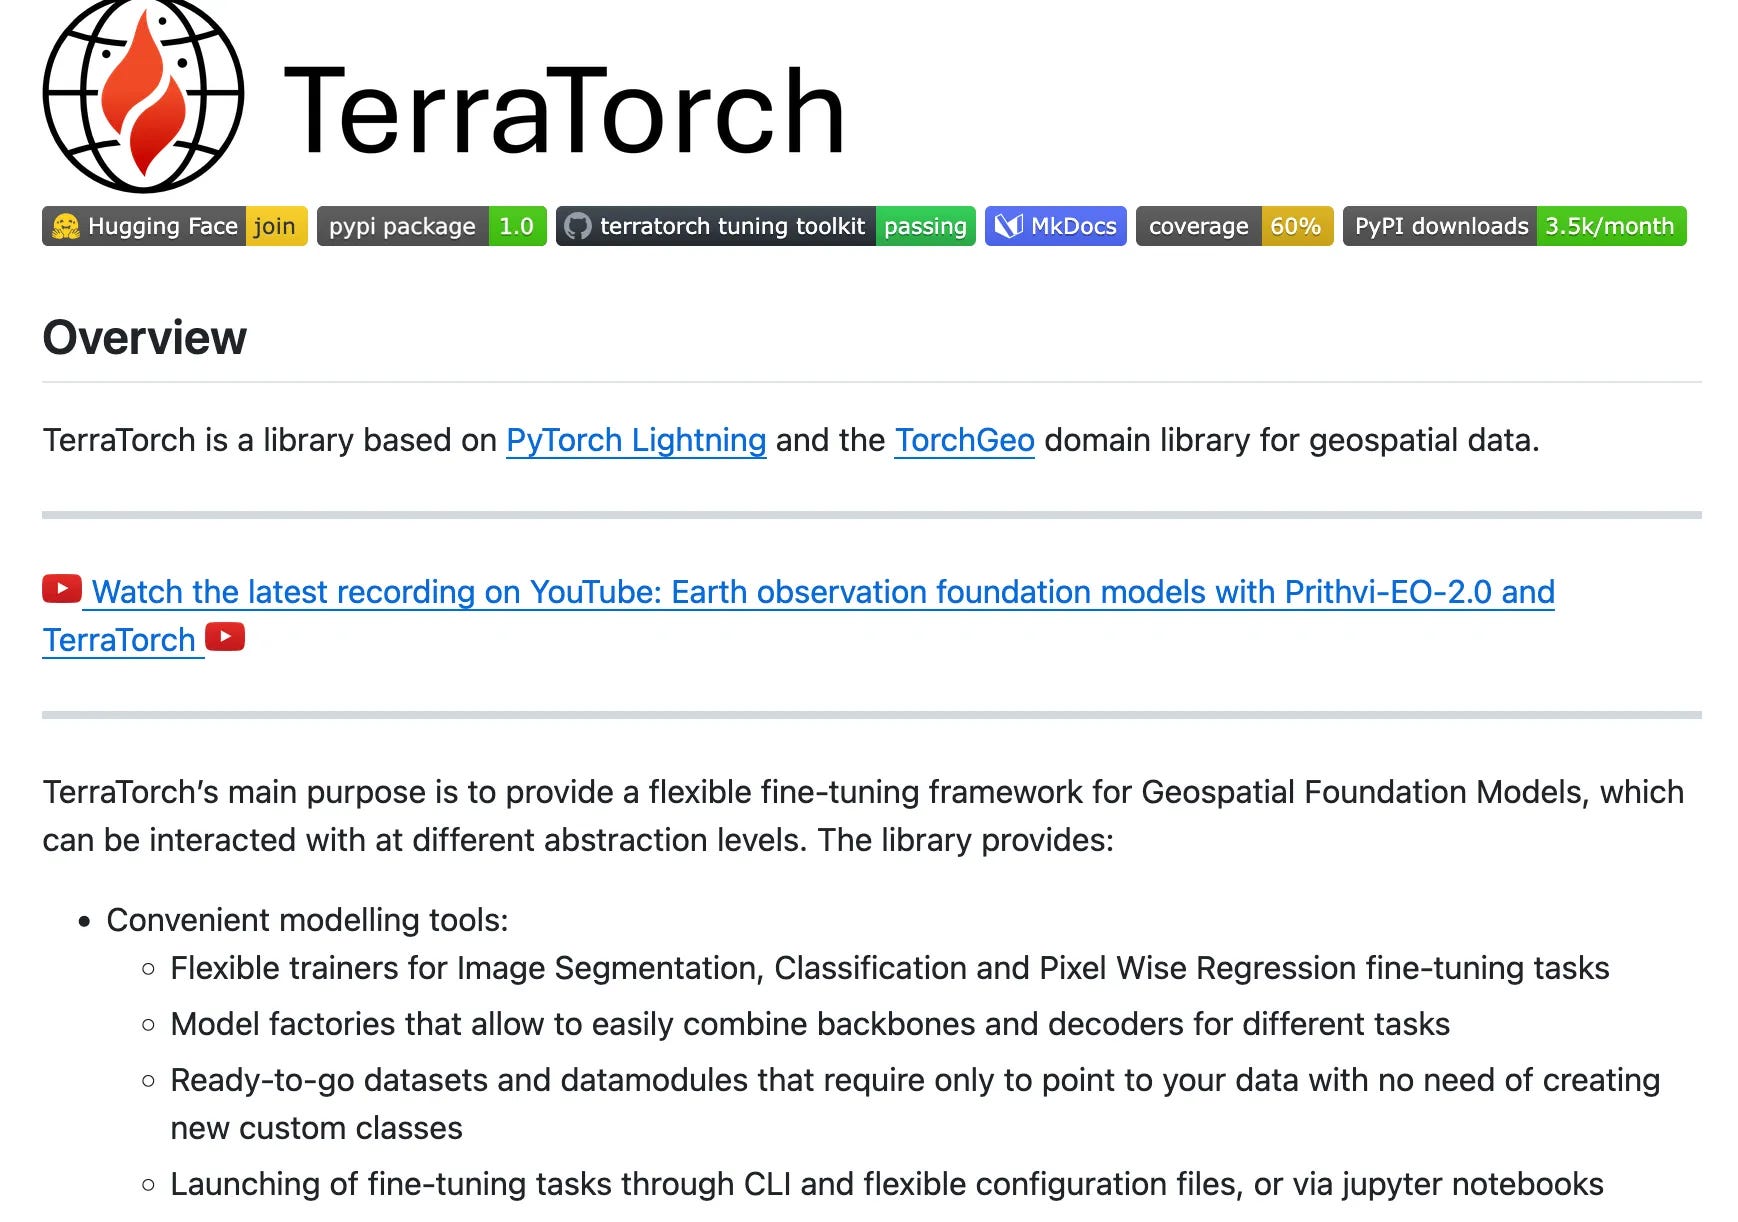
IBM just dropped TerraTorch, a toolkit that makes it easier to fine-tune geospatial foundation models for tasks like land cover mapping and disaster response. Built on PyTorch Lightning and TorchGeo, it’s modular, low-code, and includes an auto-tuning feature to streamline training. Check out the code here.

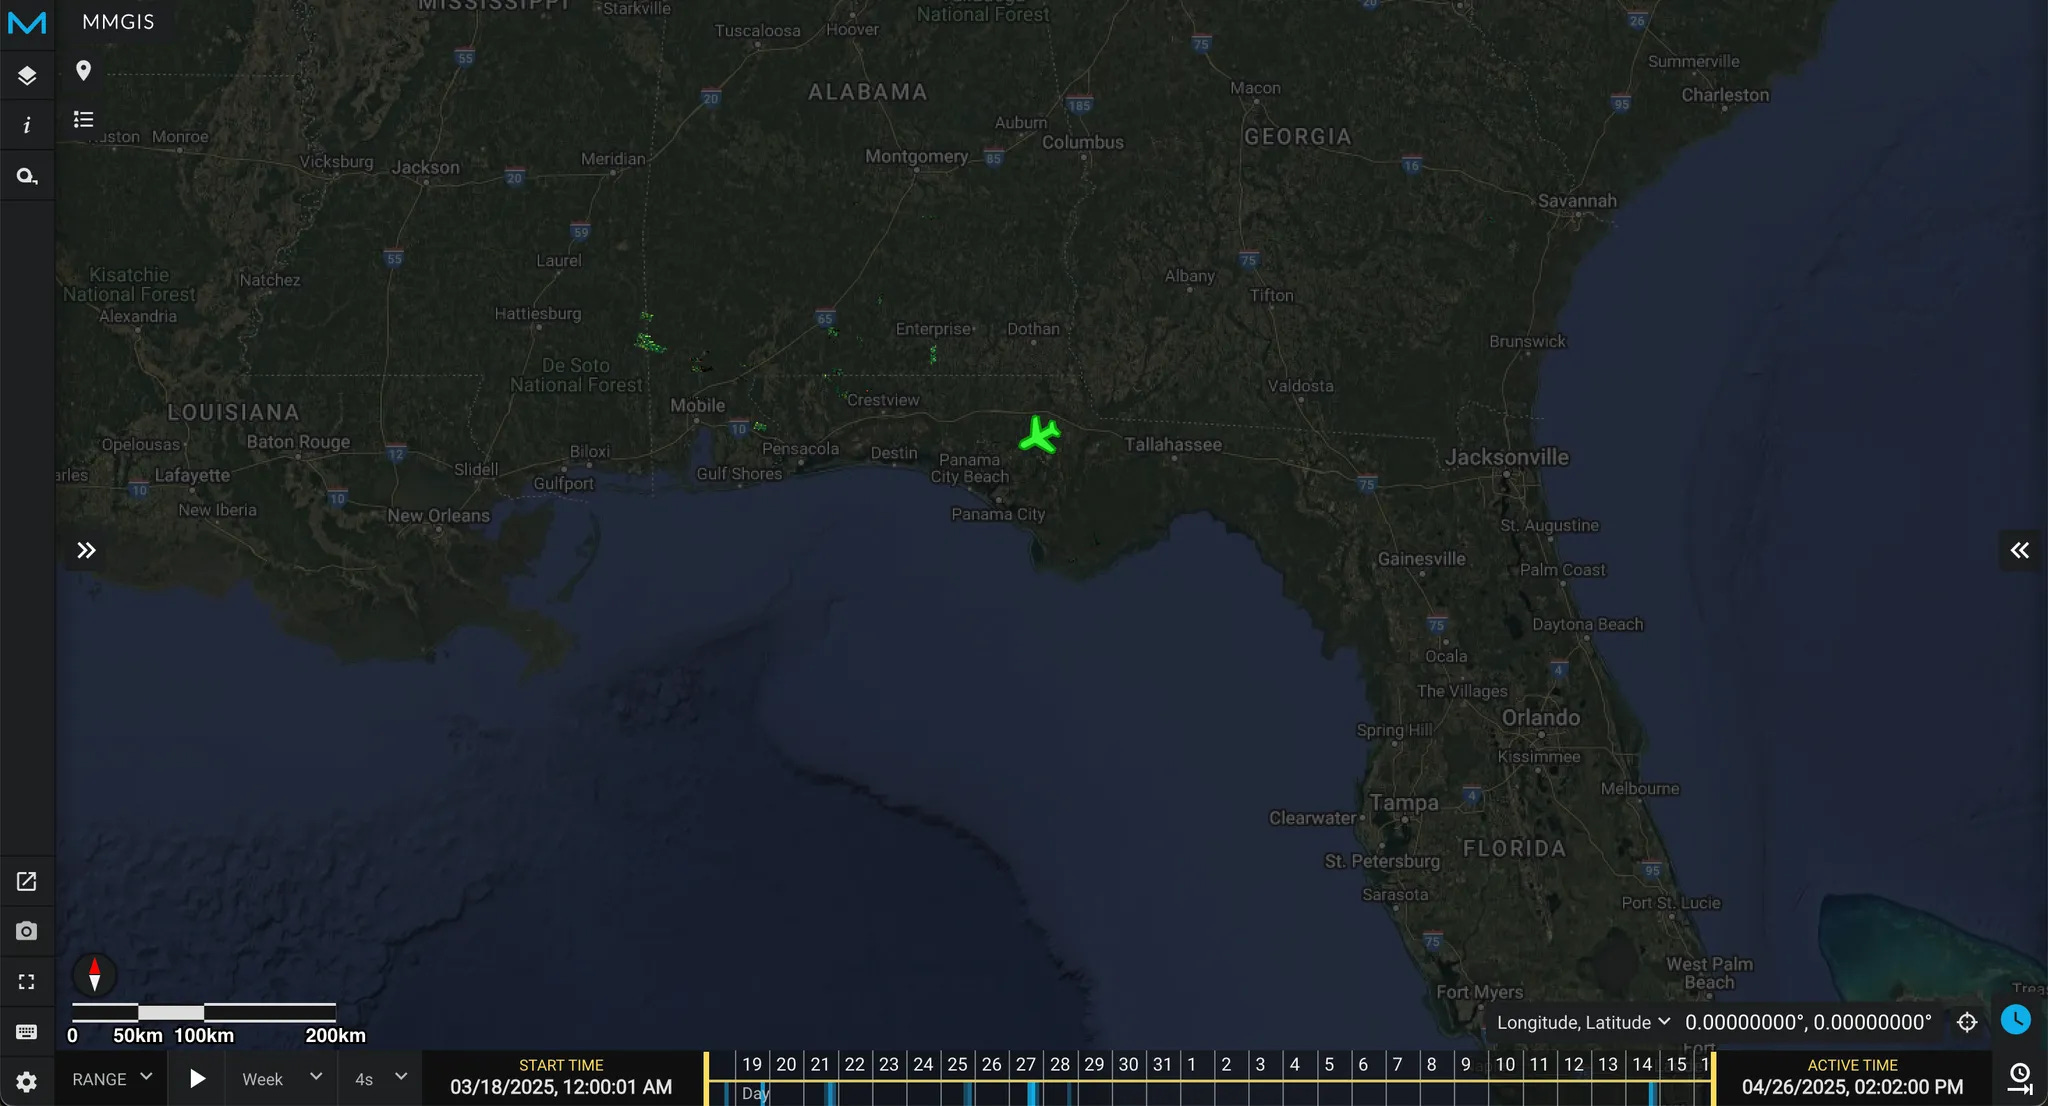
NASA’s FireSense spring 2025 campaign has been capturing airborne data over active wildfires in Texas, Alabama, and Florida. Despite recent challenges, including wildfires affecting the NASA JPL AVIRIS team, they’ve already mapped unknown fire starts and are testing new real-time fire data products.
Google Maps Platform now offers road-level details in the Maps JavaScript API, Maps SDKs, and Navigation SDKs. This now includes a bunch of features like sidewalks, lane markings, crosswalks, and park pathways.
Jobs
Thomson Reuters is looking for a GIS Analyst in Gdansk.
SkyGEO is looking for a Lead InSAR Engineer in Delft (but open to remote work).
CGI is looking for a Project Manager under their Space Division in Darmstadt.
Planet is looking for a Product Specialist for their Natural Lands team in San Francisco.
McKinsey is looking for a Geospatial Data Scientist for agriculture analytics in Brussels.
The FAO is looking for a Geospatial Data Scientist in Bangkok.
Microsoft is looking for a Research Sciences Resident (AI for Good) Intern in Nairobi.
Just for fun

As those of you who’ve lived in the UK know, you get a cloud-free day once every five years or so. So this image from Sentinel-3 is pretty rare. You can see the green lowlands to the Scotting Highlands.
That’s it for this week.
I’m always keen to hear from you, so please let me know if you have:
new geospatial datasets
newly published papers
geospatial job opportunities
and I’ll do my best to showcase them here.
Yohan