

🌐 Is Bitcoin impacting our health?
PLUS: WorldPop extends its data to 2030, mapping pesticide exposure, and more.


Hey guys, here’s this week’s edition of the Spatial Edge — a weekly round-up of geospatial news. We’re a bit like Tensorflow — some people still think we’re kinda cool, but nobody else gets it. In any case, the aim is to make you a better geospatial data scientist in less than 5 minutes a week.
In today’s newsletter:
Bitcoin Mining: Air pollution linked to crypto energy use.
Pesticide Exposure: Mapping a decade of environmental risk.
Elevation Models: New super-resolution approach improves resolution by 4x.
Population Data: WorldPop extends global estimates to 2030.
Seafloor Mapping: A new global effort to map the ocean floor.
Research you should know about
1. The hidden costs of Bitcoin mining on air quality

As the whole world wonders what the future of globalisation, tariffs and the US dollar will be, some folks are ploughing their savings into digital gold — aka bitcoin.
And if you’re anything like me (which for your sake I hope not), then you’ve probably wondered what geospatial data can tell us about crypto. Turns out, it’s quite a bit.
New research published in Nature Communications has been using geospatial data to examine how Bitcoin mining impacts local air quality. This is a pretty novel take. Most of the environmental coverage of crypto focuses on electricity generation. This is the first time I’ve seen the air pollution angle studied.
They got a database of 34 Bitcoin mines, which was compiled by the New York Times. They then estimated each mine’s power capacity and uptime by combining data from:
news reports
press releases
financial disclosures
interviews with mining operators
satellite imagery and land records to confirm site infrastructure
Uptime (i.e. how often each mine operated at or near full capacity) was inferred from company statements, electricity market behavior, and expert assumptions, with results cross-checked through sensitivity analyses. This allowed them to calculate each mine’s annual electricity use during the study period.

They used a modelling tool called InMAP to track the resulting emissions, finding that coal and gas plants accounted for most of the extra power.
Ultimately, they found that nearly two million people were exposed to at least 0.1 μg/m^3 of Bitcoin mine-related PM2.5 pollution, with hotspots in regions such as New York City, the Houston–Austin corridor, and parts of Kentucky and Illinois.
Of course, there’s an argument that this is temporary, and that we’ll eventually move over to more sustainable sources of electricity generation. However, for now, the impact of this energy consumption of pollution is pretty eye-opening.
You can access the code and data here.
2. Mapping ten years of pesticide footprints

A new study published in Scientific Data presents the most detailed national-level dataset to date on pesticide exposure in France, covering land use, air, and water pollution from 2013 to 2022. The study addresses the long-standing lack of spatially and temporally consistent data on environmental pesticide exposure, which is pretty important to public health, biodiversity loss, and agricultural policy.
The researchers compiled a dataset on the sales of 183 pesticide active substances (AS) across all French postal codes, using national agricultural statistics to estimate application rates per municipality. They developed an extended Treatment Intensity Index (eTII), which adjusts for the potency of each substance and the area treated. Air pollution data came from 205 monitoring stations and was interpolated using kriging, while water pollution data from 35,000 stations was harmonised to account for measurement inconsistencies. The final dataset includes yearly and average maps of AS presence in land, air, and water, focusing on 175 substances classified as carcinogenic, mutagenic, reprotoxic, or highly toxic.
They find that over half of France’s population lives in areas where exposure exceeds the national average. Similarly, 27.7% of Natura 2000 protected areas (these are designated for biodiversity conservation) are located in high-exposure zones.
Their dataset also enables inter-annual comparisons: for example, while some active substances have been phased out, others have been newly introduced and are now tracked, creating a dynamic picture of changing risk. This will essentially open up new opportunities to model long-term health and ecological impacts of pesticide exposure.
You can access the code here.
3. A new way of creating granular digital elevation models

A new paper published in Scientific Reports proposes a new method to improve the resolution of Digital Elevation Models (DEMs) using a deep learning model based on normalising flow. This is a type of neural network that basically learns to transform complex data distributions into simpler ones. The authors argue this approach more accurately reconstructs high-resolution terrain features from low-resolution DEM data.
The team trained their model, called DSRFlow, using high-resolution DEM data from Japan’s AW3D30 dataset. These were downsampled to create low-resolution versions and then used as training pairs.
It essentially learns the relationship between low-resolution and high-resolution DEMs. It assumes that, for any given low-res DEM, the possible matching high-res versions follow a certain pattern. This is called a conditional distribution. To make this easier to learn, the model transforms that complex pattern into a simpler one (specifically, a standard Gaussian distribution). Once it learns this transformation, it can generate realistic high-res DEMs by reversing the process.
Using this method, they managed to go from 30m resolution to 7.5m resolution (i.e. a 4x increase in resolution). Results show the DSRFlow model consistently outperformed Bicubic interpolation, SRGAN, and a combined Internal–External learning method across multiple metrics.
On test data from mountainous regions in China, DSRFlow achieved higher PSNR (34.39 vs. 33.77), lower elevation error (MAE: 2.56m), and better structure preservation (SSIM: 0.936). It also generalised well across terrain types (plateaus and hills) and different DEM sources, including ASTER GDEM V3.
As someone who’s now spending a lot of time working on super-resolution, I’ve got to say this is a pretty novel approach. Looking forward to checking more of this stuff out.
You can access the data used here.
Geospatial Datasets
1. Updated WorldPop geospatial population datasets

WorldPop has released updated global population datasets on OCHA’s Humanitarian Data Exchange, covering 2000–2030. I’m a big fan of WorldPop, but was constantly disappointed that the time series finished in 2020. I’m absolutely thrilled it’s been extended out to 2030.
2. Ocean floor mapping data

Seabed 2030 is a global effort to map the entire ocean floor by 2030, led by the Nippon Foundation and GEBCO. You can access datasets via GEBCO here.
3. Digital terrain modeling

GEDTM30 is a new global 30 m resolution digital terrain model built using a fusion of Copernicus DEM, ALOS World3D, ICESat-2, GEDI, and other sources. It includes 15 standard land surface parameters at six spatial scales, with strong performance in forested and urban areas.
4. Bus networks dataset

A new dataset maps bus networks in 299 Chinese cities, offering detailed spatial and structural data on routes and stops. It was built using coordinates from Amap and Baidu Maps.
Other useful bits

Google’s Solar API helps estimate rooftop solar potential using high-res 3D imagery and AI. It’s now available in over 40 countries and can help quickly assess energy savings and installation size.
Thera is a new model for real-time, aliasing-free super-resolution at any scale using Neural Heat Fields. You can try it in-browser with small images and see crisp upscaling. Check out the code here.

ESA’s EarthCARE mission just released its Level-2 data products, unlocking detailed atmospheric profiling based on measurements from its four instruments. The new datasets include both single-sensor and combined products, offering better insights into clouds, aerosols, and radiation
Copernicus is making satellite data even easier to explore with a new STAC Browser and Catalog. This quick walkthrough video shows how users can search, discover, and query satellite imagery faster and more efficiently.
FireSat, the first of roughly 50 satellites designed to track wildfires using AI, is now in orbit. It can detect fires as small as 5x5 metres and sends updates every 20 minutes to help emergency teams respond faster. Testing begins soon, with full rollout in the coming years.

Jobs
SkyGEO is looking for a Lead InSAR Engineer in Delft (but open to remote work).
CGI is looking for a Project Manager under their Space Division in Darmstadt.
McKinsey is looking for a Geospatial Data Scientist for agriculture analytics in Brussels.
The FAO is looking for a Geospatial Data Scientist in Bangkok.
Insight of the week
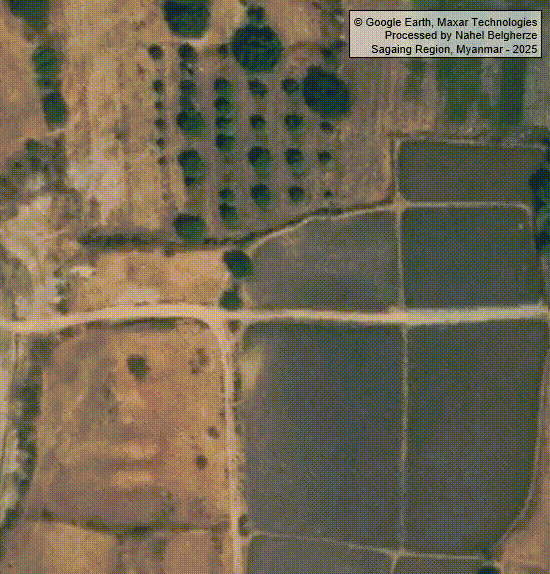
Maxar’s new high-res satellite imagery reveals a ~500 km surface rupture from the Mw 7.7 earthquake in Myanmar, with fault slip reaching up to 5 metres. The images show dramatic changes near the zone of maximum displacement, key data for quake response and research.
That’s it for this week.
I’m always keen to hear from you, so please let me know if you have:
new geospatial datasets
newly published papers
geospatial job opportunities
and I’ll do my best to showcase them here.
Yohan