


Hey guys, here’s this week’s edition of the Spatial Edge, a place where the only thing sinking is your RMSE. Anyway, the aim as usual is to make you a better geospatial data scientist in less than five minutes a week.
In today’s newsletter:
Urban Subsidence: InSAR maps sinking ground in 465 big cities.
Hurricane Economics: Card data shows storms wipe out two days’ sales.
Geospatial Agents: Google’s Gemini agent tackles expert GIS workflows.
Building Age: AI estimates Hong Kong building ages within seven years.
Port Acoustics: 260,932 labelled underwater clips from Valencia’s port.
Research you should know about
1. Mapping how fast the world’s cities are sinking
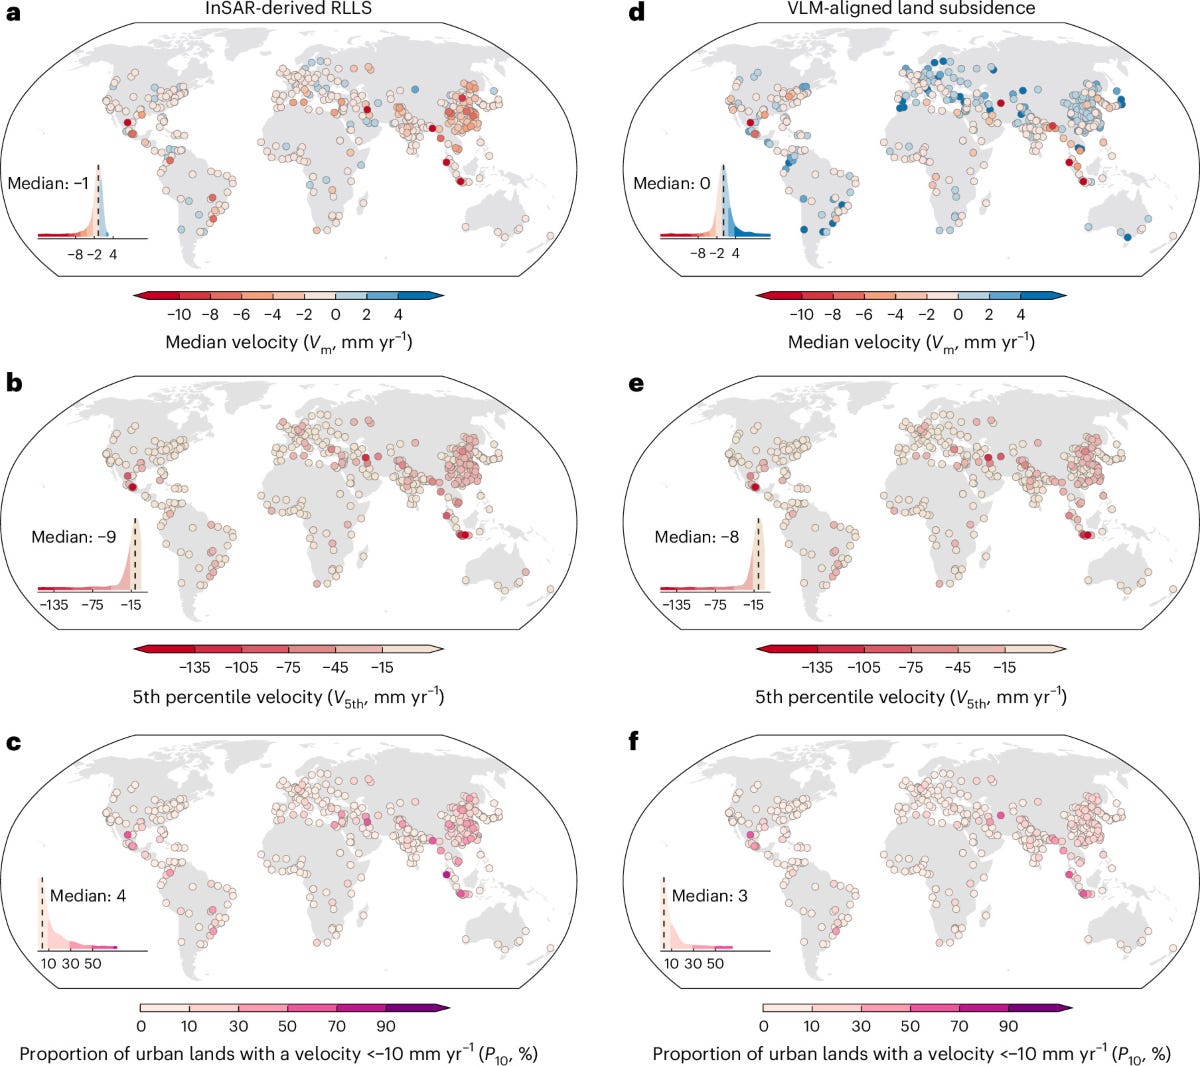
Sinking ground damages infrastructure, makes flooding worse and adds to relative sea-level rise, but there’s been no consistent way of measuring how fast cities are sinking around the world. A new study in Nature Cities led by Peking University fills this gap for the world’s biggest cities.
The team processed Sentinel-1 InSAR data from 2014 to 2023 to map subsidence at 40 m for 465 cities with more than a million people, across 107 countries. They aligned the results to a global vertical land motion product interpolated from GNSS stations, then scored each city on three indicators: its median sinking velocity, the velocity of its fastest-sinking 5% of pixels, and the share of its area sinking faster than 10 mm a year. They also looked at whether sinking was speeding up or slowing down.
Subsidence is most severe in Southeast Asia, West–Central Asia and North America, with parts of Mexico City sinking at about 217 mm a year. Medan (about 33 mm a year), Bandung (22 mm) and Isfahan (11 mm) have the highest citywide medians, while Boston, New York, London, Tokyo and Sydney are broadly stable. Many Southeast and East Asian cities are slowing down, but big chunks of them are still accelerating. You can explore the maps in an Earth Engine viewer, and the code is on GitHub.
2. How hurricanes hit local economies in real time
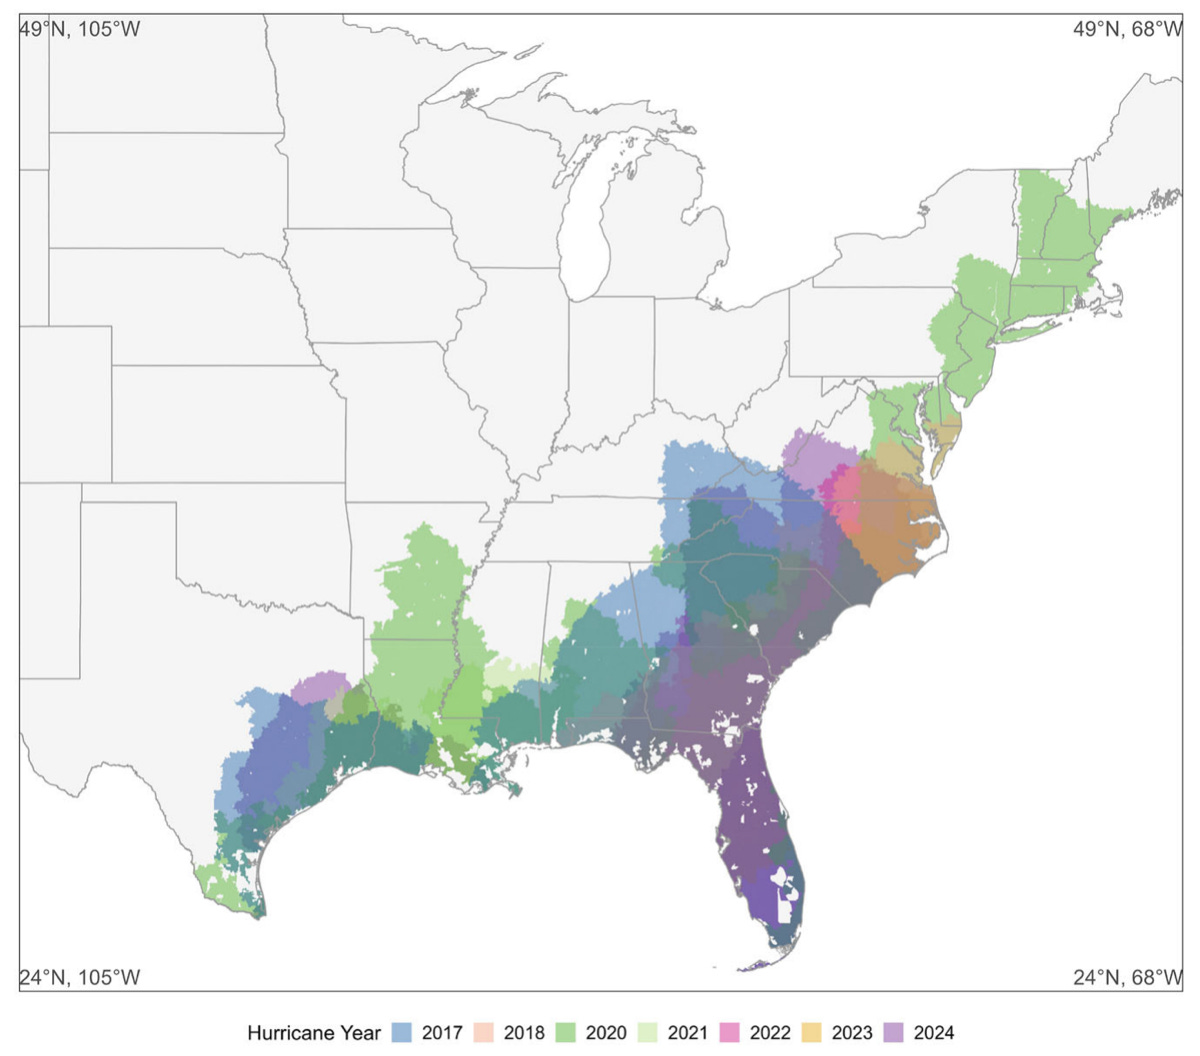
When a hurricane hits, it’s hard to tell how much local economic activity is actually lost versus just shifted elsewhere, and storm category alone turns out to be a poor guide. A new study in Nature Communications from the National University of Singapore, the Mastercard Economics Institute and the World Bank uses card spending data to measure this in near real time.
The researchers tracked daily anonymised Mastercard transactions across 7,987 US ZIP codes hit by 21 Atlantic hurricanes between 2017 and 2024, comparing ZIP codes in each storm’s path with those hit by other storms. They looked at the window from five days before to ten days after each storm’s impact, and linked the changes in sales to physical damage, evacuation orders, power outages and wind.
Daily sales fall 12.4% on average over that window, which is about two days of normal sales or over USD 1.25 billion per hurricane, and they’re back to pre-storm levels within ten days. There’s very little substitution: spending in nearby areas within 100 km falls too, and ATM withdrawals drop by nearly 10%. Damage, evacuations, outages and wind predict losses much better than storm category, and restaurants, retail and home improvement get hit hardest. Independent stores also recover more slowly, with about 25% back to baseline by day two compared with about 50% of chains. The R code is on GitHub.
3. Google’s geospatial reasoning agent put to the test
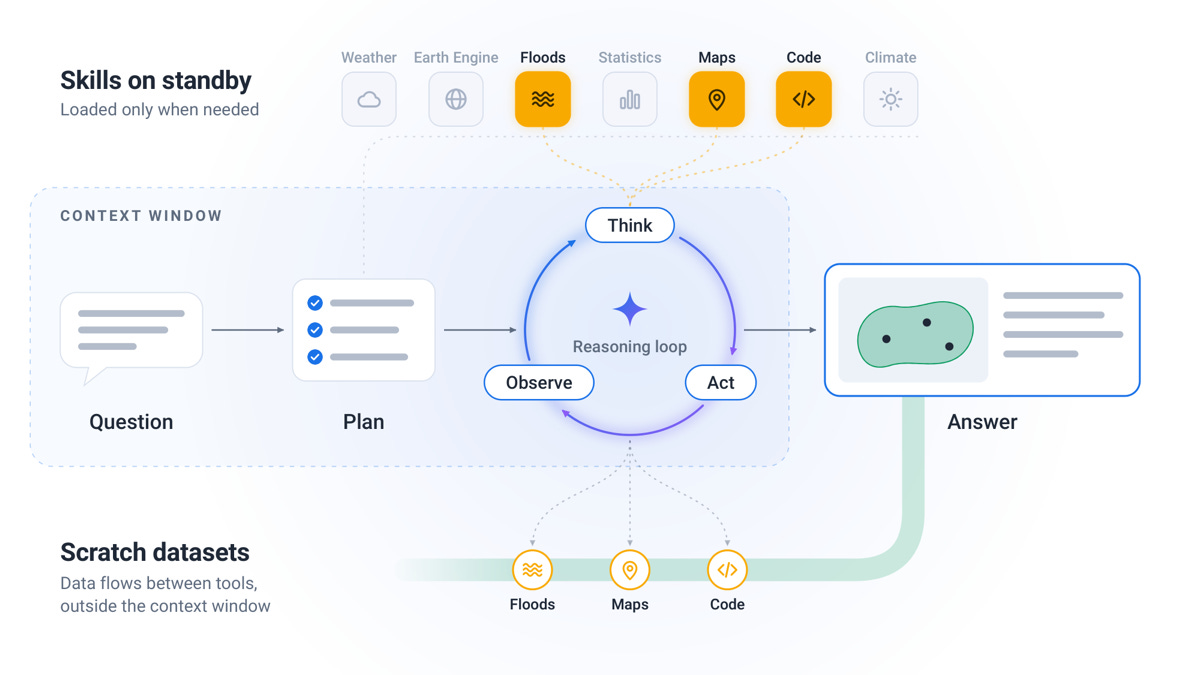
Geospatial questions usually mean pulling together satellite imagery, maps, demographic data and forecasts, and it’s hard to evaluate AI agents doing this because there are lots of valid ways to reach an answer. A new preprint from Google Research and Google Geo introduces Google Earth AI’s Geospatial Reasoning Agent (GRA), along with a way of testing it.
GRA is a Gemini-powered agent that plans its analysis upfront, loads specialised geospatial tools only when it needs them and keeps large datasets outside its context window. Its tools include remote sensing models, population and satellite embeddings, weather and flood forecasts, Google Maps, Earth Engine and Data Commons. To test it, the team built two benchmarks: GeoExpertQueries (101 open-ended problems from practitioners, scored against expert workflows) and GeoKTools (305 templated queries across 24 tool types).
The specialised geospatial tools made by far the biggest difference: on GeoExpertQueries, a standalone LLM scored 0 out of 100 and an LLM with basic tools scored around 3, while full GRA reached 62.7. On GeoKTools, GRA scored 85.9 against 40.5 for the best baseline. Interestingly, the cheaper Gemini Flash model beat the Pro model on all four benchmarks tested while costing 38–71% less. The development splits of both benchmarks are on GitHub, but the agent itself isn’t released.
4. Estimating building age from satellite imagery
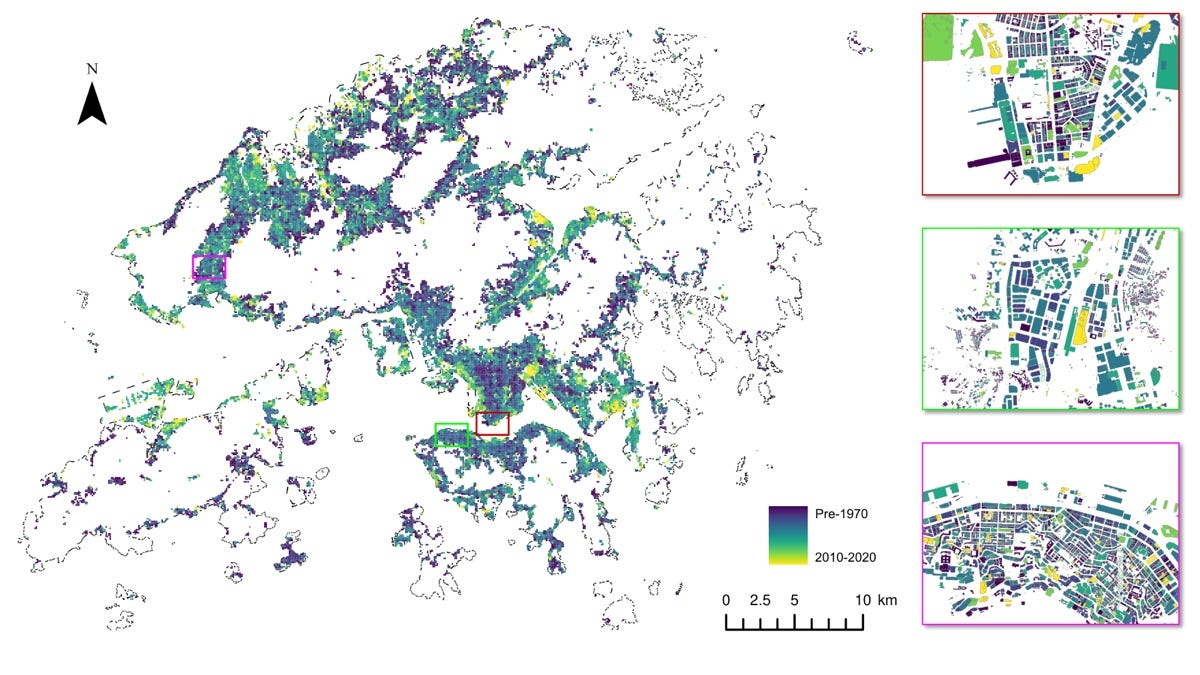
Building age matters for safety inspections, maintenance and disaster planning, but records are often patchy, and most estimation methods need street-view images or construction records that aren’t available everywhere. A new preprint from the University of Hong Kong and partners estimates building age from data that’s widely available instead.
Their deep learning model combines satellite imagery, a digital surface model, land use and building footprints, and uses a loss function that respects the natural order of age classes. It sorts buildings into six age classes (pre-1970, then each decade up to 2010–2020) at both pixel and building level, with a pretrained backbone fusing the inputs and extra modules capturing building shape and height. The loss bakes in the idea that “old” is closer to “middle-aged” than to “new”. They also created a Hong Kong benchmark with 29,958 labelled buildings.
The model estimated building age with an RMSE of 9.69 years and an MAE of 6.70 years, and was then used to map all 315,337 buildings in Hong Kong. Adding the surface model improved pixel accuracy by about 3 percentage points, and accuracy was higher for bigger buildings. The code is on GitHub, and the dataset and model weights are on Hugging Face.
Geospatial Datasets
1. Listening to ship traffic in the Port of Valencia
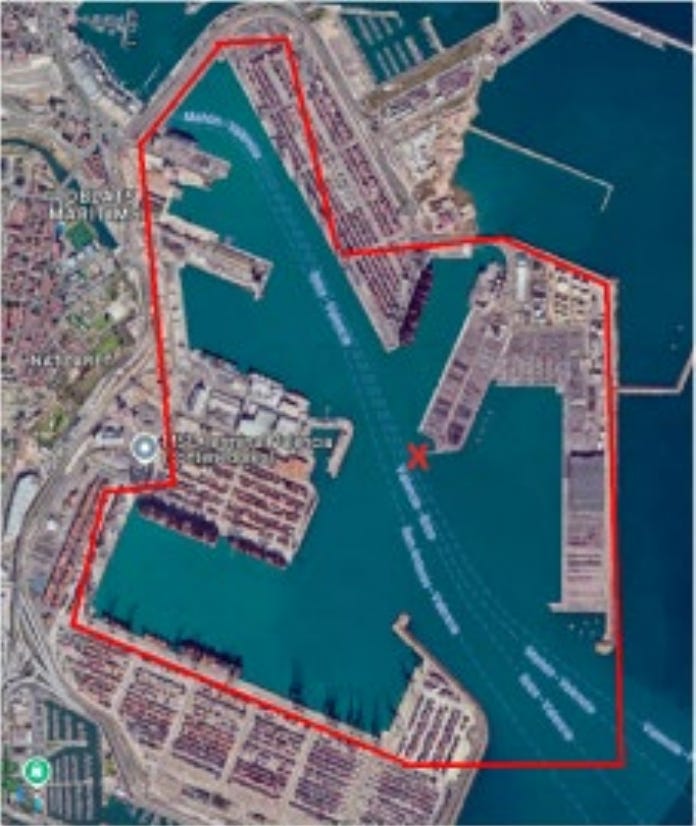
PORTIA contains 260,932 three-second underwater audio clips recorded at 32 kHz over a 26-day campaign in the Port of Valencia, each paired with synchronised AIS vessel data, plus ready-made benchmarks for vessel detection, classification and proximity estimation. You can access the data here and the code here.
2. Real road and rail distances between every pair of US counties

This dataset of inter-county distances gives more than 15.2 million shortest-path distances between counties in the contiguous US along the real highway and railway networks, built from national transport network shapefiles. You can access the data here and the code here.
3. Monthly 250 m drought resistance maps for China
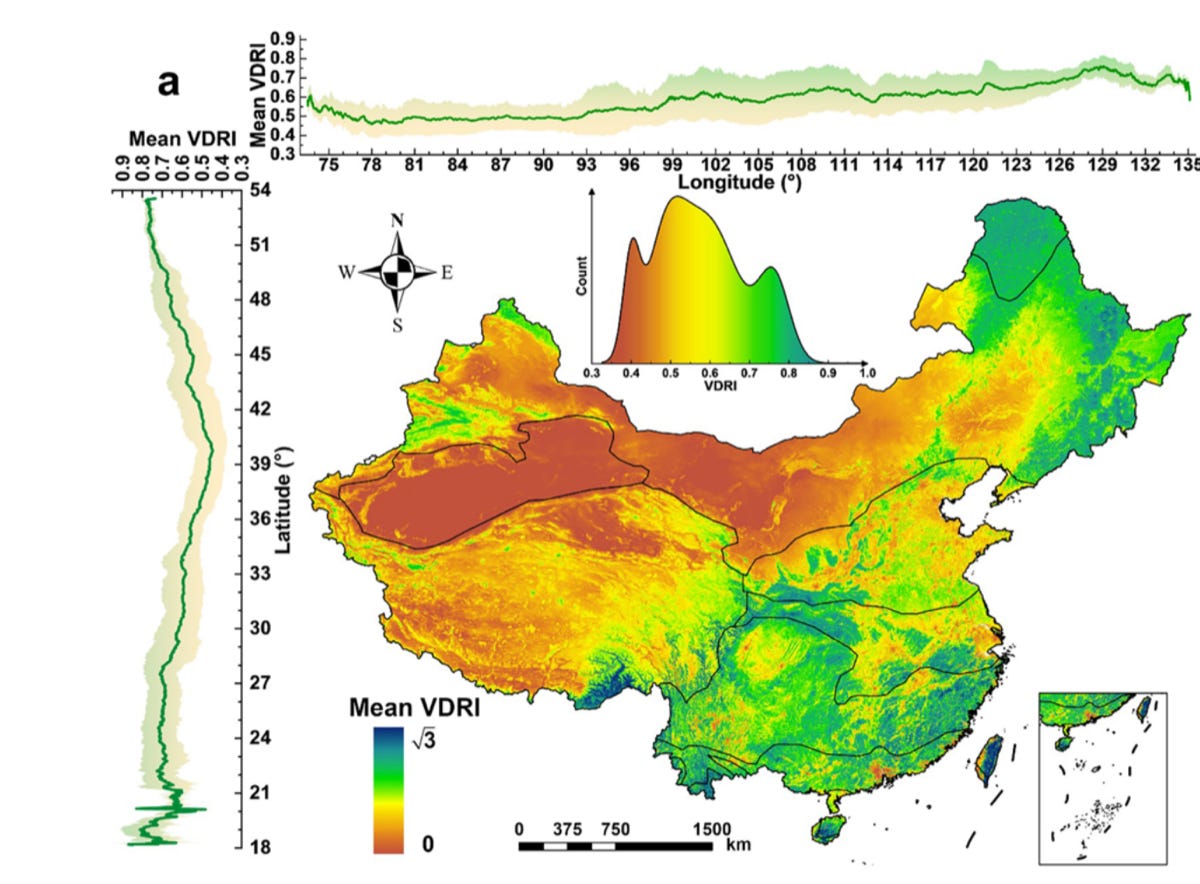
This Vegetation Drought Resistance Index maps how well vegetation across China holds up under drought every month from 2000 to 2022 at 250 m, combining precipitation, runoff, soil moisture, groundwater, land surface temperature and greenness. You can access the data, split across four Zenodo records, starting here and the code here.
Other useful bits
Overture Maps’ 21 October release grows its places layer by 8.5% to 88.4 million features, mostly thanks to BrightQuery expanding into 10 Western European countries. It also adds three new places sources (Uberall, Birdeye and OpenTravel), while buildings stay at about 2.53 billion.
The Copernicus Data Space Ecosystem has launched a new STAC catalogue endpoint built on the open-source SFEOS backend, with faster queries and more queryable attributes. The burst limit rises from 4 to 10 requests per second, and the old and new APIs will run side by side for now.
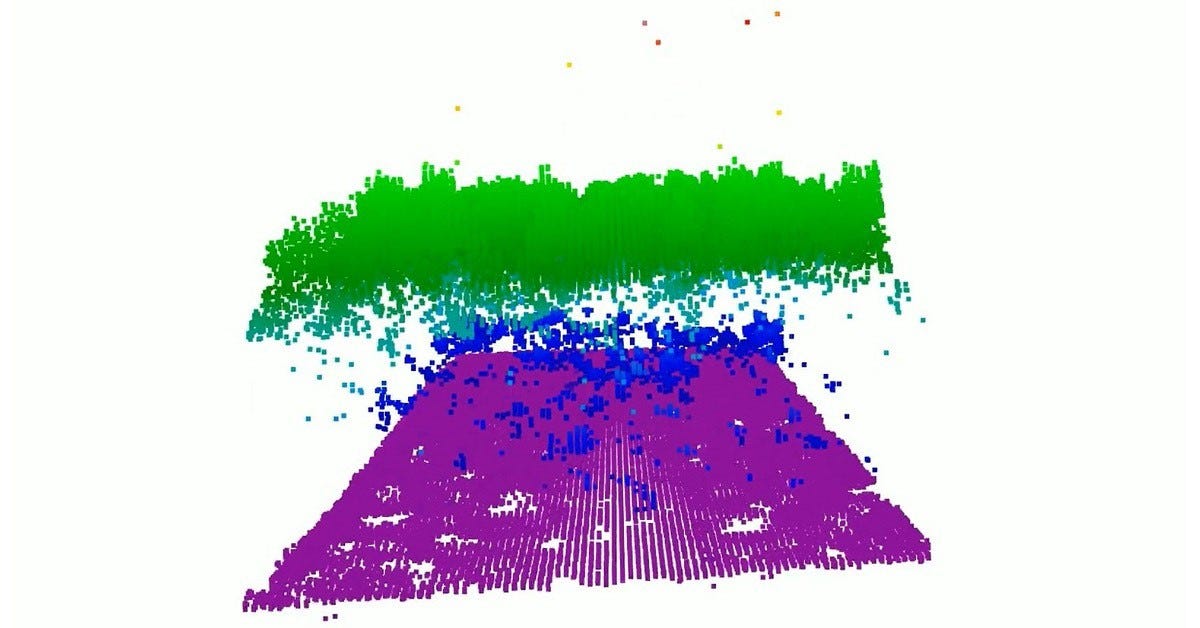
NASA has tested a new lidar called CASALS that steers its laser by wavelength instead of with moving mirrors, so it maps continuous 3D swaths instead of narrow tracks. The airborne prototype picked out individual tree branches and the ground beneath at 22 cm horizontal resolution, and more flights are planned for summer 2027.
ICEYE has launched four more SAR satellites on SpaceX’s Bandwagon-5 rideshare, two of which are for Portugal’s Atlantic Constellation. That brings ICEYE to 84 SAR satellites launched for itself and its customers.

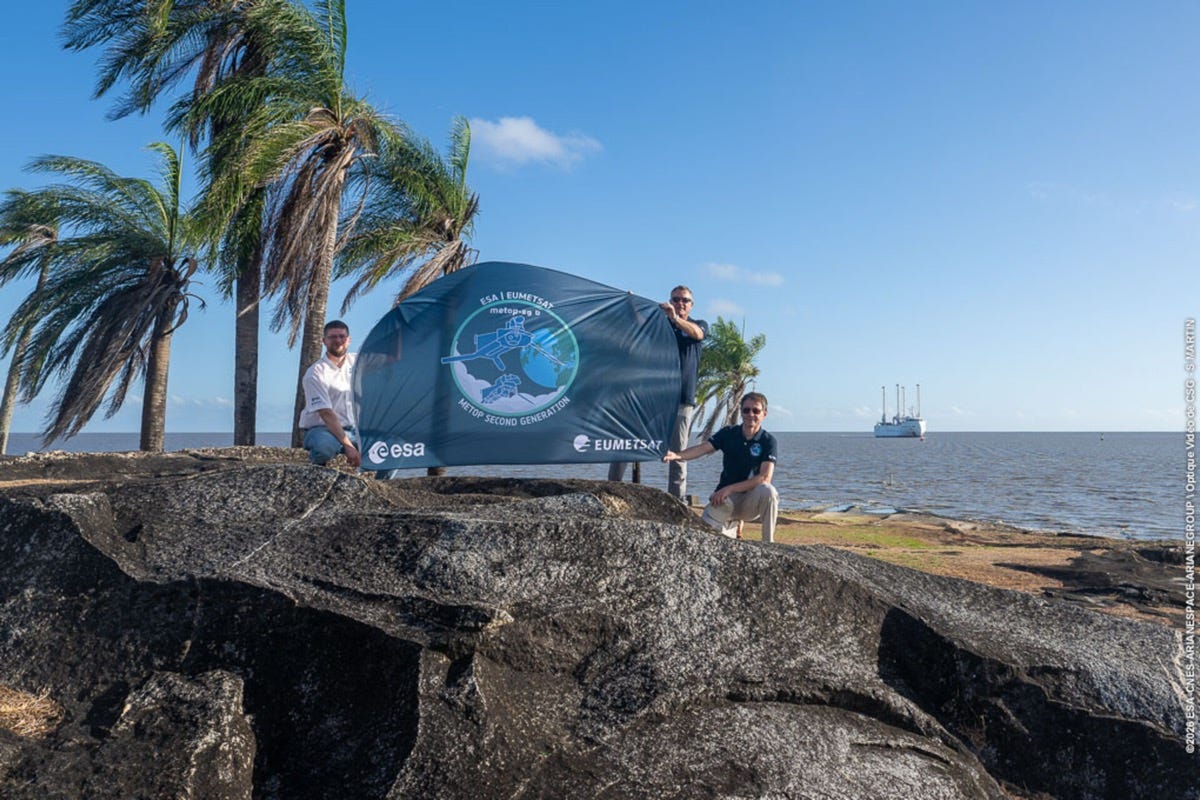
The MetOp-SG-B1 weather satellite has arrived at Europe’s Spaceport in French Guiana after a 10-day crossing on a wind-assisted cargo ship, ahead of an Ariane 6 launch at the end of 2026. It carries a scatterometer for ocean winds and soil moisture, a radio occultation sounder, a microwave imager, an ice cloud imager and Argos-4.
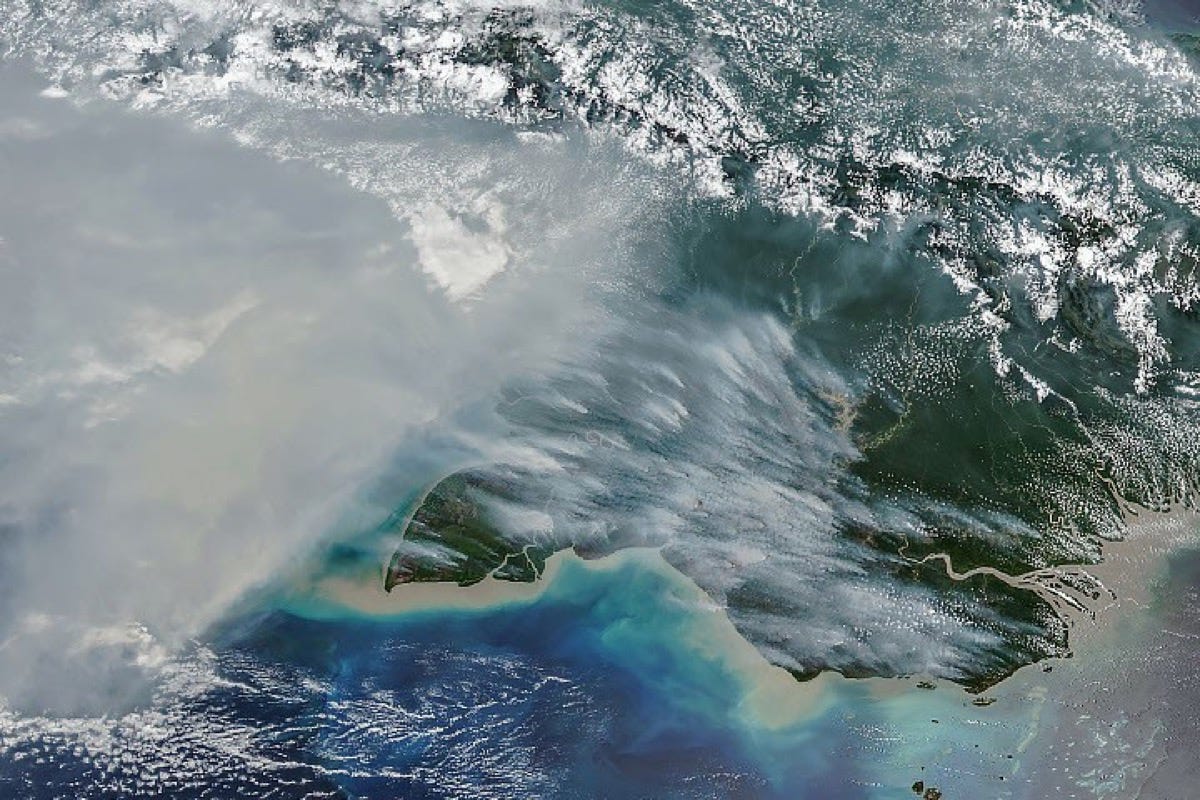
NASA Earth Observatory has mapped fires charring southern New Guinea, where the Trans-Fly region went more than 90 days without rain. By 17 October, fires in Papua New Guinea had released nearly 32 megatons of carbon, a record for that point in the year.
Jobs
Esri is looking for a Principal Product Engineer, Imagery & Remote Sensing based in Redlands, United States.
Overstory is looking for a Staff Product Manager, Machine Learning based remotely in the US, Canada, the UK or several European countries.
EUMETSAT is looking for a Junior Machine Learning Engineer for Earth Observation based in Darmstadt, Germany.
IAMO is looking for a Postdoctoral Researcher in Remote Sensing and Land Degradation based in Halle (Saale), Germany.
ICEYE is looking for a SAR Training Specialist based in Espoo, Finland.
Just for Fun
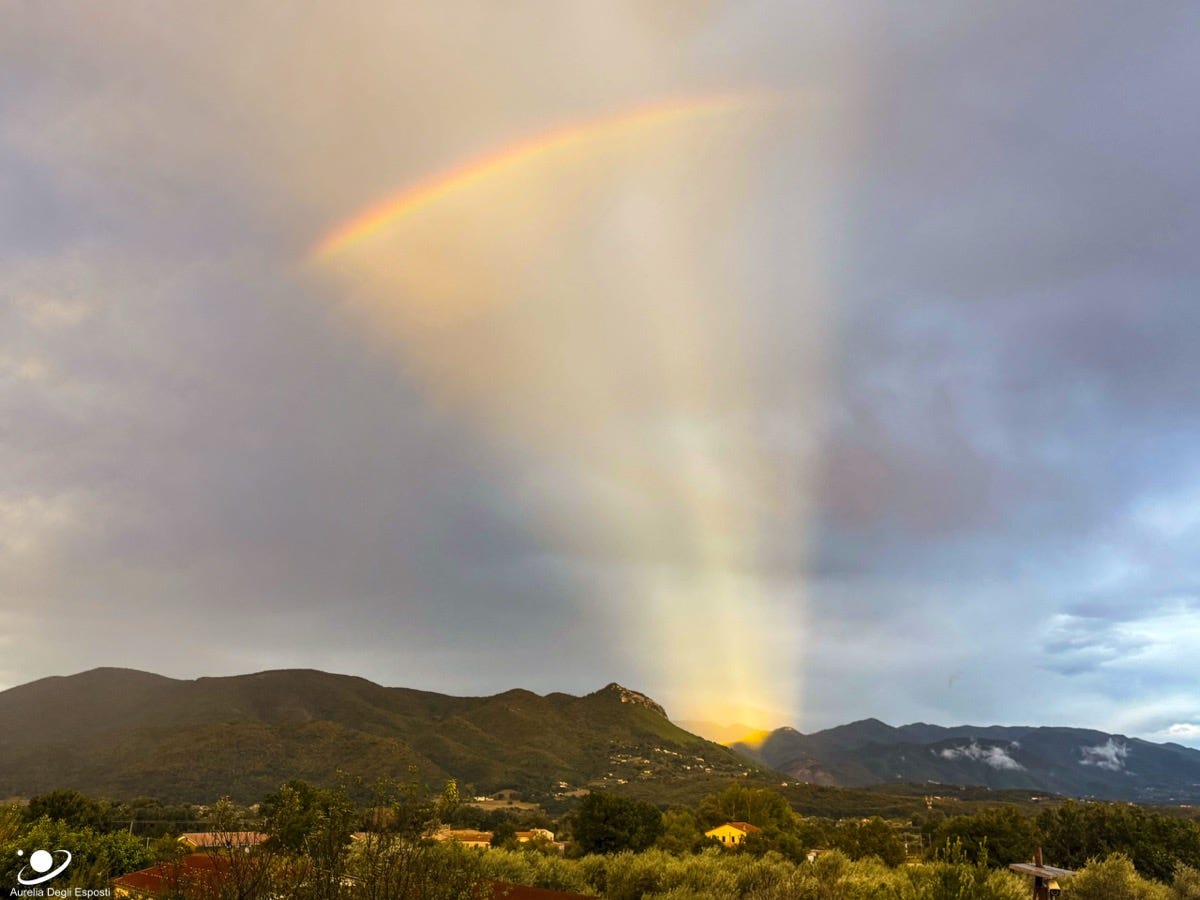
This rainbow only shows up inside a sunlit fan of rays, photographed on a phone at sunset in Presenzano, Italy. It looks like the Sun is just below the hills in front, but rainbows come from light reflecting backwards off falling rain, so the Sun was actually behind the photographer. Gaps in the clouds let sunbeams cross the whole sky and appear to converge on the opposite side, which are called anticrepuscular rays.
That’s it for this week.
I’m always keen to hear from you, so please let me know if you have:
new geospatial datasets
newly published papers
geospatial job opportunities
and I’ll do my best to showcase them here.
Yohan