Measuring disparities in public service access
PLUS: New methods of crop mapping, downscaling climate models, and new datasets on internal displacements.
Hey guys, welcome to this week’s edition of the Spatial Edge — a weekly round-up of geospatial news that you can digest in less than 5 minutes. According to my mum, this is her second favourite geospatial newsletter.
In today’s newsletter:
Spatial Inequalities: Measuring disparities in public service access.
Winter Wheat Mapping: Improved accuracy using deep learning models.
AI Weather Prediction: Enhanced climate data resolution with AI-NWP.
Climate-Smart Agriculture: CSA practices reduce poverty in Bangladesh.
Geospatial Datasets: Key resources for displacement, climate, and agriculture analysis.
Research you should know about
1. Spatial inequalities in access to public services
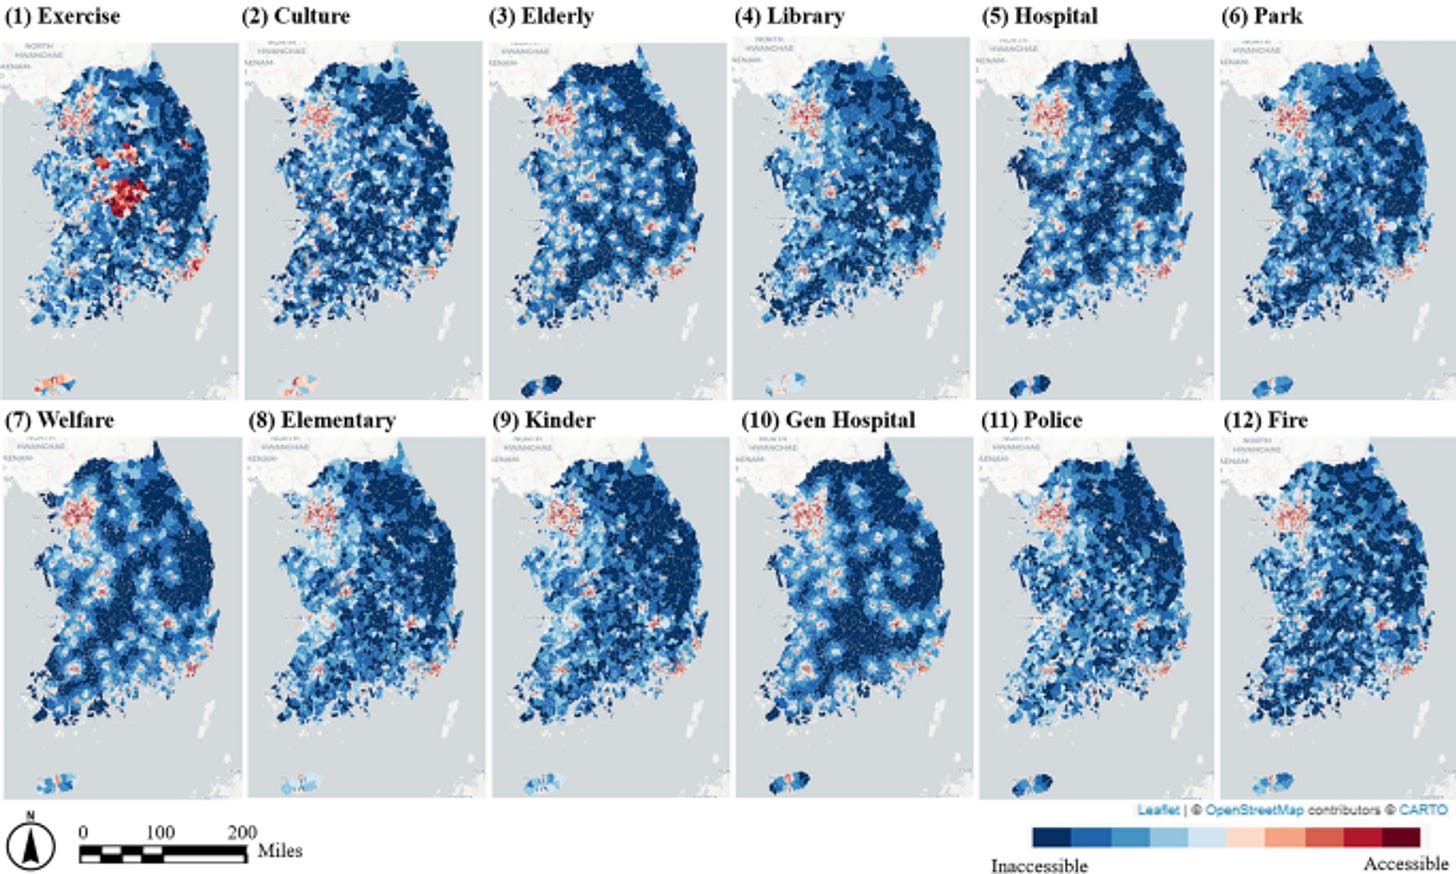
A new study from Scientific Reports looks at transport access to public services in South Korea. They find significant spatial inequality in transport access.
The researchers used 2022 data on transportation accessibility from the National Geographic Information Institute. Using this, they analysed accessibility to four main types of public services:
educational institutions
green and recreation spaces
health and aged care facilities
justice and emergency services
They find that major cities like Seoul, Busan, and Daejeon, have better access to essential services compared to rural and remote areas. They also found that less-wealthy areas (as proxied by house prices), have less accessibility to essential public services.
While these results might seem like a no-brainer, they highlight the need for targeted interventions to improve transportation infrastructure and ensure that rural regions receive the necessary public services.
2. Winter wheat mapping with Sentinel-2
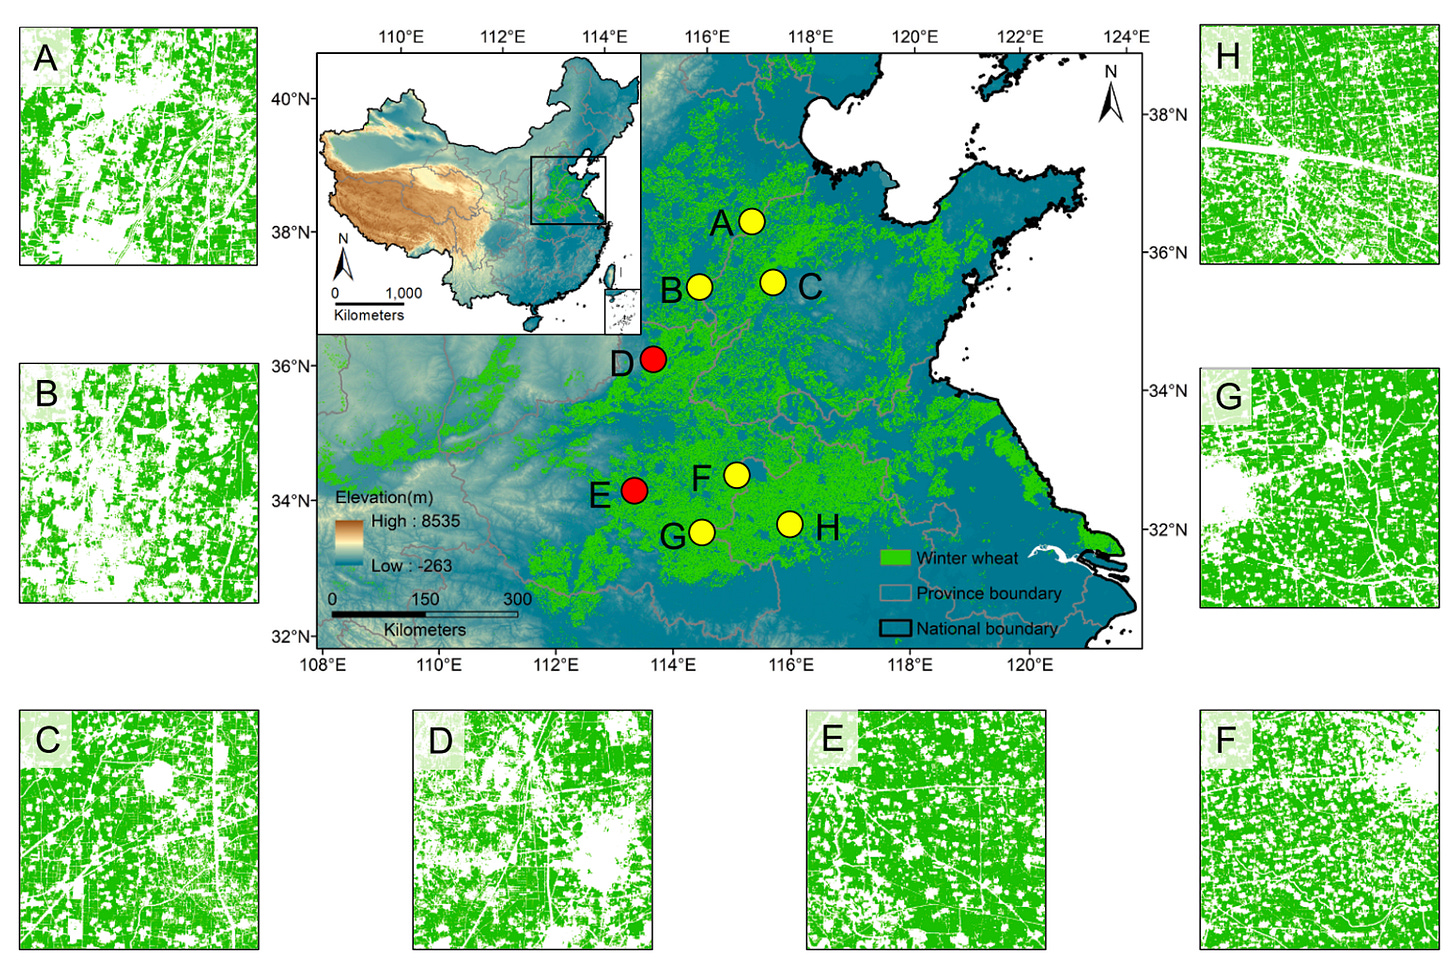
A paper published in the ISPRS Journal of Photogrammetry and Remote Sensing introduces a new deep-learning model designed to map winter wheat fields using time-series Sentinel-2 satellite imagery.
I never thought I’d be a crop-mapping type of guy, but these days I find it pretty important, as it allows us to come up with better estimates of agricultural GDP. It’s also essential for food security and managing agricultural resources.
The researchers used Sentinel-2 data from the winter wheat growing season, spanning October 2021 to June 2022. This dataset includes multi-seasonal images from nine spectral bands, focusing on regions with significant winter wheat production.
They developed a ‘UTS-Former framework,’ a hybrid model combining U-Net and Transformer architectures (I’ve previously provided an intro to U-Nets here).
The key takeaway is that this approach massively improves the accuracy of winter wheat mapping compared to other deep-learning models (like UNet2d-LSTM and CNN-BiLSTM). This can significantly enhance the monitoring and management of agricultural resources, which is important for food security, especially in major wheat-producing countries.
3. AI weather prediction models as downscaling tools
Researchers from the European Centre for Medium-Range Weather Forecasts (ECMWF) and the Helmholtz Centre for Polar and Marine Research (AWI), have shown how AI-based numerical weather prediction (AI-NWP) models can be used to increase the resolution of climate data.
In a previous deep dive, I discussed geospatial climate models, which can project daily climate data up to 2100. However, these models often have low resolution—around 25km—limiting their usefulness for granular analysis.
The researchers used an AI-NWP model called Pangu-Weather, trained on high-resolution ERA5 Reanalysis Data, to increase the resolution of low-resolution CMIP6 Climate Model Data.
They focused on producing 2-meter temperature data, generating year-long datasets that closely matched the high-resolution reference data, with an average difference of just -0.004°C. While accuracy did decrease slightly over longer forecast periods, the results are still promising.
Nonetheless, I think these are pretty interesting findings. During my time at the World Bank, we often struggled with the low resolution of climate projections when assessing future climate risks to critical infrastructure (e.g. schools, hospitals, roads, etc.) across the globe. This type of downscaling approach could help overcome these limitations, and help provide more accurate climate risk assessments going forward.
4. How climate-smart agriculture impacts poverty
A new article from Nature Communications looks at how ‘climate-smart agriculture’ (CSA) practices impact multidimensional poverty (which includes factors like health, education, and living standards) among coastal farmers in Bangladesh.
CSA techniques (e.g. agroforestry, conservation tillage, rainwater harvesting, on-farm diversification, and contingent crop planning), are designed to protect crops from climate-related events like cyclones and floods. The study examined the factors that influence the adoption of these practices and their impact on poverty in climate-vulnerable regions.
Using data on household demographics, income, crop yield, access to credit, and CSA adoption, the researchers used an ‘Endogenous Switching Regression’ method to compare farmers using CSA practices with a hypothetical scenario where they didn’t adopt CSA.
They found that:
Farmers with higher crop income, access to agricultural extension services, and training on input management were more likely to adopt CSA practices.
Farmers using CSA practices saw a 41% reduction in multidimensional poverty
If farmers who haven’t yet adopted CSA practices decided to do so, their poverty levels could decrease by 15%
PS the code is available here.
Geospatial datasets
1. eMOTIONAL Cities Metadata
The eMOTIONAL Cities Metadata Catalog is a resource part of the eMOTIONAL Cities project, which aims to explore the relationship between urban environments and human emotions, health, and behaviour.
2. IOM Displacement Tracking Matrix (DTM) API
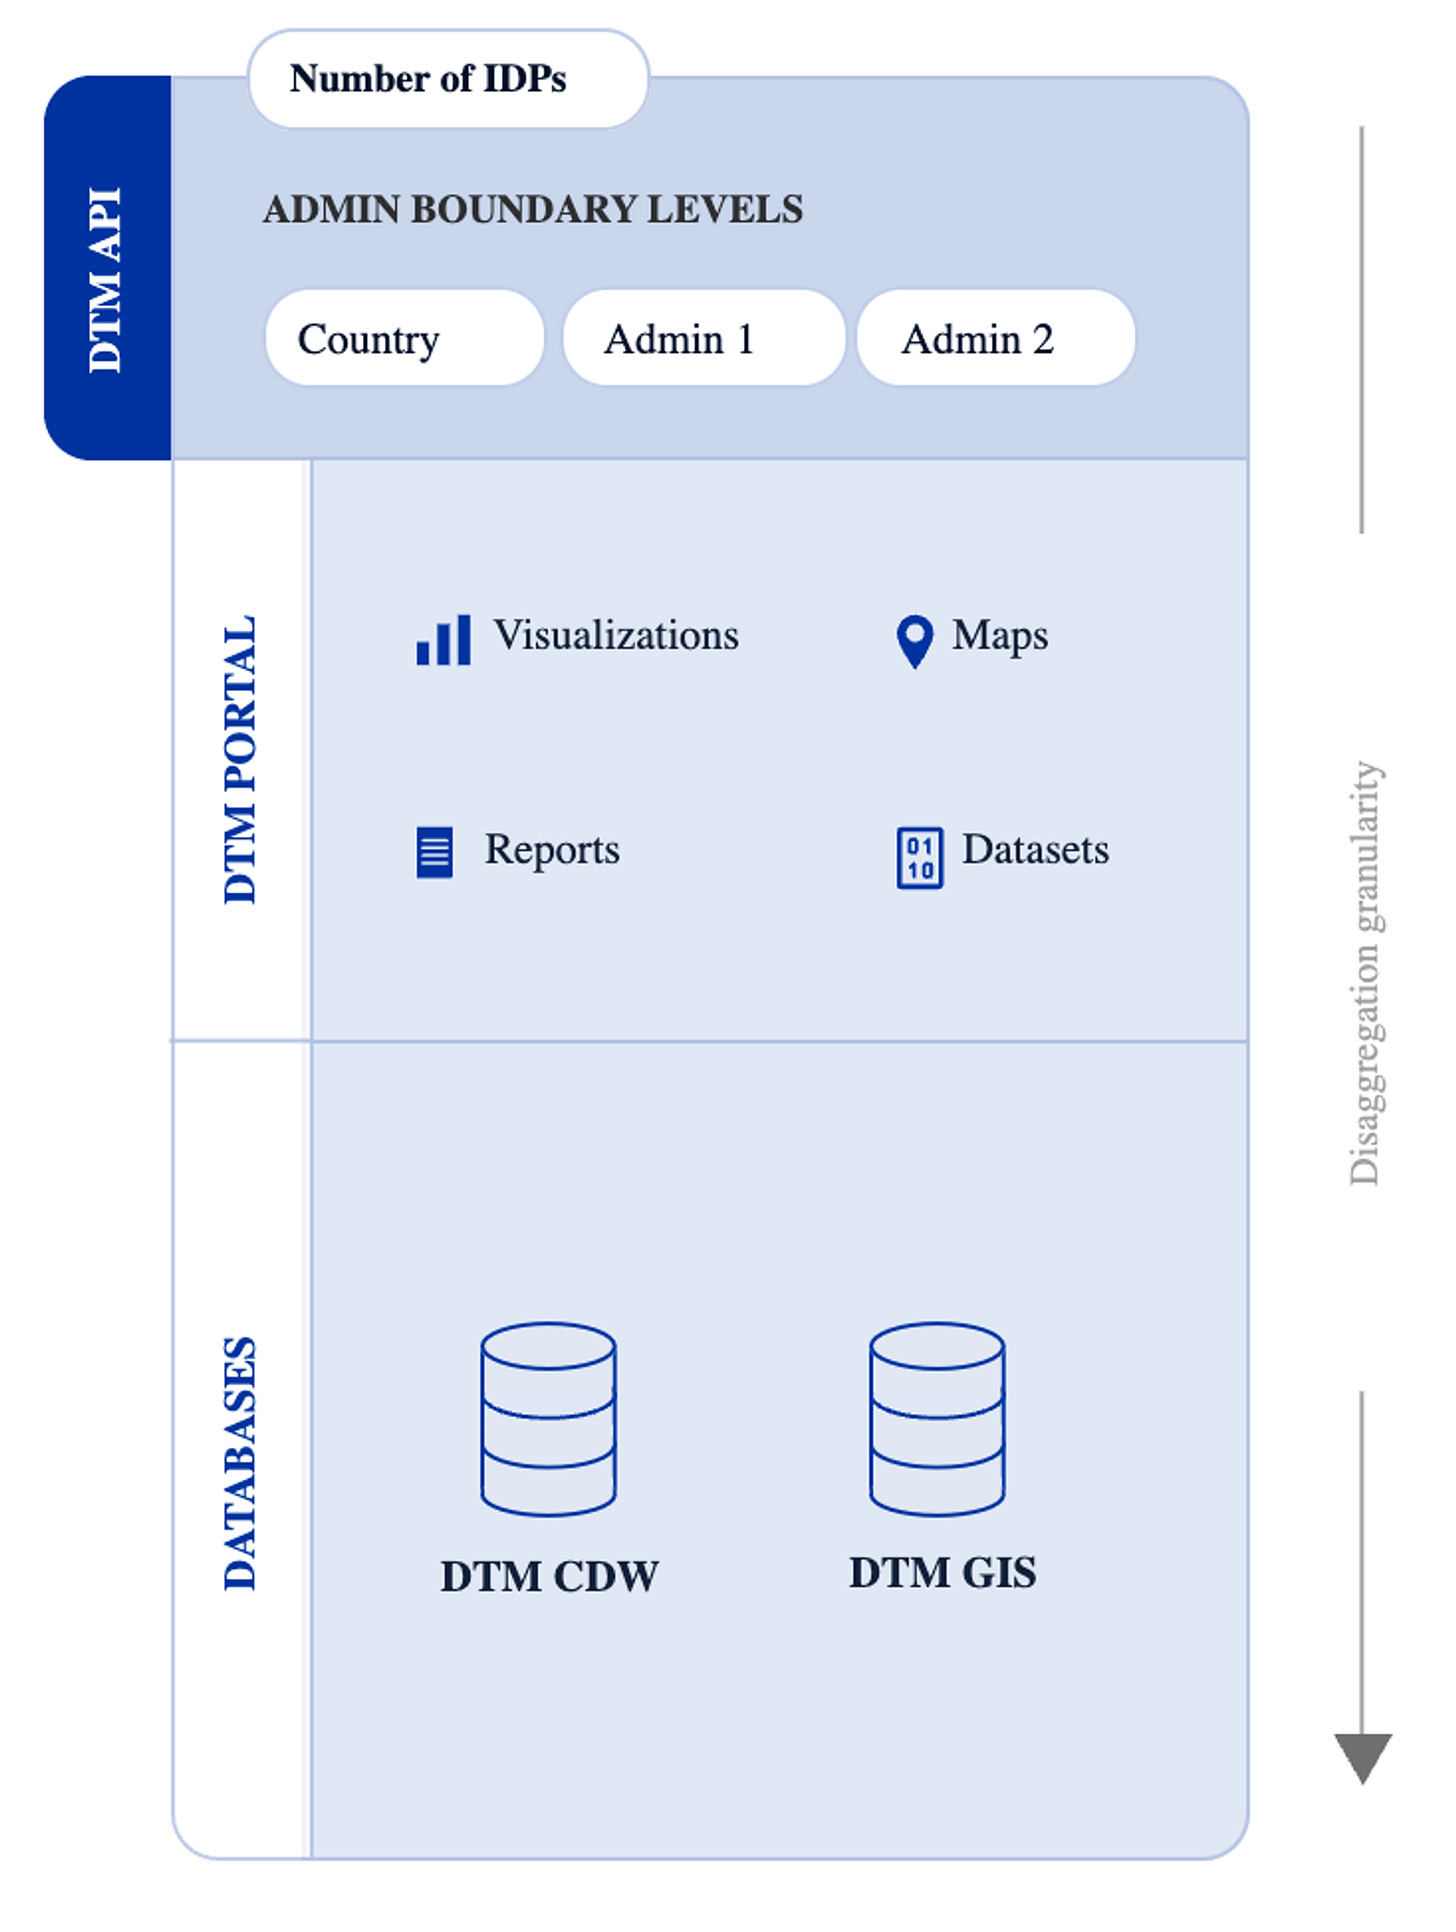
The Displacement Tracking Matrix (DTM) API, by the International Organization for Migration (IOM), simplifies access to data on internal displacement.
It provides data on internally displaced persons at the national level, admin 1 level (i.e. states or provinces), and admin 2 level (e.g. municipalities).
3. Military Responses to Climate Hazards Tracker (MiRCH)
The Military Responses to Climate Hazards Tracker (MiRCH) is a tool developed by the Center for Climate and Security to provide info on how global military forces respond to climate-related challenges.
The MiRCH dashboard has a bunch of filters, which means we can look at things by country, hazard type, and military branch, plus in-depth insights into international deployments.
4. Sentinel-1 Monthly Mosaics
Copernicus has just rolled out the Sentinel-1 monthly mosaics, featuring pre-processed, terrain-corrected satellite imagery for 2023.
I’m currently working on a couple of projects using monthly Sentinel-1 data, so using these off-the-shelf aggregated mosaics will save a lot of compute time.
5. WorldCereal Reference data collections
The in-situ WorldCereal reference data includes ground-truth data on crop types, conditions, and soil characteristics from various global locations.
This type of ground-truth data is incredibly important for training and testing crop classification models. I can’t tell you how much time this saves, as we no longer need to gather this data on the ground ourselves.
Other useful bits
I was surprised to find out that with temperatures rising in Antarctica, new plants are starting to grow where only lichens and mosses once survived. Scientists have then created the first detailed map of Antarctic vegetation using satellite data so that we can monitor these changes in vegetation.
A recent aerial survey by the Environmental Defense Fund found that US oil and gas drillers are emitting much more methane than previously thought—up to three times higher than government estimates. Using geospatial data from aircraft sensors, the study revealed significant underreporting of this potent greenhouse gas. This is something I’ve written about previously here.
A study from Spatial Economic Analysis introduces the "Digital Layer," an interesting approach that uses web data and hyperlinks to map connections between companies. This essentially provides info on how firms collaborate and innovate. This could be a nice addition to the traditional innovation studies literature which relies on patent data to measure similar things.
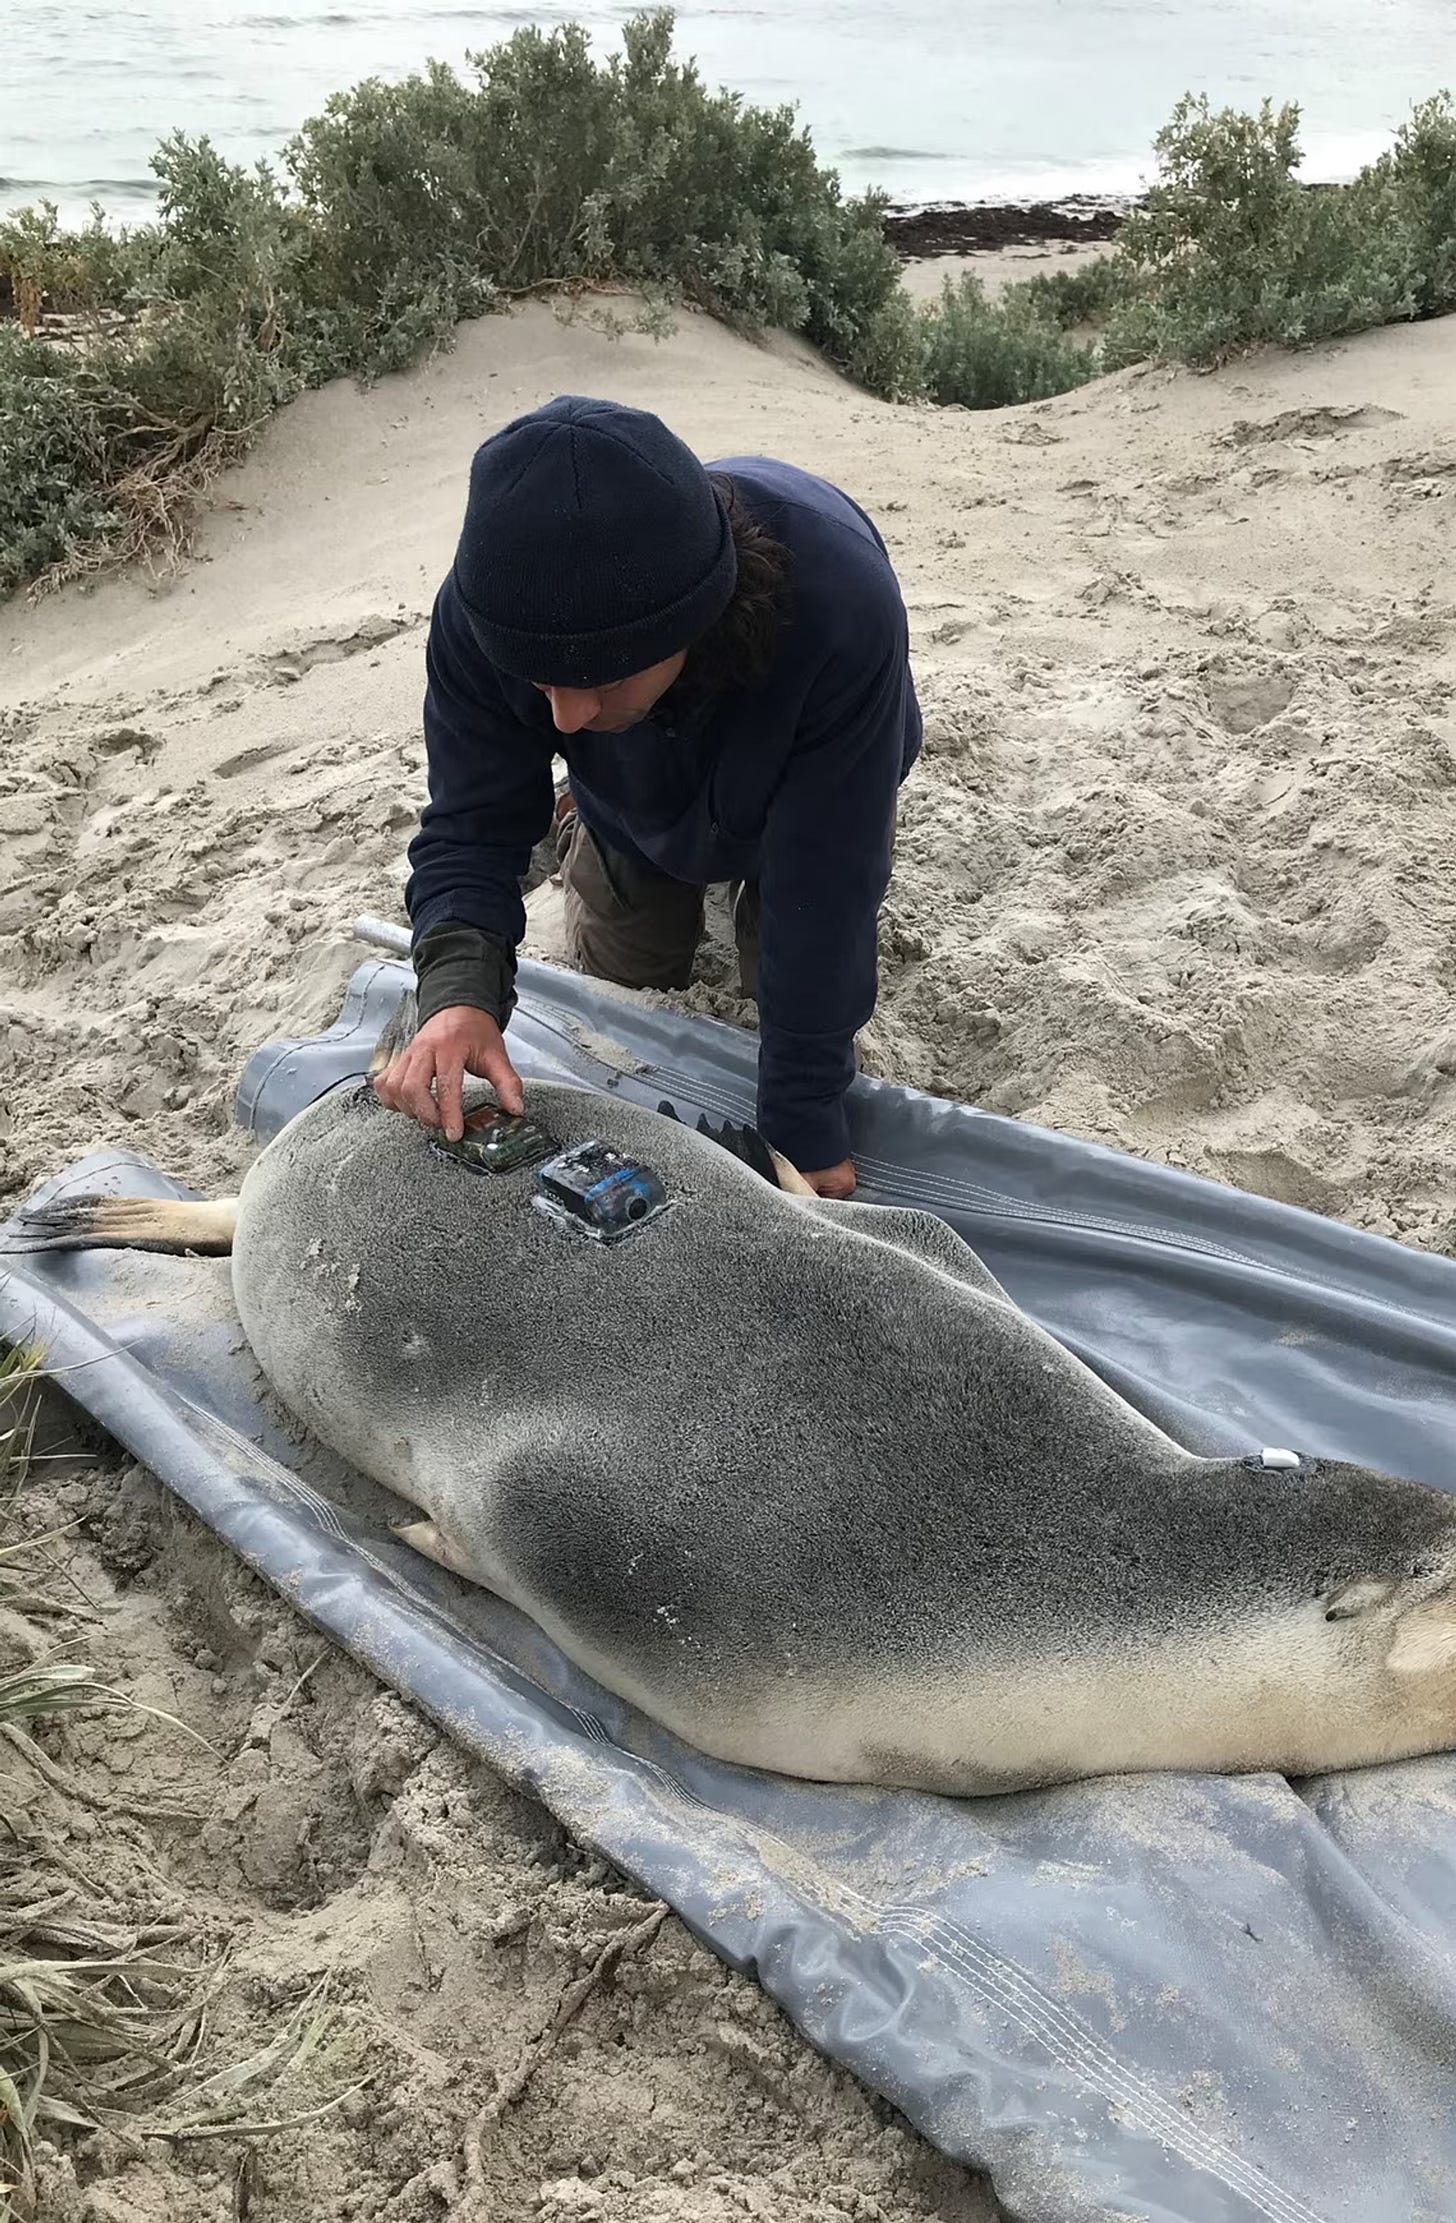
Scientists mounted cameras on endangered Australian sea lions, capturing amazing footage of their underwater adventures. These cameras are helping map the ocean floor and revealing critical habitats, crucial for conservation as sea lion populations decline. I’m sort of curious how they came up with this idea…
Satellite images reveal signs of recovery in Maui— a year after the deadly wildfires. The images show that while much of the landscape is still scarred, some vegetation is slowly starting to regrow.
Jobs
My team (the Data Division) at the Asian Development Bank is looking for a couple of interns. There are two internship spots:
The University of Leicester is looking for a Geographic Information Science (GIS) and Remote Sensing Data Analyst for their Knowledge Transfer Partnership with Bluesky International Ltd.
Ordnance Survey is looking to hire their Head of Geospatial Data, who will be accountable for their geospatial data governance and data strategy, among other things.
GIM - Smart Geo Insights is looking for a Data Scientist to help with Earth Observation AI developments.
Tuatara is looking for a Remote Sensing Specialist, who will be working on spatial data for detection and classification problems on satellite, aerial and drone imagery.
OpenGeoHub is looking for a Data Scientist: Geovisualization and dashboard building for multivariate EO data.
Spatial Vision is looking for a GIS Developer/Spatial Software Engineer based in Australia, who will be under their Enterprise Spatial Solutions team.
The Climate and Environmental Remote Sensing Unit (CLIMERS) of the Department of Geodesy and Geoinformation of TU Wien is looking for an Earth observation scientist.
That’s it for this week.
I’m always keen to hear from you, so please let me know if you have:
new geospatial datasets
newly published papers
geospatial job opportunities
and I’ll do my best to showcase them here.


Thank you very much. Keep on inspiring 🙏