

🌐 Measuring marine microplastics from space
PLUS: Tracking the growth of illegal mining, measuring the walkability of streets, and more.


Hey guys, here’s this week’s edition of Spatial Edge — a weekly round-up of geospatial news that you can digest in less than 5 minutes. We’re told it’s more satisfying than a sinusoidal projection.
In today’s newsletter:
Microplastics Impact Birth Weights: Exposure linked to low birth weights.
Mapping Illegal Mining: Satellites reveal Brazil's mining surge.
Measuring Walkability: Geospatial data can assess the walkability of streets.
ImageRAG Framework: A more efficient way to analyse massive satellite images.
Climate TRACE dataset: the most comprehensive dataset on GHG emissions.
First up, if you’re on BlueSky, it’d be great to connect with you over there. I’ve changed my username to @yohan.so, because it was absurdly long before.

The geospatial community on there is thriving, but I’ve got to admit I still find it weird to see a timeline that’s not stacked with Elon’s tweets, Elon fanboys, and new meme coins.
Research you should know about
1. Examining the impact of microplastics on birth weights

Microplastics seem to be everywhere in the news at the moment. In fact, 170 environmental groups just signed a petition to demand the EPA start monitoring microplastics in drinking water.
So this new study is pretty timely. It provides the first large-scale empirical evidence linking in-utero exposure to marine microplastics with adverse birth outcomes. The team compiled data from 3 million births across coastal areas in 15 countries and merged it with novel remote-sensing measurements of marine microplastic concentrations.
They used NASA’s CYGNSS product, which indirectly estimates marine microplastics by tracking changes in the relationship between ocean surface roughness and wind speed. To measure microplastics moving from the open sea to coasts, they developed a model based on daily ocean current patterns.
They found that exposure to microplastics during pregnancy, particularly in the third trimester, leads to a measurable increase in the likelihood of low birth weight in infants. Specifically, a doubling of microplastic exposure is associated with an increase of 0.37 cases of low birth weight per 1,000 births. This effect translates to roughly 205,800 cases globally each year attributable to microplastic exposure.
Aerosolisation was found to be the main way fetuses get exposed to microplastics. This is the process by which microplastic particles become airborne due to seawater evaporation. What’s pretty surprising is that seafood consumption didn’t seem to be the primary method of exposure.
2. Mapping illegal mining from Space

A new study published in Nature Communications maps the expansion of illegal mining activities in Brazil’s Amazon from 1985 to 2022, revealing a massive 12-fold increase over the period.
The team analysed Landsat satellite images to create annual, cloud-free maps of mining areas across Brazil. They used a U-Net deep learning model to classify pixels as mining or non-mining, training it on human-labelled samples. Spatial and temporal filtering refined the results.
The study showed a massive increase in illegal activities, which grew from about 220 square kilometres in 1985 to 2,630 square kilometres in 2022—almost a 1,200% rise. Illegal mining now covers more area than industrial mining and is heavily concentrated in the Amazon. Over 40% of these illegal mining sites are less than five years old, with many relying on heavy machinery rather than more old-school "artisanal" methods.
All in all, this highlights an urgent need for stricter regulation and governance, improved licensing transparency, and better enforcement.
P.S. You can access the replication code here.
3. Using geospatial data to measure the ‘walkability’ of streets at scale

A new study published in Scientific Reports introduces a way to assess the walkability of streets by using big data and deep learning. This essentially addresses the limitations of more traditional ways of evaluating the walkability of roads.
The researchers applied their framework to Beijing's Fifth Ring Road, combining three indices:
the Macro-Scale Index (MAI), which measures community-level elements like accessibility to facilities
the Micro-Scale Index (MII), assessing street-level features using over 314,000 streetscape images analysed through deep learning models; and
the Street Walking Preferences Index (SPI), derived from surveys with 659 participants and modelled using a conditional Logit model.
The study found that the framework reliably reflects the distribution of walkability.
In high-density cities like Beijing, the MAI closely aligns with the comprehensive index, demonstrating its accuracy. As someone who lives in Manila, I’m hoping urban planners can use this framework to provide a more data-driven approache to improving walkability of cities.
4. Retrieval Augmented Generation for geospatial data
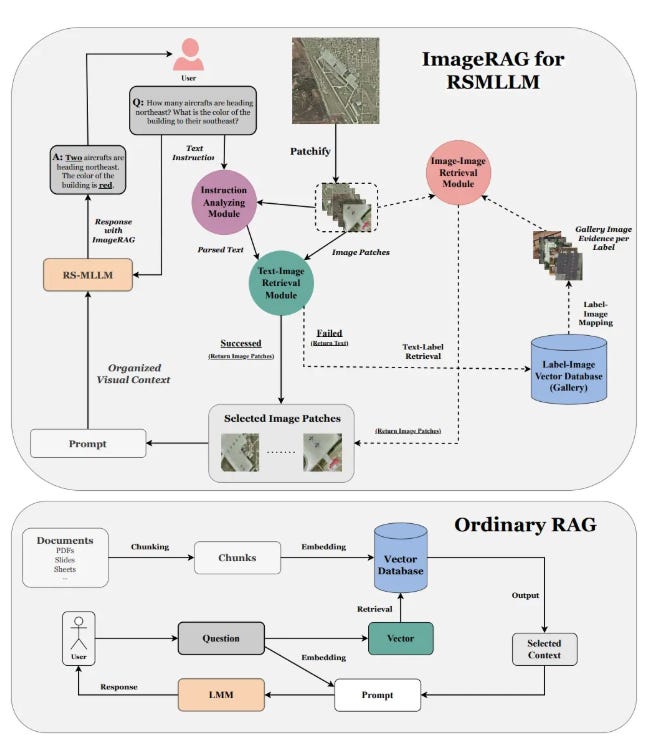
A new study introduces ImageRAG, a framework that helps large language models analyse ultra-high-resolution remote sensing images. These images can be insanely large—sometimes 100,000 by 100,000 pixels. This is a massive problem for current models that can't process such vast amounts of data.
To address this problem, the researchers introduce ImageRAG, a training-free method that transforms the task of analysing huge images into one of selecting relevant image contexts. ImageRAG retrieves and focuses on the most relevant parts of the image related to a query (inspired by Retrieval-Augmented Generation approaches). They introduced two pathways: a fast path that quickly retrieves relevant image patches based on the query, and a slow path that involves a more detailed retrieval when the fast path doesn't yield results. The framework uses techniques like dividing the image into patches and using text-image retrieval modules to identify areas of interest.
Their findings show that ImageRAG enables models to handle ultra-high-resolution images efficiently and accurately by focusing on essential visual contexts. In essence, this approach provides better analysis of fine details and small objects in satellite images by avoiding the need to process the entire massive image.
Geospatial datasets
1. Climate Trace GHG Emissions Inventory

The latest Climate TRACE dataset provides the most comprehensive global greenhouse gas (GHG) emissions inventory to date. With data from over 660 million assets, it includes 2023–2024 emissions estimates, monthly trends since 2021, and pollutant-specific data like carbon monoxide and PM 2.5. It also covers 10 sectors and 67 subsectors. So the bottom line is: it’s pretty comprehensive.
2. Building Footprint Dataset

The U.S. Building Footprint Dataset provides a comprehensive classification of buildings as residential or non-residential based on OpenStreetMap (OSM) data. You can access the dataset here and the replication code here.
3. Road surface type dataset

The Road Surface Type Dataset provides a global classification of roads as paved or unpaved. It’s based on Mapillary street-view imagery. You can access the dataset here.
4. Cartomark maps dataset

The CartoMark dataset features over 20,000 curated maps and includes tools for annotation and format conversion. It’s essentially a large-scale benchmark for map content analysis and can be used for stuff like text annotation recognition, scene classification, super-resolution reconstruction, and style transfer. You can access the dataset here.
Other useful bits

NASA has introduced Earth Copilot, an AI tool developed in collaboration with Microsoft, to simplify access to its extensive geospatial data. It allows us to interact with geospatial datasets through plain language queries, e.g. “What was the impact of Hurricane Ian?” The idea is to reduce technical barriers and make geospatial data more accessible. This is an aim I think we can all get behind.
Farmers in northwest India and Pakistan reportedly outsmart satellites by timing stubble burning to avoid detection during NASA satellite overpasses in the early afternoon. Observations from Korea's GEO-KOMPSAT-2A satellite reveal increased fire activity later in the day. This is shattering news for all the economists out there whose clean identification strategies have now been thrown out the window.
A new study shows that heat, not lack of precipitation, is the main driver of recent droughts in the western U.S., with climate change intensifying their severity.
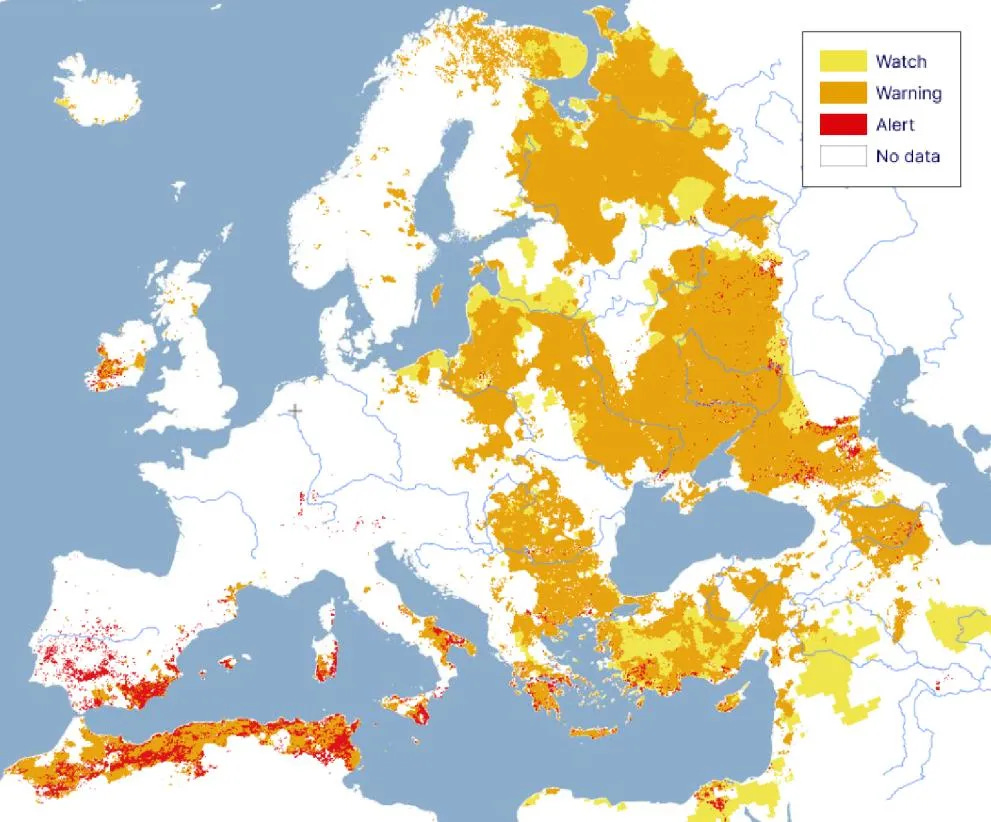
The European Drought Observatory (EDO) has reported improving drought conditions across much of western, southern, and eastern Europe. However, the Mediterranean, Balkans, and Black Sea regions continue to experience severe and prolonged drought, with significant impacts on agriculture, water resources, and ecosystems.
NASA scientists have discovered that thawing permafrost in the Arctic is releasing significant amounts of greenhouse gases, which is contributing a lot to near-term global warming.
The UK Space Agency delivered a statement at COP29 in Baku, emphasising the important role of satellite data in monitoring climate change. They discussed satellites' contributions to tracking greenhouse gases, land use changes, global temperatures, polar ice melt, extreme weather events, and ocean health. But then again, you already knew this, which is why you’re here…
Jobs
The International Institute for Applied Systems Analysis (IIASA) is looking for a Lead Spatial Data Scientist under their Integrated Biosphere Futures (IBF) Research Group.
KPMG is looking for a Spatial Economist / Regional and Urban Economics Expert.
EarthPulse is looking for a Full-stack Geospatial developer with a strong background in Python and web development.
Deloitte is looking for a Space Security Engineer in Space Research and Satellite Communications.
Innoflair is looking for a Marine Earth Observation Operational Support Specialist who will work with EUMETSAT.
GHGSAT is looking for a (1) Geospatial Data Engineer and a (2) Data Scientist, both under their Analytics Department.
Just for Fun

An image of Saturn captured in daylight by Grant Petersen.
That’s it for this week.
I’m always keen to hear from you, so please let me know if you have:
new geospatial datasets
newly published papers
geospatial job opportunities
and I’ll do my best to showcase them here.
Yohan