

🌐 Measuring the resilience of tourism spots
PLUS: using geospatial data to understand micromobility patterns, forest mapping techniques and new foundation models.


Hey guys, here’s this week’s edition of Spatial Edge — a weekly round-up of geospatial news that you can digest in less than 5 minutes a week. If you find there’s nothing more satisfying than calculating zonal statistics using exactextractr, then you’ve come to the right place…
In today’s newsletter:
Tourism resilience: established tourist routes endure major disruptions
Bike-sharing routes: data shows recurring trip patterns near train stations
Forest mapping: identifying which SAR parameters are most useful
All-sky modeling: Pre-trained models handles tough atmospheric conditions
NASA and IBM: Updated geospatial foundation model released
Research you should know about
1. Measuring the resilience of tourist hotspots to pandemics

A new study in Scientific Reports examines how COVID impacted tourist hotspots across Europe.
The authors used a model that treats countries like points (or "monomers") emitting a kind of "radiation," representing tourist flows. They introduced small simulated variations to test how stable these tourist mobility patterns are under different conditions. This allowed them to identify consistent structures in tourism networks, even during pandemic disruptions.
They found that pandemic restrictions made tourism movements more standardised. They also found that tourist preferences mirrored economic strength, cultural links, and linguistic similarities between countries.

Well-established routes like the “Blue Banana” corridor (yes, this is a thing) were more resilient to COVID, while emerging corridors such as the “Red Octopus” (apparently this is also a thing) appeared more fragile when disrupted.

Anyway, the bottom line is that:
During pandemics, tourists resort to tried and tested tourist spots.
This is probably because it was easier to get to (due to regulations), and people are less risk-averse during pandemics.
You can access the code here.
2. What makes people return micromobility to their starting spots?

As someone who previously co-founded a data science company to optimise micromobility vehicle placement, I’m always interested in new approaches in this space. A new study investigates the ‘self-loop phenomenon’ in a bike-sharing system. This is where bikes return to their original location after multiple trips.
The team analysed two weeks of bike-sharing trip data covering hundreds of metro stations and street segments in Beijing. They used a spatial autoregressive model to account for the influence of nearby locations, and a double machine learning framework, which helps isolate the effects of different factors. They combined GPS-based bike use records, Points of Interest (POI) information on land uses (like residential and commercial areas), socioeconomic data, and metrics describing connections to metro and bus services.
Their findings show that:
residential areas are strongly linked to more ‘self-loops’, suggesting that regular, short trips, which is driven by first- and last-mile connections to public transport.
metro stations close to universities or major transport hubs, as well as places with higher metro ridership and fewer bus connections, saw more self-loops.
3. Identifying the best SAR parameters for forest monitoring

A new study from Charles University and ESA examines which Sentinel-1 synthetic aperture radar (SAR) parameters are best for monitoring forests in the Czech Republic.
The researchers used a new Google Earth Engine pipeline (MMTS-GEE) to generate time series of Sentinel-1 (SAR), Sentinel-2, topographic, and meteorological data for 600 broad-leaved and 600 coniferous forest sites. They then analysed nine SAR polarimetric parameters—standard channels, ratio indices, and vegetation indices—through correlation checks, time series comparisons, and a simple classification test to distinguish broad-leaved from coniferous forests.
They found:
the most useful were VH, VV, and their ratio-based parameters (VV/VH and VH/VV). In particular, VH performed strongly in classifying forest types, and VH/VV and VV/VH were both strongly linked to optical vegetation indices.
other parameters like RVI, RFDI, and DPSVI variations added little value and often produced noisy results.
I’ve seen a lot of folks working on understanding the best ways to use SAR for crop mapping and land use classification, so these insights will be quite useful. I’ve personally been a bit sceptical of some of the RVI results I’ve seen previously, so it’s interesting to see these results.
You can access the GEE tool here.
4. A pre-trained model for ‘all-sky’ remote sensing

A new paper introduces SatVision-TOA, a new geospatial foundation model pre-trained on 14-band MODIS Top-Of-Atmosphere (TOA) imagery, including all-sky conditions. Unlike previous models that focus on high-res and cloud-free data, SatVision-TOA learns from a bunch of different atmospheric and land cover states.
They use a Masked-Image-Modeling (MIM) self-supervised approach on 100 million image chips, resulting in a 3-billion-parameter SwinV2 Giant model trained solely on remote sensing data.
This model performs pretty well in reconstructing masked regions and outperforms baseline methods in downstream tasks, such as 3D cloud retrieval. It achieves a mean Intersection over Union (mIOU) of 0.4638—more than double the baseline’s 0.218—and reduces false negatives by over 50%. This improved performance demonstrates it can better delineate features in tough atmospheric and cloud conditions.
So the bottom line is that this work sets a new standard for pre-training vision models in the space of moderate- to coarse-resolution remote sensing.
You can access the model here.
Geospatial datasets
1. Physics simulations dataset

The Well dataset is a 15 TB dataset of physics simulations. It includes dynamics from astrophysics, biology, chemistry, and fluid mechanics (Newtonian and non-Newtonian). This can be pretty useful for folks interested in things like flood modelling.
2. Industrial water dataset

A new study in Scientific Data introduces an open dataset on industrial water management in China. It’s built from over 1.4 million plant-level reports and provides info on water use, recycling, and pollution. You can access the dataset and code here.
3. Global hydro-climatic data

The Global Hydro-Climatic Data (GHCD) provides data on water movement and storage changes on land. It spanning 30 years (1980–2010) and covers 1,561 regions worldwide. You can access the dataset and code here.
4. Brick kiln database

If the lack of datasets on brick kilns keeps you up at night, then rest assured, the Indo-Gangetic Plain Brick Kiln Database has got you covered. It’s an open-source dataset identifying over 50,500 brick kilns across India, Bangladesh, and Pakistan, covering 1.1 million square kilometres.
Other useful bits

The Prithvi Geospatial AI model has been expanded by NASA, IBM, and Forschungszentrum Jülich to include global data. Prithvi 2.0 now has 600m parameters, which is 6 times larger than Prithvi 1. It can help do things like: flood detection, wildfire scar mapping, crop segmentation, etc. It outperformed other geospatial models on the GEO-bench framework, with an average score of 75.6%.
Airbus, Thales, and Leonardo are in early talks to form Project Bromo, a European satellite venture aimed at competing with Starlink. This would involve creating a unified satellite company to strengthen Europe’s position in low Earth orbit.
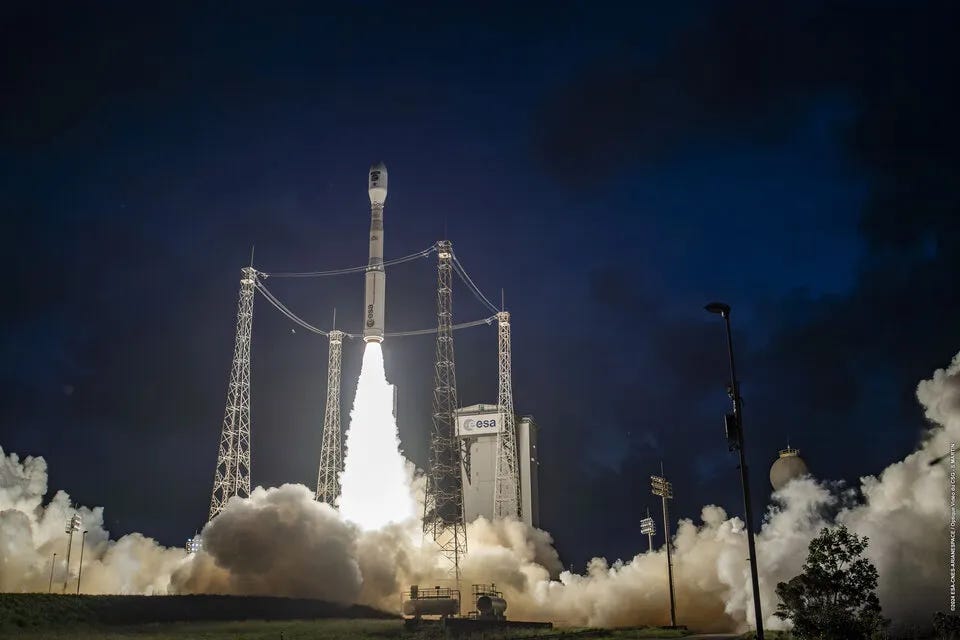
Sentinel-1C is now in orbit— launched successfully aboard the Vega-C rocket. This restores the Copernicus Sentinel-1 mission to full strength. I can’t wait to have more temporal frequency of free SAR data to play around with.
The Meteosat-12 is officially operational, providing high-res data to improve severe weather forecasting and climate modelling.
Jobs
Neuropublic SA is looking for an Earth Observation Specialist with experience in satellite image processing.
The National Audubon Society is looking for a GIS Technician who will develop applied science products with the Geospatial Science team.
Carboneg is looking for a Geospatial Carbon Project Analyst who will work on land use change, remote sensing analysis, and monitoring regenerative agriculture.
The University of Southampton is looking for a (1) Research Fellow in Population Forecasting and (2) a Project Manager for the WorldPop Group.
FAO is looking for a Remote Sensing and GIS Specialist under its Land and Water Division.
Just for Fun

World Labs has developed a tool that transforms single images into fully explorable 3D worlds. It includes stuff like real-time camera effects and integration with AI-generated or traditional images. I’m keen to see how this type of tech could be used in creating digital twins.
That’s it for this week.
I’m always keen to hear from you, so please let me know if you have:
new geospatial datasets
newly published papers
geospatial job opportunities
and I’ll do my best to showcase them here.