

Meta's new Segment Anything Model 2 is epic
PLUS: Measuring economic activity in rural areas, new crop classification datasets, mapping Afghanistan's poppy production, and more.


Hey guys, welcome to this week’s edition of the Spatial Edge — a weekly round-up of geospatial news that you can digest in less than 5 minutes. As I like to say, the only edge in space is the cutting-edge research you’ll read about here. Sorry…
In today’s newsletter:
Meta AI’s SAM 2: Real-time video object segmentation.
Monitoring Market Activities: Estimating economic activity in rural areas.
Labour Exploitation: Wealth transfer from South to North.
Crop Classification: EuroCropsML dataset using Sentinel-2 data.
Urban Heat Island Dataset: Identifying where urbanisation leads to heat.
Research you should know about
1. Meta AI introduces SAM 2
Meta announced Segment Anything Model 2, a computer vision model for real-time promptable object segmentation in videos and images. This builds on the original Segment Anything Model (SAM).
SAM 2 uses a transformer architecture with streaming memory. This essentially allows it to process video frames one at a time while storing information about segmented objects. It supports a new task called Promptable Visual Segmentation (PVS) and uses prompt inputs like clicks and bounding boxes for object segmentation.
It introduces a bunch of other improvements and new features. Unlike the original SAM which focuses on image segmentation, SAM2 can segment both images and videos. It also has better segmentation accuracy, enhanced zero-shot generalization, and an added memory mechanism that stores information.
So why is this a big deal for the geospatial community?
Well, SAMGEO has previously calibrated SAM 1 for geospatial data.
As I’ve discussed before, SAMGEO has been used to segment objects in satellite images, create segmentation masks, and even conduct text-based segmentation in remote sensing data.
So stay tuned for further performance updates to SAMGEO.
P.S. You can access both the SAM2 code and the SA-V dataset free.
2. Using satellite imagery to monitor rural economies

A new study has developed a way of monitoring remote rural economies using satellite imagery. It focuses on measuring economic activity in rural marketplaces, which are key hubs for economic exchange in remote areas.
However, collecting data in rural marketplaces has historically been tough.
The paper uses high-resolution satellite data (from PlanetScope and Google Earth) to (1) identify rural markets (without pre-existing maps), and (2) to construct weekly measures of economic activity.
To detect marketplaces, they used stacks of satellite images to spot day-to-day changes. They compared images from market days with non-market days, and measured changes in brightness and colour to determine whether there was a market present. This method was validated with reference data from Kenya, Malawi, and Mozambique.
For measuring economic activity from marketplaces, they examined the area around each marketplace. This involved calculating average brightness and colour changes. These readings are normalised to track activity over time. The satellite data is then compared with ground surveys in Kenya, showing a correlation with economic indicators like revenue and profit, and how market activity responds to weather and conflict.
3. Labour dependence on the global South
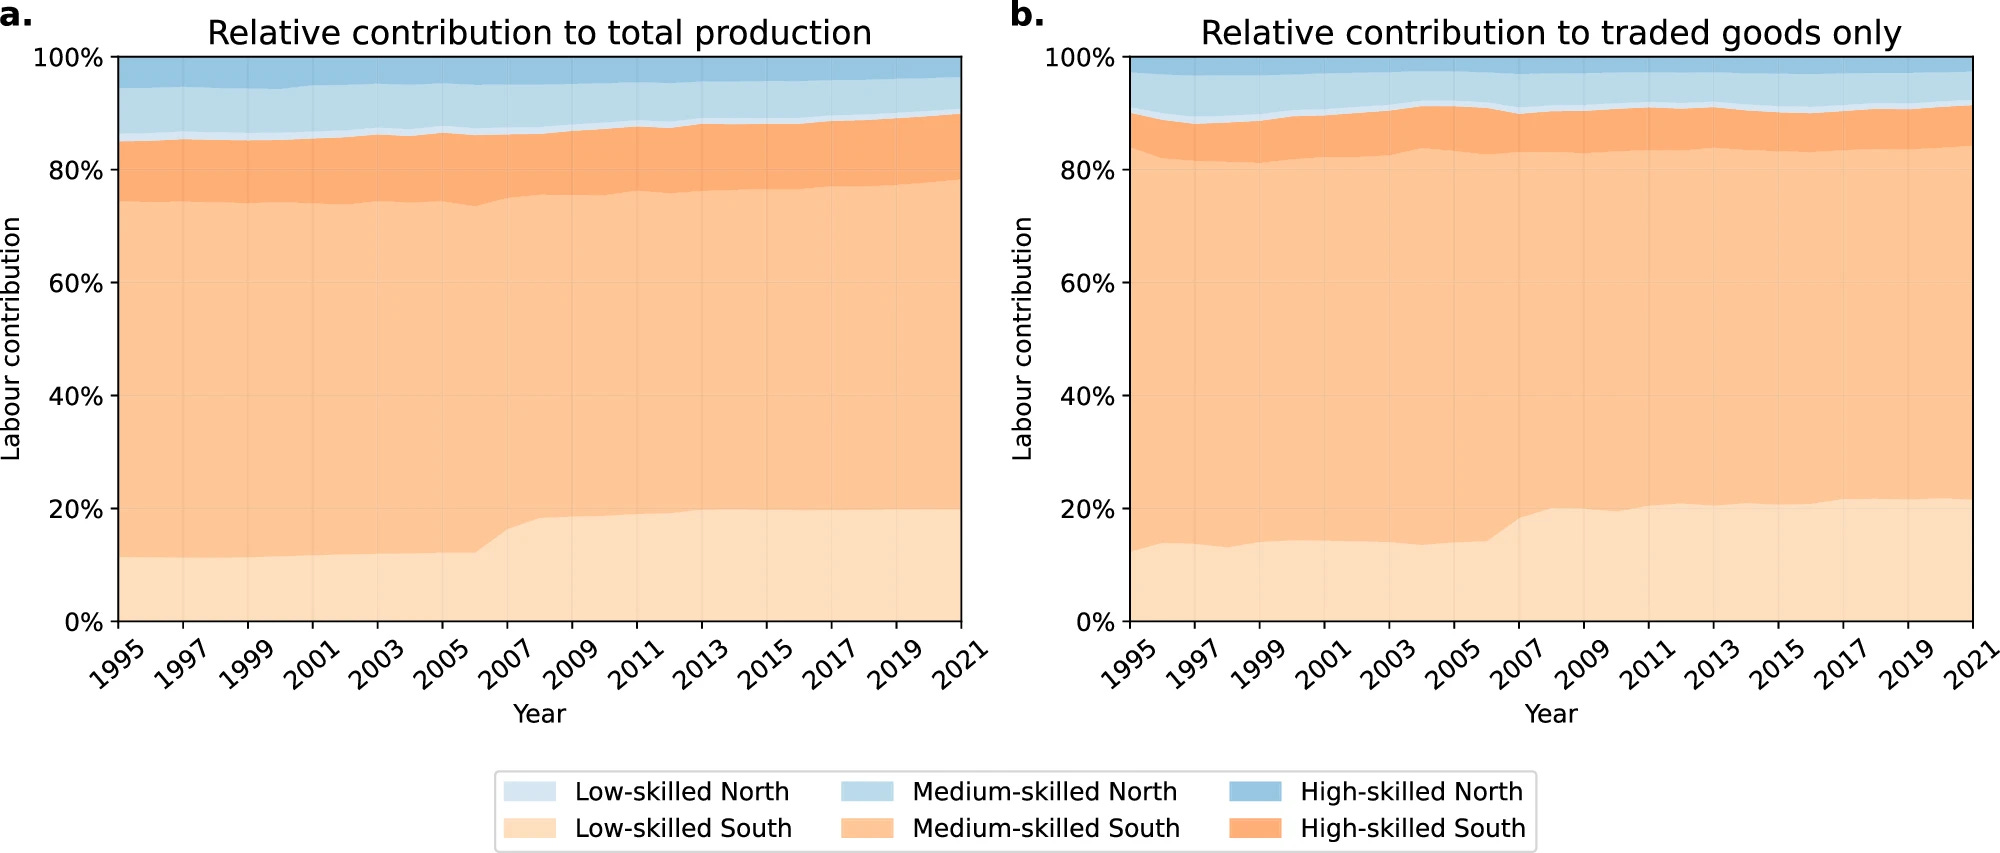
A new paper from Nature Communications shows how wealthier countries in the global North gain wealth by using labour and resources from poorer countries in the global South. This happens through trade practices that keep Southern wages and prices low, benefiting Northern economies.
Inequality is a topic I’ve covered previously in this newsletter, however, this paper uses EXIOBASE v.3.8.1 data, which includes info on:
Labour hours and compensation by skill level and sector,
Trade flows between the North and South,
Regional groupings by IMF and ILO skill levels.
The researchers find that:
Southern wages are 87–95% lower than Northern wages for work of equal skill,
Southern workers contribute 90% of the labour powering the world economy but receive only 21% of global income,
From 1995 to 2021, Southern high-skilled labour contribution increased from 66% to 76%.
To address these imbalances, the study recommends international minimum wage standards, fair resource pricing, and inclusive global economic policies for equitable trade practices.
Geospatial Datasets
1. Tropical moist forest dataset

Let’s be honest — who doesn’t find the words ‘tropical moist forests’ slightly weird?
Well, that hasn’t stopped the EU’s Joint Research Centre. They’ve updated the Tropical Moist Forest (TMF) dataset for 2023, covering tropical rainforests and moist deciduous forests.
The update also features:
Reprocessed Landsat data
Improved forest change detection
2. Crop type classification dataset

EuroCropsML is a remote sensing machine learning dataset for classifying crop types in Europe using time series data.
It benchmarks few-shot crop-type classification algorithms across the world. The dataset includes 706,683 labelled data points across 176 classes with annual time series from Sentinel-2 L1C data for 2021, crop type labels, and spatial coordinates.
3. Urban heat island intensity dataset

A study from the Remote Sensing of Environment released a dataset on the urban heat island intensity (UHII). Urban heat islands occur where urban areas experience local warming due to high levels of urbanisation. Accurate UHII estimates are crucial for understanding this, but current public datasets are limited.
The new dataset introduces a dynamic equal-area (DEA) method, which reduces the impact of various confounding factors on UHII estimates through a dynamic cyclic process.
Other useful bits

After two years of the poppy ban in Afghanistan, a report by Alcis shows an 85% drop in opium poppy cultivation. Satellite images show that poppy fields shrank from 202,000 hectares in 2022 to less than 4,000 hectares in 2024 across 14 key provinces. Despite the ban, Badakhshan still grows a lot of poppy and has had violent clashes over efforts to destroy the crops.
The release of overtureR was announced, an R package for interfacing easily with Overture Maps. This allows you to map virtually every building, POI, and transit in the world with just 5 lines of code.

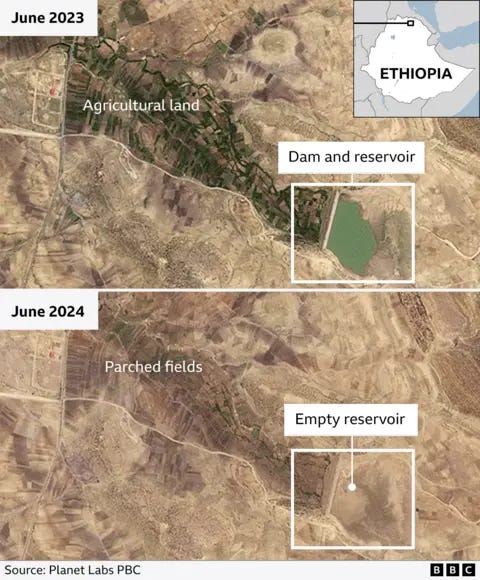
Satellite images are demonstrating the extent of the hunger crisis in Tigray. Drought, crop failure, and ongoing insecurity after a brutal war have put over two million people at risk of starvation. The images and local reports show dried-up reservoirs and farmlands in northern Ethiopia.
The Dallas government and Child Poverty Action Lab (CPAL) created the Urban Blight Tracker, a tool that uses street view images and AI to spot and map out blighted spots. After a surge in violent crime, this tracker is a city effort to make the community safer.
Jobs
Come work with me — my team (the Data Division) at the Asian Development Bank is looking for a couple of interns. There are two internship spots for:
The University of Tennesee Knoxville is looking for an Assistant Professor in Geographic Information Science under the Department of Geography & Sustainability.
World Economic Forum is looking for a Specialist in Space Technology. The specialist will be under its Centre for the Fourth Industrial Revolution (C4IR).
An ESA-funded project is looking for a Postdoc in Machine Learning for Earth Observation.
Our World in Data is looking for a Research and Data Project Lead in Economics.
Global Facility for Disaster Reduction and Recovery (GFDRR) is looking for a young Geospatial Data Scientist who will join the World Bank’s Junior Professional Associates (JPA) Program.
Coastal Carbon is looking to fill a number of vacancies: AI Scientists, AI Engineers, MLOps Engineers, and Chiefs of Staff.
GAF Munich is looking for a Project Manager in Earth Observation and Copernicus Land Cover and Land Use (LCLU) downstream Services.
That’s it for this week.
I’m always keen to hear from you, so please let me know if you have:
new geospatial datasets
newly published papers
geospatial job opportunities
and I’ll do my best to showcase them here.