Microsoft's new geospatial foundation model
PLUS: An ESA tool to harmonize Sentinel and Landsat data, a new foundation model to generate synthetic satellite images, and inequalities in exposure to heat stress.
Hey guys, here’s this week’s edition of Spatial Edge — a weekly round-up of geospatial news. The goal is to help make you a better geospatial data scientist in less than 5 minutes.
In today’s newsletter:
Aurora Unleashed: Microsoft’s new model that predicts weather and pollution.
ESA's Sen2Like: Discover how ‘virtual constellations’ are changing the game.
MetaEarth’s Magic: A new tool to generate synthetic satellite images.
Green Cooling Inequality: Vulnerable populations face more heat stress in European cities.
Adaptation: Geospatial data on climate change adaptation measures and resilience.
Research you should know about
1. Aurora: Microsoft’s Atmospheric Foundation Model
Aurora is a 1.3 billion parameter model from Microsoft that can do things like create 5-day air pollution predictions in under a minute, and create 10-day weather forecasts at ~10km resolution.
I’ve previously provided an overview of foundation models. But in short, these are models— like ChatGPT — that work out-of-the-box and have been pre-trained on a LOT of data. In the case of Aurora, it’s been trained on over a million hours of simulations generated by weather and climate models.
As a result, it can handle a bunch of tasks:
Limited Training Data: Performs well even with limited specific data for a task.
Heterogeneous Variables: Can predict various types of atmospheric data.
Extreme Events: Effective in forecasting rare and extreme weather events.
2. ESA’s Sen2Like Product: Harmonizing freely available satellite imagery
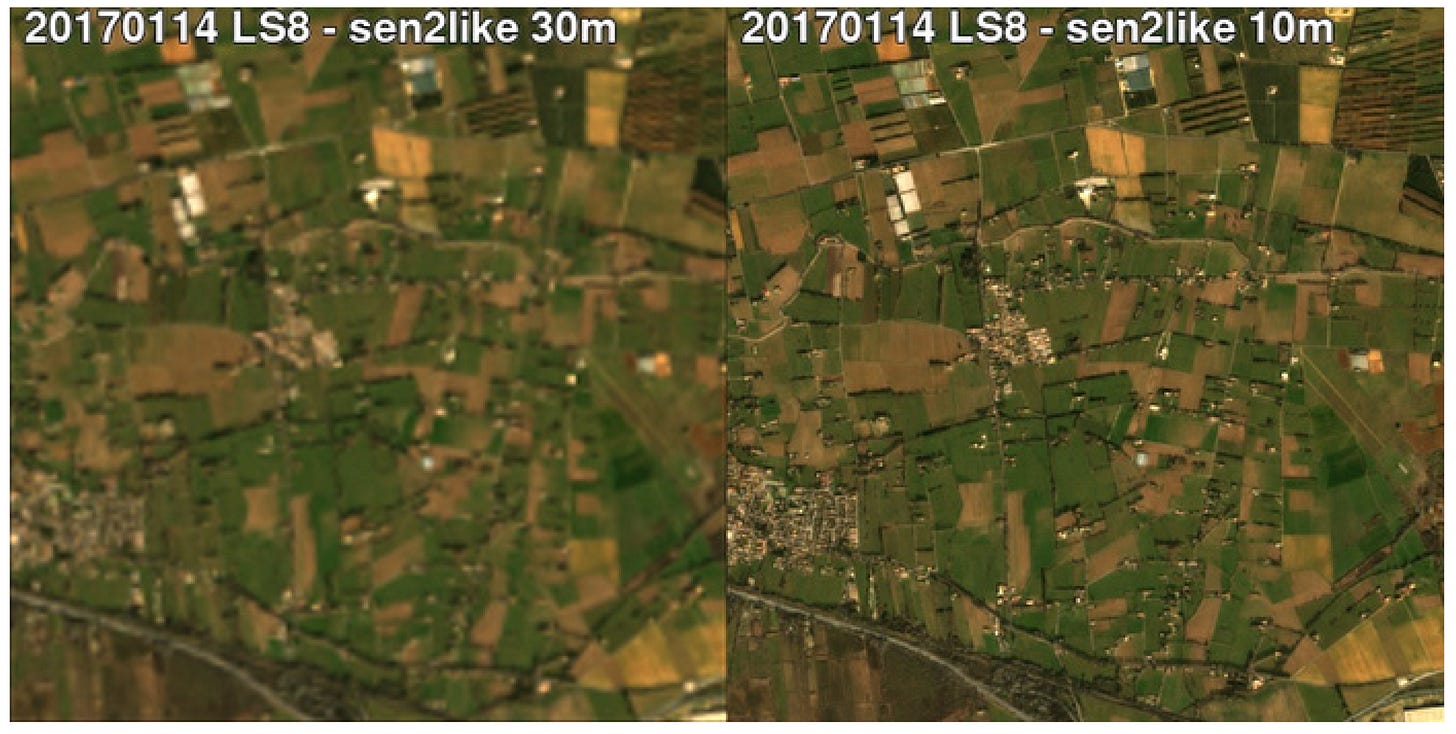
By harmonizing Landsat-8/9 and Sentinel-2 data, we can obtain standardized free optical imagery every 2.3 days globally. This is an improvement on the revisit frequency of Sentinel-2 (~5 days), Landsat-8/9 (~16 days).
ESA’s Sen2Like Product provides an open-source solution for harmonizing this data. It essentially creates a seamless and analysis-ready dataset by combining Landsat and Sentinel data (this is called a ‘Virtual Constellation’). It’s useful for overcoming limitations in the frequency of available satellite data [1].
Codebase: https://github.com/senbox-org/sen2like
3. MetaEarth: A Generative Foundation Model for Global-Scale Remote Sensing Image Generation
Amongst all the foundation model rage, we now have a foundation model that can generate fake satellite images that look pretty realistic.
Existing synthetic satellite image models can generate impressive-looking images but are limited to small-scale scenes. MetaEarth moves past this by creating large-scale global images. It can produce images of any part of the world in different resolutions and massive sizes.
The takeaway:
While these models are cool and can generate nice looking images, I’m still not convinced about their use-case.
I suppose, they could be used for:
Urban Planning: City planners can use synthetic images to simulate and visualize urban development projects before implementation.
Environmental Impact: Environmental scientists can create fake images to predict what a scene would look like once affected by deforestation or flooding.
Filling Data Gaps: In regions where real data is missing or sparse, synthetic images can fill in the gaps, providing a more complete picture for analysis and decision-making.
But that said, I do think the last two are a bit of a stretch
4. Inequalities in ‘green cooling’ infrastructure in Europe
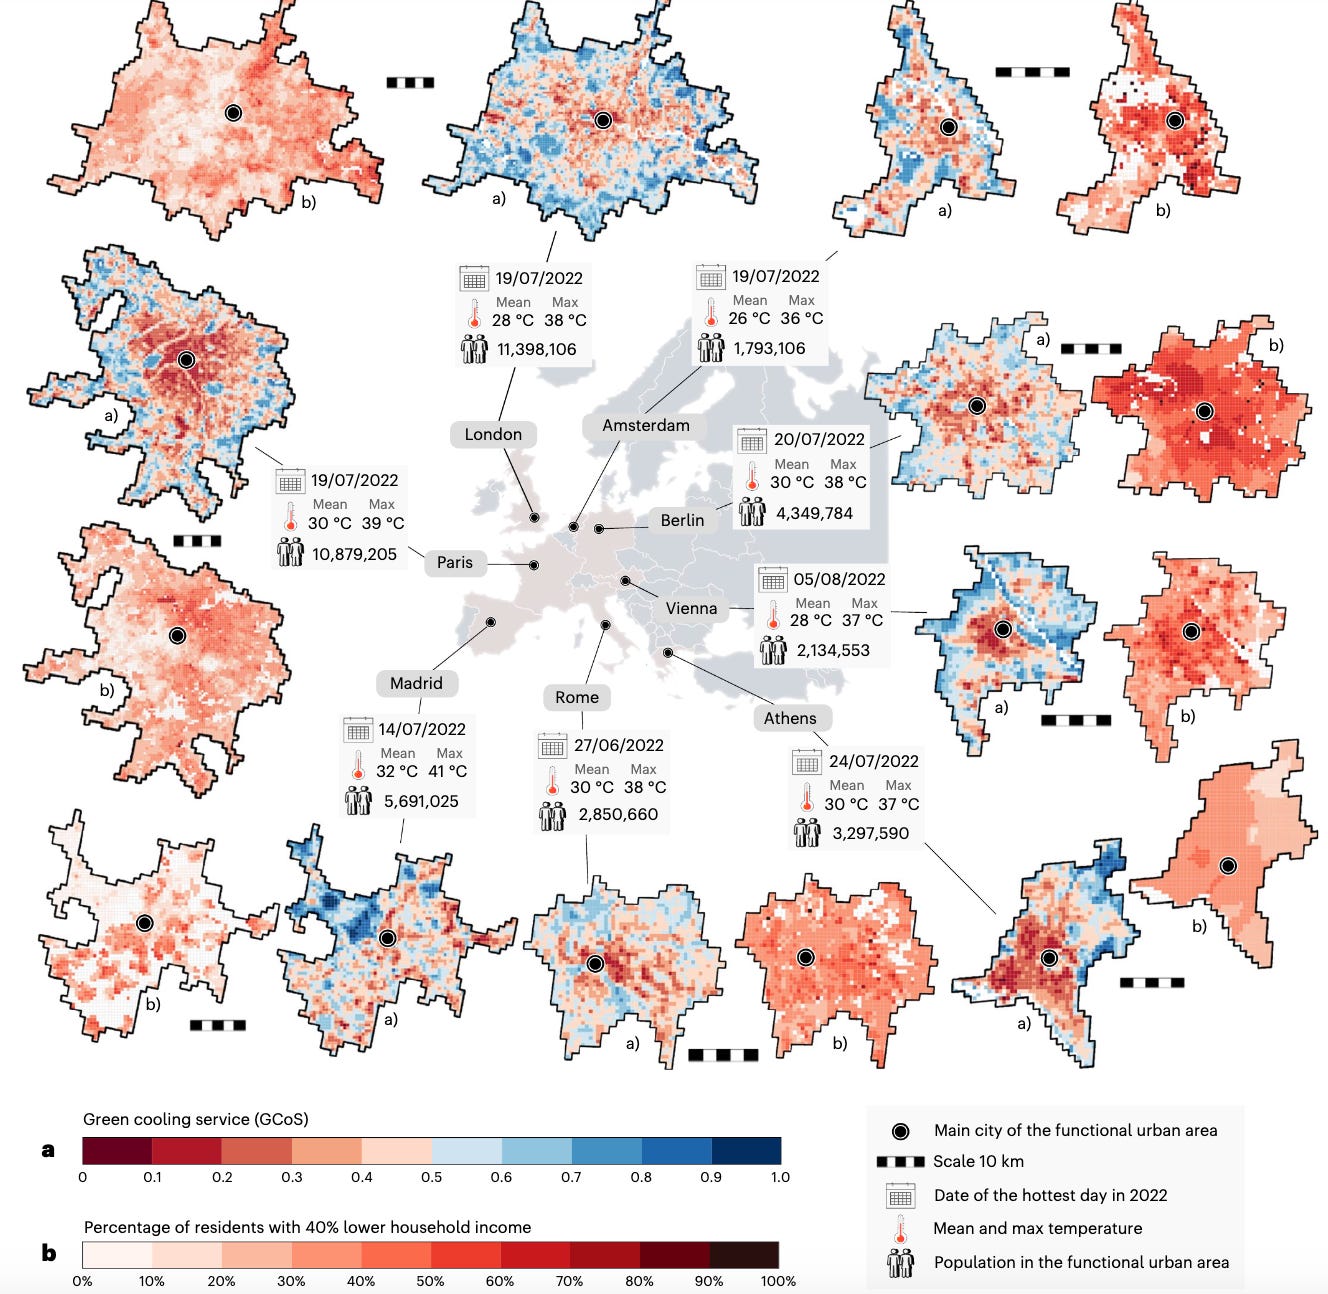
A new study has found significant environmental inequalities where vulnerable residents in major European cities receive inadequate ‘green cooling’ compared to wealthier residents.
Heat-stress is the primary climate-related cause of premature deaths in Europe. Recent major heatwaves in Europe are becoming more severe and prolonged, putting more people at risk. Large cities are particularly at risk due to the sheer amount of concrete, which retains more heat.
Green spaces help cool urban areas through shade and evapotranspiration (a process where plants release water vapour). These natural ‘cooling services’ are therefore essential for reducing heat stress, particularly in urban environments.
The takeaway:
The distribution of green cooling services is unequally distributed throughout cities in Europe. Vulnerable people (e.g. lower-income residents, immigrants, and unemployed people) are disproportionately affected.
This means that they have less access to green cooling spaces, and therefore have to deal with hotter temperatures.
For a more in-depth discussion on inequality, you can check out this post here.
New Geospatial Datasets
During my time at the World Bank, we did a lot of work quantifying the impact of climate change on infrastructure. It was much harder to quantify how countries were adapting to these climate risks.
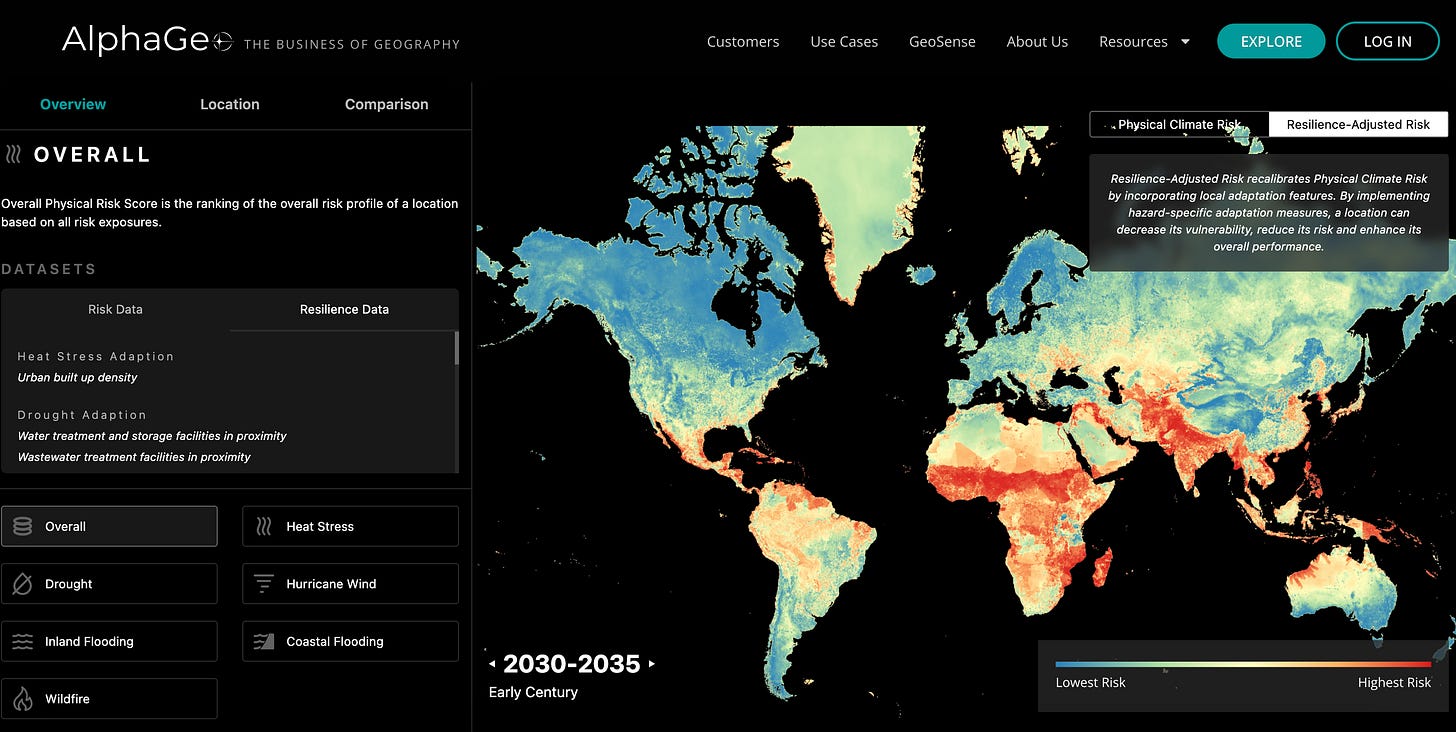
AlphaGeo is compiling geospatial ‘adaptation data’. This includes water treatment and sanitation facilities, desalination plants, seawalls, flood barriers, fire monitoring stations and more.
They’re then calculating a ‘resilience-adjusted risk’ of climate change. This essentially involves calculating geospatial data on ‘climate risks’, but then incorporates local adaptation features.
The Australian Government has launched the Digital Atlas of Australia. It provides access to a bunch of geospatial datasets on Australia’s geography, people, economy and the environment. It includes admin boundaries and satellite images.
Other interesting bits
Microsoft’s Planetary Computer Hub is being retired. This was an interactive, notebook-based environment within the broader Microsoft Planetary Computer platform. However, the datasets and APIs will still be maintained. This is a massive blow for the geospatial space.
Copernicus has launched its Data Space Ecosystem. It’s the merger of Copernicus Open Access Hub and Data and Information Access Service (DIAS). It offers the largest EO repository in the world and provides a set of cloud-based data processing tools.
ESRI is moving towards integrating natural language processing with analysing and visualising geospatial data. Check out this clip where you can simply type in what you want to visualise.
Clay foundation model for the world: Check out this interview between Bruno Sánchez-Andrade Nuño and Maxime Lenormand on the Mind Behind Maps podcast where they discuss the new Clay foundation model, and what it can do.
Geospatial Jobs
The United Nations Department of Economic and Social Affairs are looking for two geospatial information offices to be a part of the Secretariat for the Committee of Experts on Global Geospatial Information Management. You can check out the opportunities here and here.
The University of Edinburgh is looking for a couple of lecturers in Physical Geography.
The European Space Agency is recruiting an Internal Research Fellow (Post-Doctoral) on Disruptive Innovation for a Green and Sustainable Future.
That’s it for this week.
I’m always keen to hear from you, so please let me know if you have:
new geospatial datasets
newly published papers
geospatial job opportunities
and I’ll do my best to showcase them here.
Footnotes
[1] Note this product was actually launched in 2022, but I couldn’t resist including it.


