

🌐 New methods to track CO₂ at granular levels
PLUS: ESA's new open-source Sentinel-2 super-resolution model, quickly detecting landslides from satellite images, and more.


Hey guys, here’s this week’s edition of the Spatial Edge. We’re a weekly round-up of geospatial news that’s kind of like Tensorflow — it’s not really that cool, but some people are weirdly into it. Nonetheless, with takes like this, the aim is to make you a better geospatial data scientist in less than 5 minutes a week.
In today’s newsletter:
CO₂ Estimates: Daily global dataset for granular emissions tracking.
Super-Resolution: ESA’s Sentinel-2 model enhances satellite imagery.
Landslide Detection: New methods to improve disaster monitoring.
Migration Data: NASA tracks climate-driven mobility in Africa.
Land Cover: GLanCE provides 30m-resolution land cover trends.
Research you should know about
1. Estimating CO₂ at granular levels

With so much focus now on climate change, there’s a lot of hunger for granular and real-time estimates of carbon emissions — particularly for CO₂.
My go-to CO₂ resource has been the European Commission’s EDGAR dataset, but their geospatial data (which is available at 0.1 degrees — i.e. roughy 11km2) is only available up to 2023. This is obviously a problem for more real-time estimates.
To address this issue, a new paper published in Scientific Data introduces a new method to produce global CO₂ measurements at a 0.1° resolution (~11km2). It does this by merging together three different sources of CO₂:
NASA’s OCO-3 (high-precision but limited coverage)
JAXA’s GOSAT (broader but coarser data)
ECMWF’s CAMS (a gap-free baseline from reanalysed models)
The researchers use two methods to fill in missing data: DINEOF and DINCAE:
DINEOF interpolates gaps using patterns in the data
DINCAE enhances this with deep learning to capture more complex spatial and temporal trends.
This hybrid approach is the paper’s main value-add. And the high correlation scores (0.94–0.95) with ground-based TCCON measurements, suggest it works pretty well.
That said, there are a couple of things to be aware of.
First, this is a measure of XCO₂ (i.e. ‘column-averaged CO₂). This is essentially a way to measure how much CO₂ is in the air above a spot on Earth. So it averages up all of the CO₂ present in a column between a spot on the earth and the top of the atmosphere (sort of like this):

While useful, this makes it difficult to pinpoint exactly where the CO₂ may be coming from. And as you probably guessed, CO₂ should be higher the closer you are to the ground (since it comes from cars, factories, etc.). However, we can’t see the vertical distribution of CO₂ when looking at XCO₂ measures.
The second limitation is their reliance on CAMS reanalysis data. The authors create their measure by merging data from the OCO-3 and GOSAT satellites with a reanalysed product from the Copernicus Atmosphere Monitoring Service (CAMS). In simple terms, CAMS data is modelled data. It’s not purely ground-truth observations. So there could be risks when you’re creating a model using data from a model.
That said, they are blending this data with other measured sources of CO₂, which should help address data quality issues.
On the whole, I think this is a pretty interesting methodology that I’m going to have a lot of fun playing around with.
You can access the code here.
2. ESA’s new open-source Sentinel-2 super-resolution model
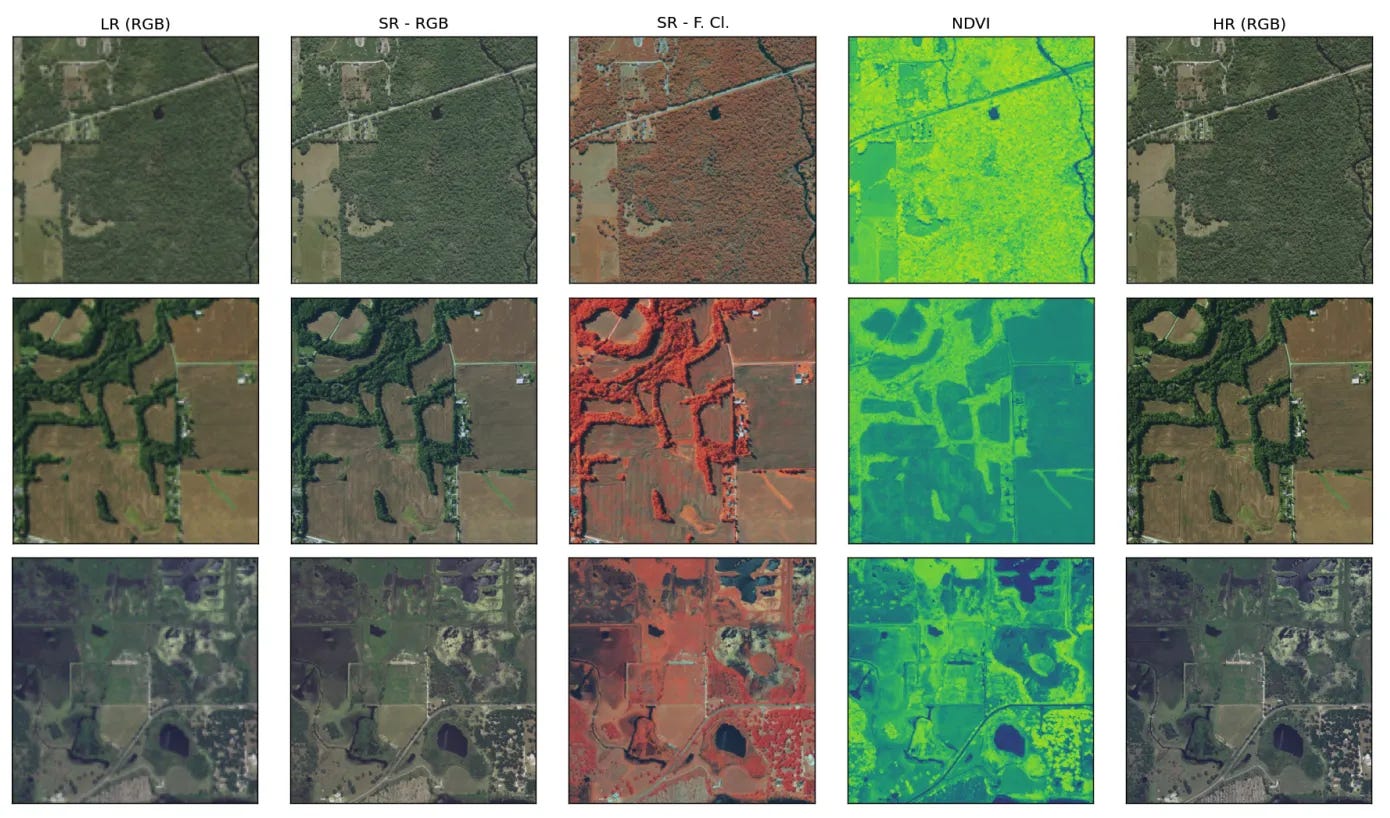
The team from ESA’s OpenSR have published the results of their approach to Sentinel-2 satellite image super-resolution in IEEE.
The proposed model, LDSR-S2, is the first multispectral remote sensing SR diffusion model that’s efficient enough to process large-scale datasets while also providing a pixel-wise uncertainty metric (which assesses the reliability of the enhanced imagery).
The study builds on latent diffusion models, which use deep learning to generate realistic high-resolution images by refining noise into structured data. Unlike more traditional diffusion models that operate directly in pixel space (which is computationally expensive), LDSR-S2 processes images in a compressed latent space, which massively reduces computational costs.
The model is trained on a mix of datasets:
OpenImages (for general image features),
and the SEN2NAIP dataset (which creates synthetic co-registered data between Sentinel-2 and NAIP).
The model learns to enhance Sentinel-2 RGB and near-infrared (NIR) bands from 10m to 2.5m resolution. Importantly, its probabilistic nature allows the generation of uncertainty maps, which highlight regions where the SR results may be less reliable.
The findings show that LDSR-S2 outperforms other state-of-the-art SR models, including GAN-based approaches, in preserving spectral fidelity while introducing meaningful high-frequency details.
What I really like about this approach is the inclusion of pixel-wise uncertainty metrics. At the end of the day, everyone is quite sceptical about the accuracy of super-resolved images. So uncertainty metrics make it easier for us to assess the reliability of the SR results. In case you’re interested, I’ve covered this topic in more detail here.
The model code and pretrained weights are available at GitHub.
3. Detecting landslides quickly using free satellite images

A new study published in Scientific Reports has put together a quick way to detect landslides by comparing before-and-after Sentinel-2 images.
To do this, they used the ‘Tasseled Cap Transformation’, which measures the brightness, greenness, and surface moisture in the landscape. When they subtracted these values between images acquired before and after a 2019 landslide in Italy, the area impacted by the landslide could be seen pretty clearly.
The researchers evaluated their results using a drone-based orthophoto (10-cm resolution) and found that the method captured the landslide area with strong accuracy (95%). Their approach works for most landslide types that change surface reflectance. Of course, clouds, pixel size, and places with similar surface properties will probably introduce errors.
Nonetheless, the main value-add of this approach is that it doesn’t use traditional supervised classification methods, which require a lot of computation and training data. Instead, this method just relies on spectral changes, from free images, which makes it pretty useful for quick and free approaches to disaster monitoring.
Geospatial datasets
1. Bilateral migration projections dataset

NASA’s Africa Climate Mobility Initiative (ACMI) Bilateral Migration Projections dataset models migration flows across 46 African countries from 2015 to 2050 under different climate and socioeconomic scenarios. It tracks 2,070 migration corridors, combining Shared Socioeconomic Pathways (SSPs) and Representative Concentration Pathways (RCPs) to assess climate-driven mobility trends. The data supports the African Shifts Report, which helps policymakers and researchers understand and plan for future migration patterns.
2. Global land cover estimation dataset
The GLanCE (Global Land Cover Estimation) dataset provides 30 m annual land cover data for Oceania, the Americas, and Europe from 2001 to 2019, using Landsat imagery. It tracks land cover changes, greenness dynamics, and tree phenology, offering insights into ecosystem trends over time. Africa and Asia datasets are expected soon.
3. Historical population grid data

The HIPGDAC-ES dataset provides historical population grids for Spain from 1900 to 2021, with 100 m × 100 m and 1 km × 1 km resolutions. Using cadastral records and census data, it reconstructs long-term population distributions.
Other useful bits

A new report published by FAO and UNOOSA discusses how geospatial technology can help improve global food security and strengthen agriculture systems. As usual with these types of reports, it calls for better access to satellite data, stronger international collaboration, and improved data interoperability to benefit small-scale farmers and developing countries. It also showcases FAO’s geospatial tools, like SEPAL and WaPOR, which provide real-time monitoring for land and water use.
PyForestScan is a new open-source Python library for calculating forest structural metrics from lidar point cloud data at scale. It computes key metrics like canopy height, plant area index, and foliage height diversity, with support for formats like EPT, .las, .laz, and .copc. You can check out the code here.
OpenSTARLab is an open-source AI sports analytics platform designed to make professional football data accessible (in case that’s your jam). You can check out the project in more detail here.
The geospatial analytics market is set to grow from $83.93B in 2024 to $230.67B by 2033, at a CAGR of 11.9%, driven by urbanisation, AI integration, and demand for smarter spatial solutions. North America leads the market, with major players like Esri, Hexagon, and Microsoft driving innovation across industries like transportation, defence, and urban planning.
Jobs
ESA is looking for a Graduate Trainee in Earth Observation Commercialisation.
Carbon Direct is looking for a Research Associate (Forestry Landscape Decarbonization) to join their Science & Advisory team(s), with an emphasis on nature-based climate solutions.
MSF is looking for a Graphics and Communication Intern based in Geneva, Switzerland to help their GIS Team.
Mapbox is looking for a Software Development Engineer for their Navigation API team.
UNEP is looking for an Intern for geospatial data analysis who will be based in Nairobi, Kenya.
International Telecommunication Union is looking for a Data Scientist who will work under their Future Networks & Spectrum Management Division.
Just for fun
New ESA observations have lowered the impact probability of asteroid 2024 YR4 from 2.8% to just 0.16%. So I guess this means Don’t Look Up is becoming less relevant?
That’s it for this week.
I’m always keen to hear from you, so please let me know if you have:
new geospatial datasets
newly published papers
geospatial job opportunities
and I’ll do my best to showcase them here.
Yohan