

🌐 Predicting commuter patterns from space
PLUS: New approaches to assessing building damage, estimating road crash risk and more.

Hey guys, here’s this week’s edition of the Spatial Edge — think of us as a safe space for the EPSG:4326-curious. The aim is to make you a better geospatial data scientist in less than five minutes a week.
In today’s newsletter:
Damage Mapping: Sentinel data maps disaster damage effectively.
Road Safety: Probabilistic model predicts crash risk uncertainty.
Human Mobility: Satellite imagery predicts urban movement flows.
Renewable Energy: Microsoft maps global solar and wind sites.
Fire Emissions: Global database tracks landscape fire emissions.
Research you should know about
1. Predicting human mobility flows from satellite imagery

Understanding how people move around cities is obviously quite important for transport systems and urban planning. Traditionally, we’ve relied on expensive surveys or mobile phone data to track these mobility flows. However, surveys are costly to update and mobile data comes with privacy concerns. A new study in Nature Communications proposes a different approach called Imagery2Flow. It uses a deep learning model to predict human mobility flows directly from satellite imagery. The authors tested this on the top 10 largest metropolitan areas in the US to see if the built environment alone could reveal how populations move.
The researchers developed a framework that extracts visual features from medium-resolution satellite imagery like Sentinel-2 and Landsat-8. The model encodes these images into high-dimensional vectors and uses a Graph Attention Network (GAT) to understand the spatial interactions between different areas. Essentially, it learns to predict the number of people moving between locations by analysing the visual characteristics of the urban landscape. It looks at the texture and arrangement of urban features to infer movement patterns without needing direct tracking data of individuals. This allows it to generate origin-destination matrices purely from open-source imagery.
The results were pretty impressive. The model outperformed traditional gravity and radiation models and even beat other deep learning baselines. Specifically, using 10-metre resolution imagery reduced the Root Mean Square Error by a range of 4.5% to 13.9% compared to machine learning models that just use visual features. Interestingly, the study found a strong link between the predicted mobility patterns and urban morphology. The model also showed good transferability. A model trained on data from 2020 could accurately predict flows using imagery from 2010. This suggests that the physical structure of a city holds deep clues about how we move through it.
You can access the code here.
2. Some surprising findings on resolution and damage mapping
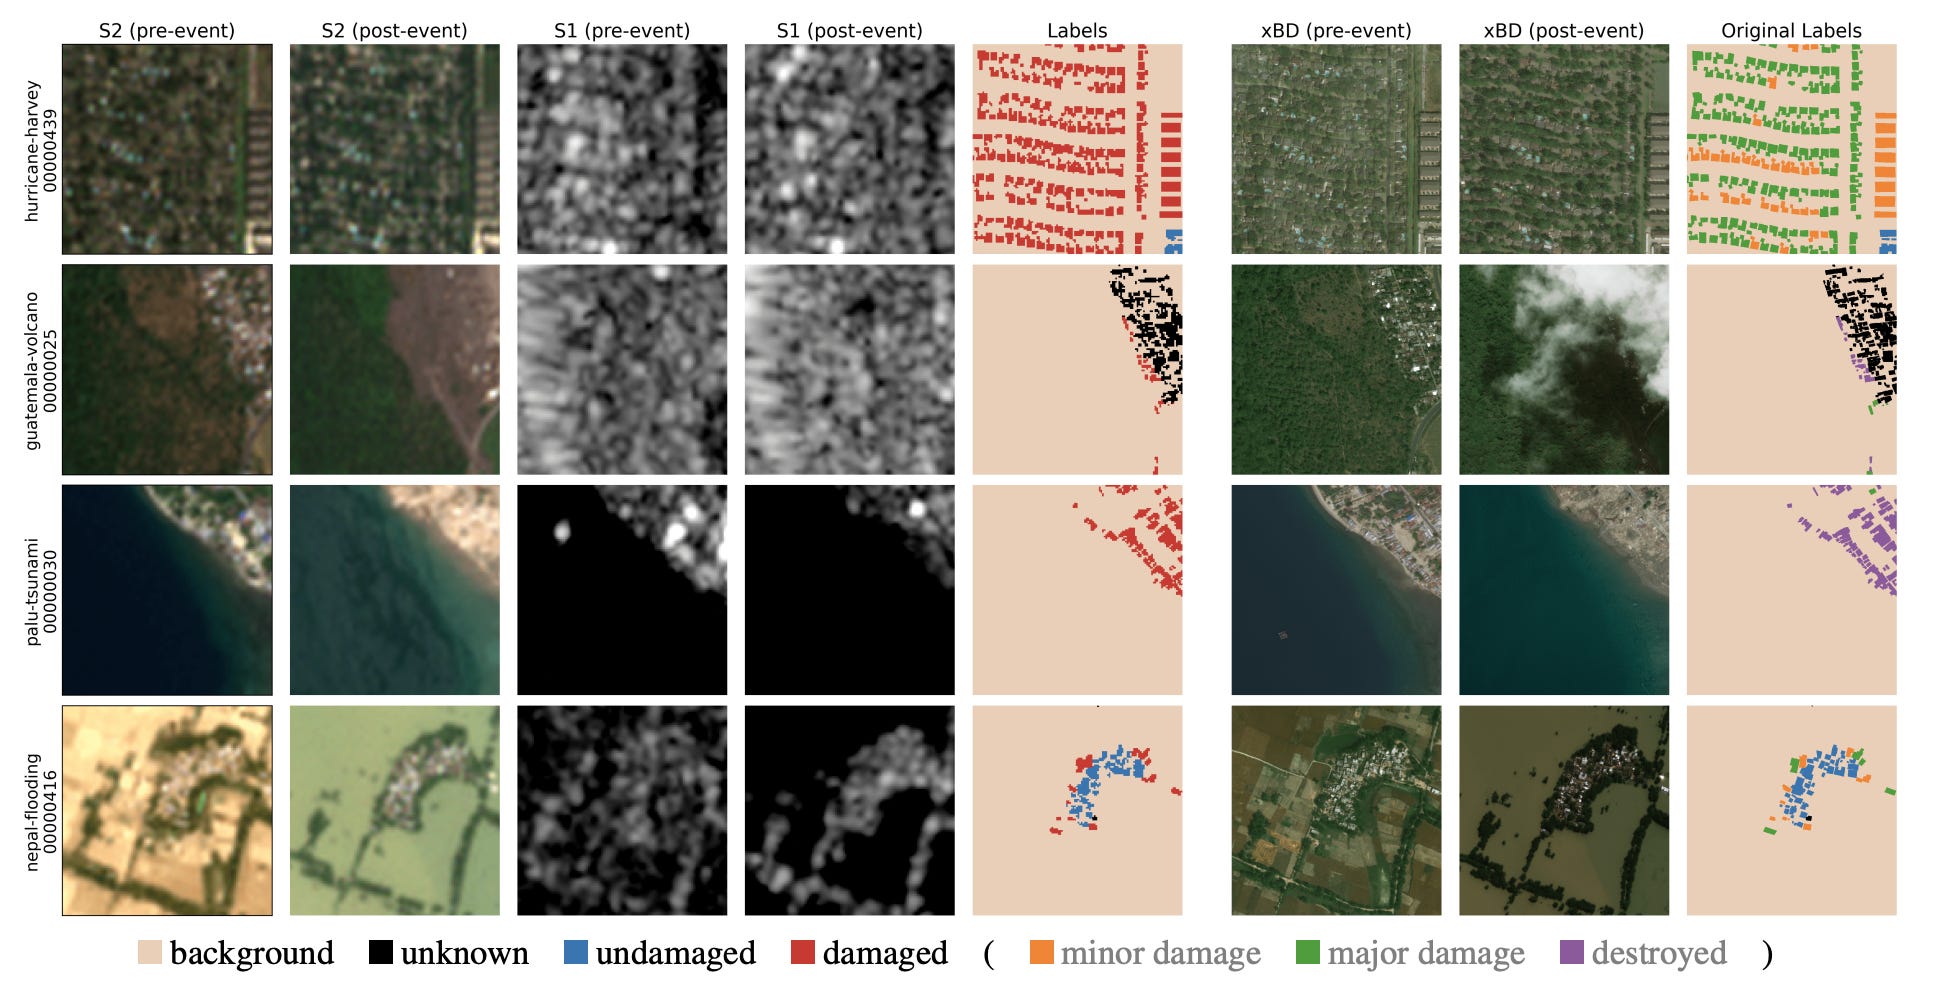
Accessing Very High Resolution (VHR) imagery immediately after a disaster is often difficult or prohibitively expensive for humanitarian agencies. A new study from ETH Zurich investigates whether free, medium-resolution data from the Copernicus programme can effectively fill this gap. The researchers introduced xBD-S12, a massive dataset that pairs over 10,000 pre- and post-disaster image pairs from Sentinel-1 and Sentinel-2 with the established xBD benchmark. Their goal was to determine if these 10-metre resolution images could detect building damage across various disaster scenarios, ranging from floods to wildfires, without relying on commercial providers.
The results indicate that while resolution is a constraint, it isn’t a dealbreaker for every scenario. The models performed surprisingly well for large-scale events like wildfires and floods where spectral signatures change dramatically over wide areas. However, the 10-metre ground sampling distance struggled with sparse damage events, such as weak earthquakes where only individual buildings were affected amidst a dense urban fabric. The authors also found that architectural sophistication provided little advantage here. Simple U-Net models actually outperformed complex geospatial foundation models like Prithvi or DOFA, particularly when the models had to generalise to unseen disasters.
To achieve these results, the team adopted a two-step approach that first localises buildings and then classifies the damage. This method proved more robust for unseen locations compared to trying to do everything in a single joint optimisation step. Ultimately, this research suggests that while Sentinel data can’t quite replace VHR imagery for detailed forensic analysis, it serves as a powerful and accessible complement for rapid, wide-area assessments. It allows humanitarian teams to get a pretty big head start on understanding the extent of destruction when aerial or high-resolution satellite data is unavailable.
3. Estimating road crash risk and uncertainty from satellite imagery
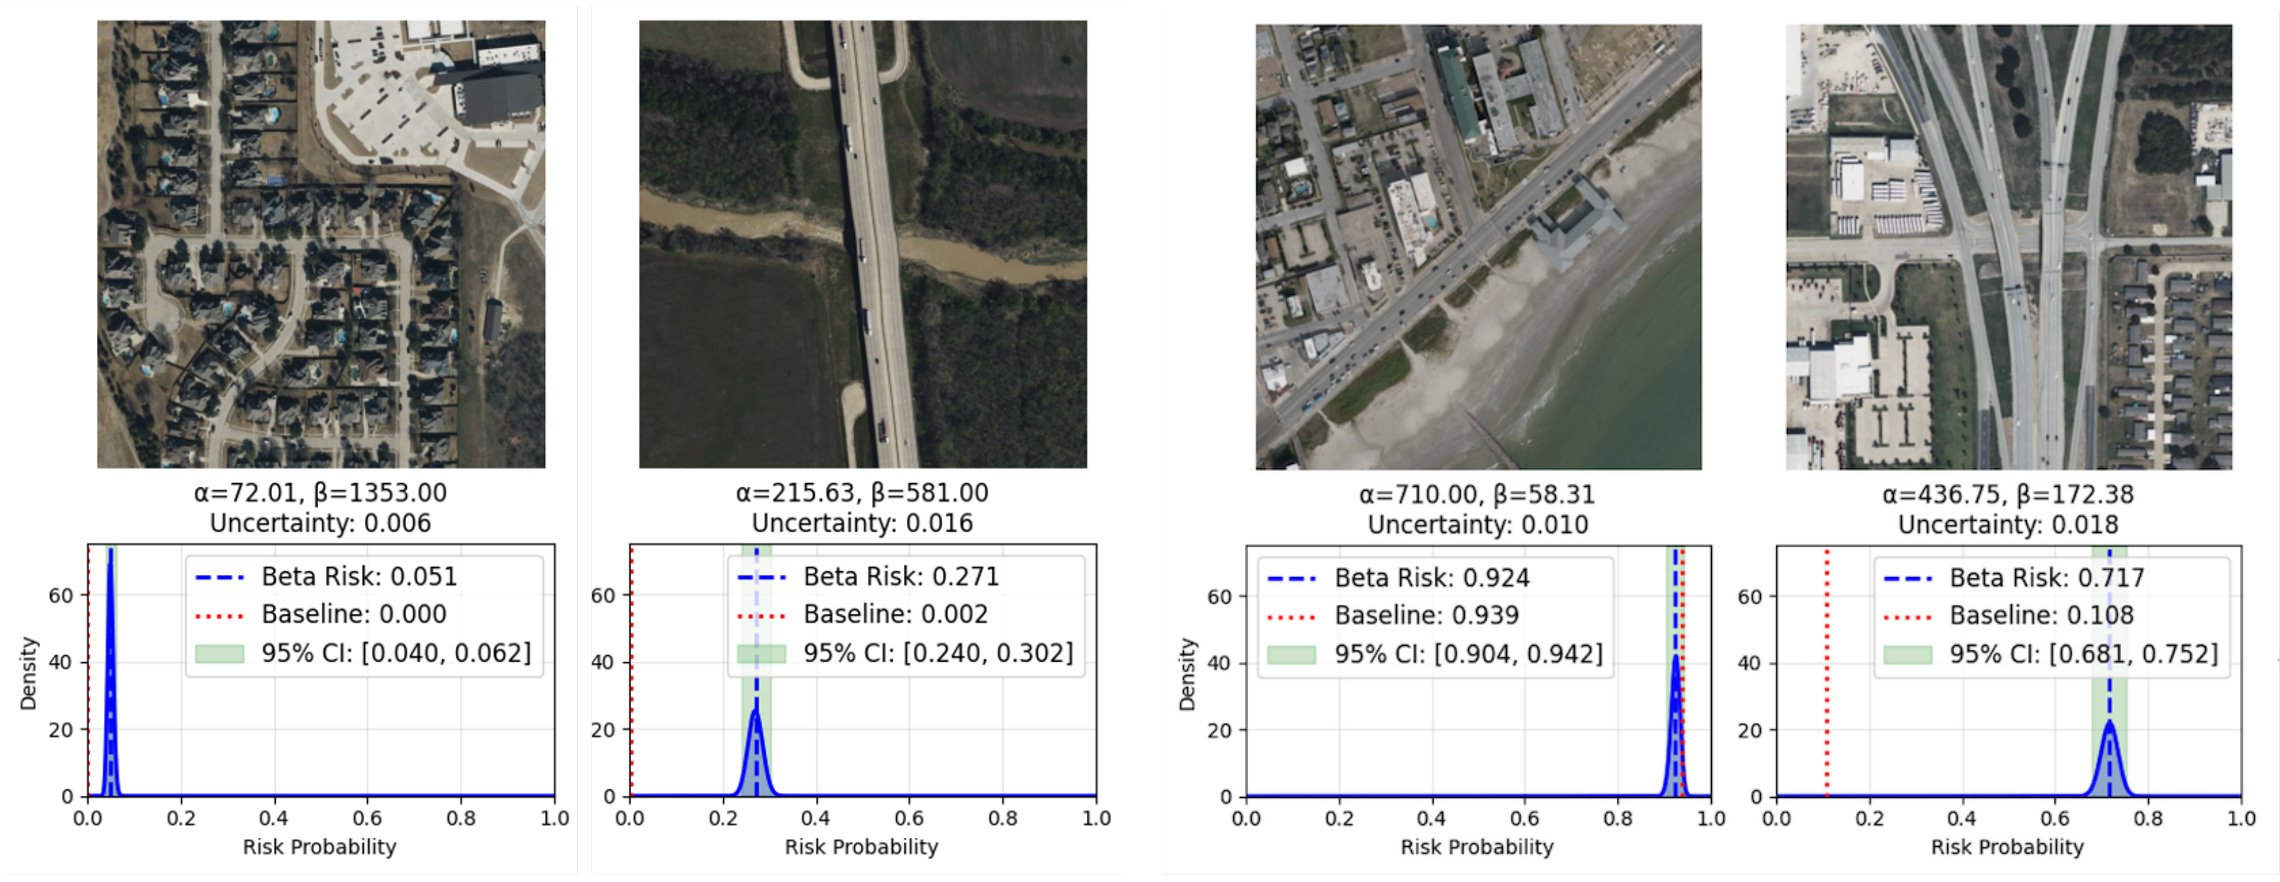
Most models trying to predict car crash risk from satellite imagery have a pretty big flaw. They tend to be overconfident binary classifiers that just spit out a single “crash” or “no crash” prediction. A new study that’ll be presented at AAAI’26 proposes a smarter way to handle this using something called Beta Distribution Learning. By moving away from static yes or no answers, their model generates a full probability distribution for every location. This allows the system to express uncertainty, meaning it can tell you if a road looks genuinely safe or if the model just isn’t sure because the visual data is ambiguous.
The researchers achieved this by using a clever procedural labelling technique during training. When the model looks at a satellite image crop, it calculates an “influence score” based on how close a crash site is to the centre of the image and the size of the crop. This teaches the neural network that visual evidence is stronger when hazards are front and centre. Consequently, the model outputs two parameters (alpha and beta) that define a curve. A sharp peak in the curve means the model is highly confident in its risk assessment, while a flat, wide curve signals that the model is uncertain. It’s a lot more nuanced than a simple binary label and helps distinguish between safe roads and confusing ones.
Testing this on a dataset of Texas roadways showed that this probabilistic approach is much more reliable than standard methods. The model improved recall by around 20 per cent compared to state-of-the-art baselines, meaning it successfully identified many dangerous locations that other models missed. In a case study of the San Antonio River Walk, it correctly flagged a hazardous intersection near a parking garage that earlier models ignored. Even when the model made “mistakes” (like flagging a safe but complex highway interchange as risky), it did so with low confidence. This provides a helpful signal for human planners to investigate further rather than blindly trusting the machine.
Geospatial Datasets
1. Microsoft global renewables watch

Microsoft has released two global geospatial datasets mapping solar and wind energy installations worldwide, covering the period 2017 to Q2 2024. Together, they identify 375,197 individual wind turbines and 86,410 solar PV installations, each with estimated construction dates and associated land-use context.
2. Global fire emissions database

GFED5 is the latest version of the Global Fire Emissions Database, providing monthly global estimates of landscape fire emissions at 0.25° resolution from 2002–2022, with extensions back to 1997. You can access the data and code here.
3. Large reservoir operational variables dataset

GDROM v2 is a comprehensive open dataset covering daily inflow, release, storage time series, and operational rules for 2,017 large reservoirs across the contiguous United States. You can access the data and code here.
4. Potential light availability dataset

The SwissRad10 dataset provides nationwide, hourly maps of potential light availability across Switzerland at a 10 m resolution, covering a full annual solar cycle. You can access the data here and the code here.
Other useful bits
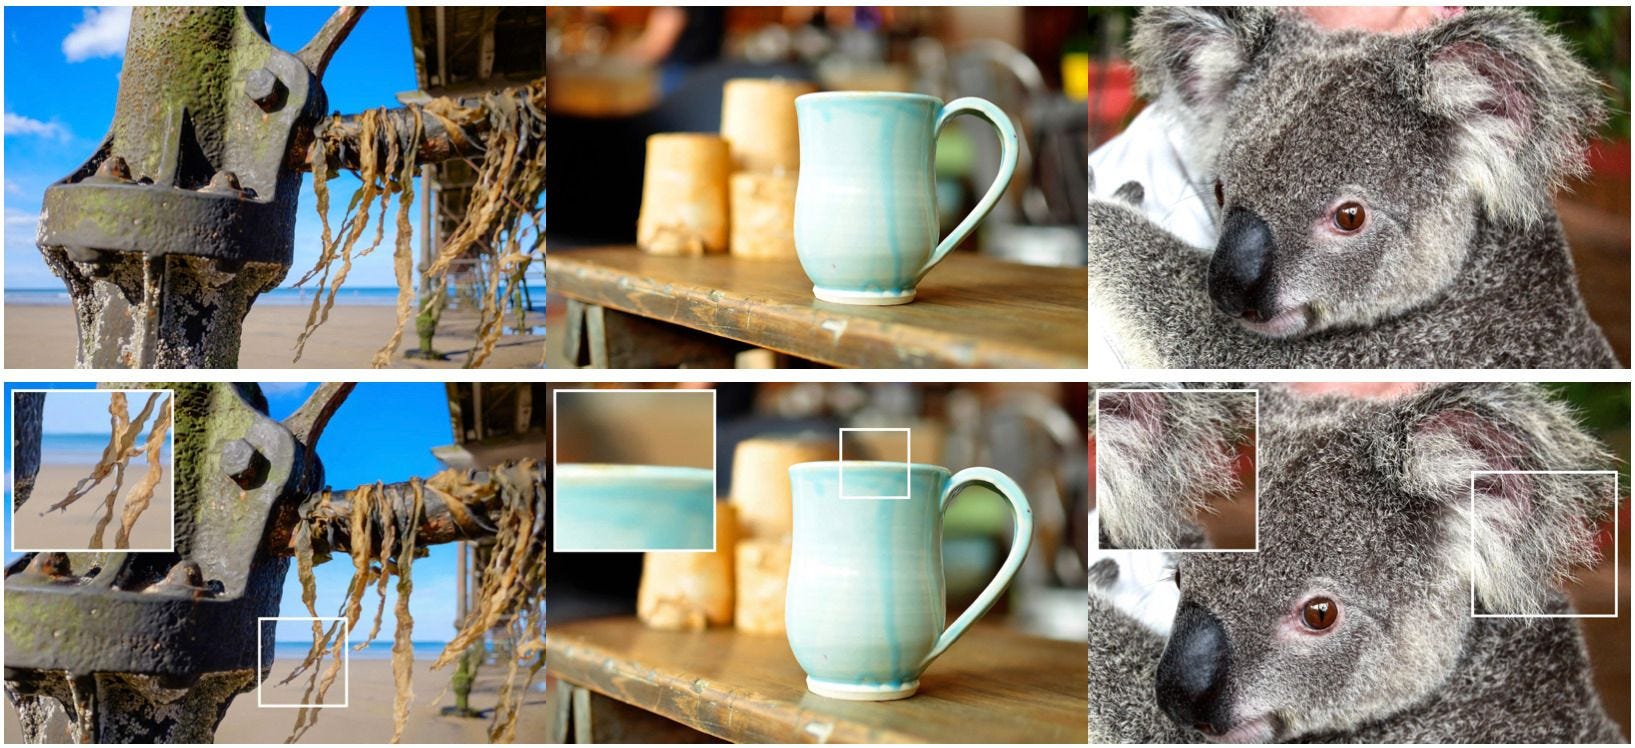
Apple’s SHARP shows just how fast things are moving in 3D vision: generating sharp, photorealistic new views from a single image in under a second. It delivers big quality gains across benchmarks while dramatically cutting compute time, opening the door to more lightweight and scalable 3D scene reconstruction.
Meta has released SAM Audio, a unified model that can isolate any sound from complex audio using text, visual, or time-span prompts— a big step forward for flexible audio understanding. The model, along with benchmarks and research resources, is now open to the community, opening up new creative and analytical possibilities across audio applications.
Copernicus Sentinel-2 satellites are teaming up in early 2026, with Sentinel-2A and Sentinel-2B flying in tandem to image the same locations just 30 seconds apart, helping fine-tune radiometric calibration across the constellation. This short but carefully planned campaign will further boost data consistency and quality for everything from precision agriculture to methane monitoring.
InSAR.dev has launched a new Sentinel-1 workflow on Google Colab, making burst-level InSAR preprocessing and analysis fast, portable, and genuinely reusable across platforms. With cloud-ready data, a GPU-accelerated phase unwrapper, and dramatic speed-ups (minutes instead of hours), it’s a big step toward making high-resolution elevation and deformation mapping accessible to everyone.
Jobs
Department of Political and Peacebuilding Affairs-Department of Peace Operations-Shared Structure is looking for a Geographical Information Systems Intern based in New York, USA
UNEP - United Nations Environment Programme is looking for an Intern for Policy and Analysis Unit based in Geneva, Switzerland
Resources for the Future (RFF) is looking for a Summer Research Internship based in Washington, USA
First Street is looking for a Lead Product Manager based in New York, USA
Just for Fun
This video shows how Earth rotates in space by stabilizing the Milky Way galaxy.
That’s it for this week.
I’m always keen to hear from you, so please let me know if you have:
new geospatial datasets
newly published papers
geospatial job opportunities
and I’ll do my best to showcase them here.
Yohan