Predicting food crises with geospatial data
PLUS creating high-res population estimates from satellites, measuring the impact of global crises on farmers, and how dietary shifts can impact GHG emissions.
Hey guys, welcome to this week’s edition of the Spatial Edge — a weekly round-up of geospatial news that you can digest in less than 5 minutes. This newsletter is a bit like one of those mystery socks in the laundry — you may not have wished for it, but here it is anyway.
In today’s newsletter:
Early Warning Systems: Predicting food crises with geospatial data.
Popcorn: Creating high-res population maps with satellite data.
Global Crises Impact: Phone data reveals smallholder farmer struggles.
Dietary Shifts: A study links food choices to GHG reductions.
EU Geospatial Platform: Visualising energy and industrial datasets.
Research you should know about
1. An early-warning system for food insecurity during humanitarian crises
A World Bank working paper presents a new early warning system for food crises in Yemen. It uses data on prices, conflict, drought, and displacement.
Their model tracks food and fuel prices, exchange rates, drought conditions, conflict-related fatalities, and displacement.
The model then sets thresholds for these indicators to trigger ‘alerts’ (i.e. elevated risk) or ‘alarms’ (i.e. critical risk). Using historical data, it predicts when food insecurity might escalate from a crisis to an emergency, by providing warnings up to five months in advance.
Their model also accounts for regional differences within Yemen (e.g., areas controlled by different factions).
They validated the results by comparing the model’s predictions with historical food insecurity data, optimising thresholds to balance false positives and negatives, and using cross-validation techniques.
2. Creating high-resolution population maps using satellite data
Researchers from ETH Zurich and the Environmental Computational Science and Earth Observation Laboratory have developed a new method called ‘Popcorn’ ("POPulation from COaRse census Numbers") to produce high-resolution population maps using free satellite data from Sentinel-1 and Sentinel-2.
They tested this approach with satellite data and coarse census information from Rwanda, Switzerland, and Puerto Rico.
Popcorn uses a dual-stream neural network. One stream is already trained to identify built-up areas from the Sentinel images, while the other stream, which can be trained further, estimates how many people occupy these areas.
Here’s how it works:
the pre-trained branch detects built-up areas,
the trainable branch estimates the occupancy rate for each area,
the final population map is created by multiplying the built-up score by the occupancy rate for each pixel.
The model is trained with what's called "weak supervision," i.e. it uses coarse census data to guide its predictions. The training process adjusts the model to minimize the difference between its predicted population totals for different regions and the actual census counts.
Popcorn proved to be very accurate, even outperforming other methods, especially in areas with limited data. E.g., in Kigali, it achieved an R² of 66% with an average error of just ±10 inhabitants per hectare.
P.S. the code and datasets are all publicly available here.
3. Using mobile phone data to assess the impact of global crises on smallholder farmers
A new World Bank Working Paper uses geospatial phone data to examine the impact of global crises on smallholder farmers in Sub-Saharan Africa. Specifically, they look at how COVID-19 and the Ukraine invasion led to spikes in fertiliser prices.
The study uses high-frequency phone survey (HFPS) data collected between 2020 and 2024 from six countries: Burkina Faso, Ethiopia, Malawi, Nigeria, Tanzania, and Uganda. This is complemented with data from face-to-face longitudinal household surveys conducted under the Living Standards Measurement Study initiative. This combined data spans 34 survey rounds across these six countries.
Here’s what they found:
Fertilizer use stayed pretty steady during the crisis, though there were some drops in countries like Burkina Faso and Malawi. Poorer households were less likely to use fertilizer because it was too expensive.
Many households that did use fertilizer couldn’t get as much as they needed, mostly because they couldn’t afford it. This was especially true for poorer and more remote households.
To cope with high fertilizer prices and shortages, farmers cut back on how much they used, applied it to smaller areas, borrowed money, or sold assets. These strategies often led to lower productivity and made farmers more vulnerable.
4. How dietary shifts can impact greenhouse gas emissions
First up, let me say that I’m not a vegan. But I did find this study in Nature Climate Change pretty interesting. It explores the impact of dietary choices on greenhouse gas (GHG) emissions and examines how global diet shifts could reduce these emissions.
The researchers discuss how food systems contribute roughly one-third of global anthropogenic GHG emissions. A large part of these emissions comes from consuming animal-based products, (particularly red meat and dairy), which have high emission intensities per calorie compared to plant-based foods.
Using detailed geospatial household expenditure data covering 140 food products across 139 countries, the study shows that wealthier populations, particularly in high-income countries, have diets high in red meat and dairy, which are the most emission-intensive foods.
Geospatial datasets
1. Energy and industry geography lab
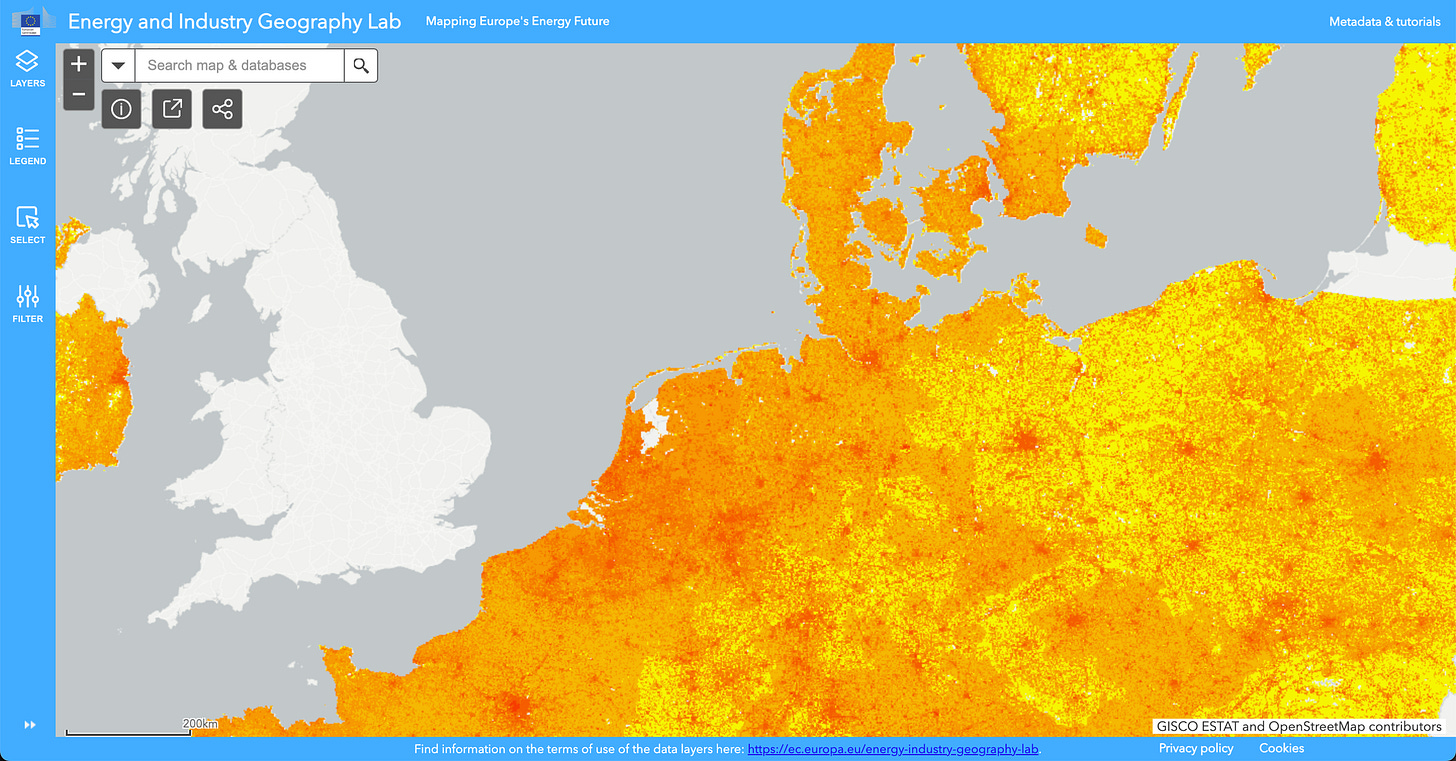
The EU’s Energy and Industry Geography Lab provides a nice tool to visualise a bunch of geospatial datasets like:
energy (e.g. location of power plants, electricity demand per sector)
transport infrastructure (e.g. location of ports)
environment (e.g. greenhouse gas emissions)
2. xView dataset
The xView dataset is a huge collection of overhead images from around the world, with objects marked using bounding boxes. It’s designed to improve computer vision tasks by detecting objects at lower resolutions, improving learning efficiency and enabling discovery of more object classes.
3. FIGARO tables
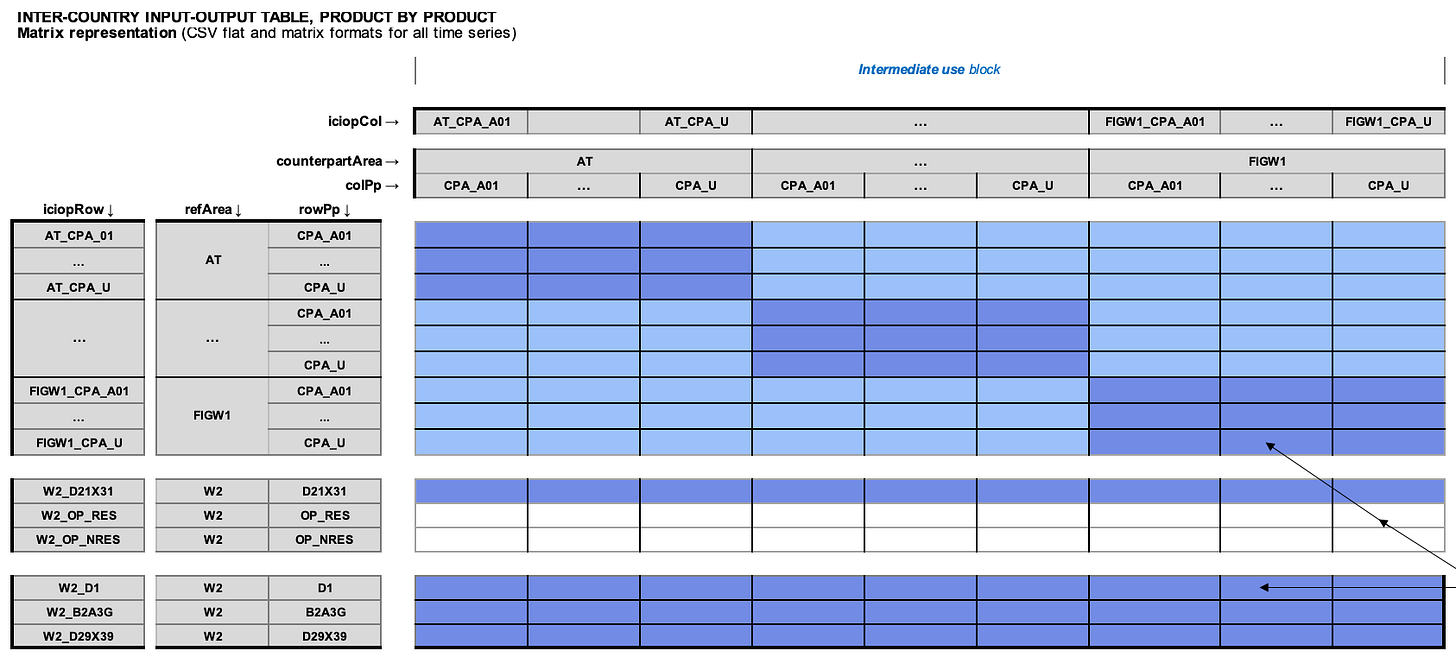
The ‘Full international and global accounts for research in input-output Analysis' (FIGARO) tables provide detailed data on trade between EU countries and with key global partners. This can help us analyse a bunch of socioeconomic and environmental impacts of globalisation. E.g., employment, value-added, and greenhouse gas emissions tied to EU exports. The latest edition (2024) covers data from 2010 to 2022.
4. Sentinel-2 dryland cropping
This study from the International Journal of Digital Earth found an effective way to map croplands and crop types in Senegal using Sentinel-2 satellite data and Spectral Matching Techniques (SMTs), even with limited ground info. We can access the data here.
Other useful bits
EUSI collected satellite images of wildfire damage near Athens, Greece, showing widespread destruction to land and structures. In these false-colour images, healthy vegetation appears red, making the blackened, burned areas stand out more clearly.
Amazon Conservation, using data from Planet, estimates that the Amazon rainforest held 56.8 billion metric tons of carbon in 2022. But with deforestation on the rise, the forest risks releasing more carbon than it absorbs. The bottom line here is that protecting the Amazon will help maintain its status as a carbon sink.
GEE Map has integrated Gemini to make it easier to generate code and visualise data on Google Earth Engine using natural language.
Jobs
Amazon Web Services is looking for a Solutions Architect who will be within the AWS Aerospace and Satellite Services organisation.
The United Nations Environment Program is looking for a data scientist based in Nairobi.
Chapman Tate is looking for 2 GIS Specialists who will be based in Dublin.
Arup is seeking Geospatial graduates for its Geospatial Graduate Development Programme in Dublin, commencing September 2025.
KBR is looking for a Chief Geospatial Data Scientist under its Science and Space (S&S) business unit to lead its data strategy efforts.
The University of Maryland is looking for an Associate Professor in Remote Sensing under the Department of Geographical Sciences.
The European Centre for Medium-Range Weather Forecasts (ECMWF) has four positions open for Machine Learning Scientist, Data Specialist and High-performance Computing Engineer.
Just for fun

That’s it for this week.
I’m always keen to hear from you, so please let me know if you have:
new geospatial datasets
newly published papers
geospatial job opportunities
and I’ll do my best to showcase them here.
Yohan


Best newsletter in my inbox!
Loved every bit as usual. I want to try to reproduce the food crisis prediction for Ghana to my best ability.