

🌐 Researchers tested 10 foundation models on SDG tracking. They flopped.
PLUS: Microsoft's climate model, mapping pollution from Flickr, and more.

Hey guys, here’s this week’s edition of the Spatial Edge — a newsletter that’s designed to make you the coolest person at your next dinner party (if you’re the type of person who likes to have dinner parties in the library, that is). The aim is to make you a better geospatial data scientist in less than five minutes a week.
In today’s newsletter:
AI Limitations: Earth observation models struggle with poverty tracking.
Pollution Mapping: Flickr photos help estimate PM2.5 air quality.
Weather Forecasting: Microsoft's Aurora model predicts climate faster than supercomputers.
Ship Emissions: Satellites detect nitrogen oxide pollution from individual vessels.
Disaster Response: New multi-modal dataset improves AI disaster assessment.
Research you should know about
1. Why Earth observation AI can't track poverty (yet)

As we’ve covered several times in this blog, geospatial foundation models are the equivalent of Pharrell in the 2000s. They’re absolutely everywhere… We've now got dozens of these models trained on satellite imagery, all promising to revolutionise how we monitor our planet.
And most of these models are tested on tasks that are, well, a bit academic. They're great at identifying trees or segmenting buildings, but can they actually help track progress on real-world sustainability challenges?
A team of researchers decided to find out. They created SustainFM, a benchmark that tests how well these foundation models can tackle tasks related to 16 different Sustainable Development Goals (SDGs). We're talking about everything from detecting poverty levels and monitoring children's health to tracking war damage and identifying illegal mining operations.
What they found wasn't exactly encouraging.
The models performed pretty inconsistently across different tasks. Some did pretty well on certain challenges (like detecting urban changes), but they sucked at others (e.g. estimating poverty levels). The average performance was about 60-70% for most models. That's not terrible, but it's not exactly game-changing for critical sustainability issues.
The researchers think it's because most foundation models are trained using techniques borrowed from regular computer vision. This is stuff like masking parts of images and trying to reconstruct them. But satellite data is pretty unique. It's got multiple spectral bands, comes from different sensors, and the physical constraints are totally different from your average Instagram photo. There's also a troubling scale problem: many of these models are "undertrained". I.e. they've got millions of parameters but haven't seen nearly enough diverse data to properly generalise.
The solution: physics-informed pretraining
The authors argue we need to rethink how we're building these models. Instead of just borrowing techniques from regular computer vision, we need approaches that actually understand the physics of satellite data. They dub this, "physics-informed pretraining", which can handle the spatial, spectral, and temporal aspects of Earth observation data.
Now this all sounds nice in theory, but the paper really lacks details on how this would work…
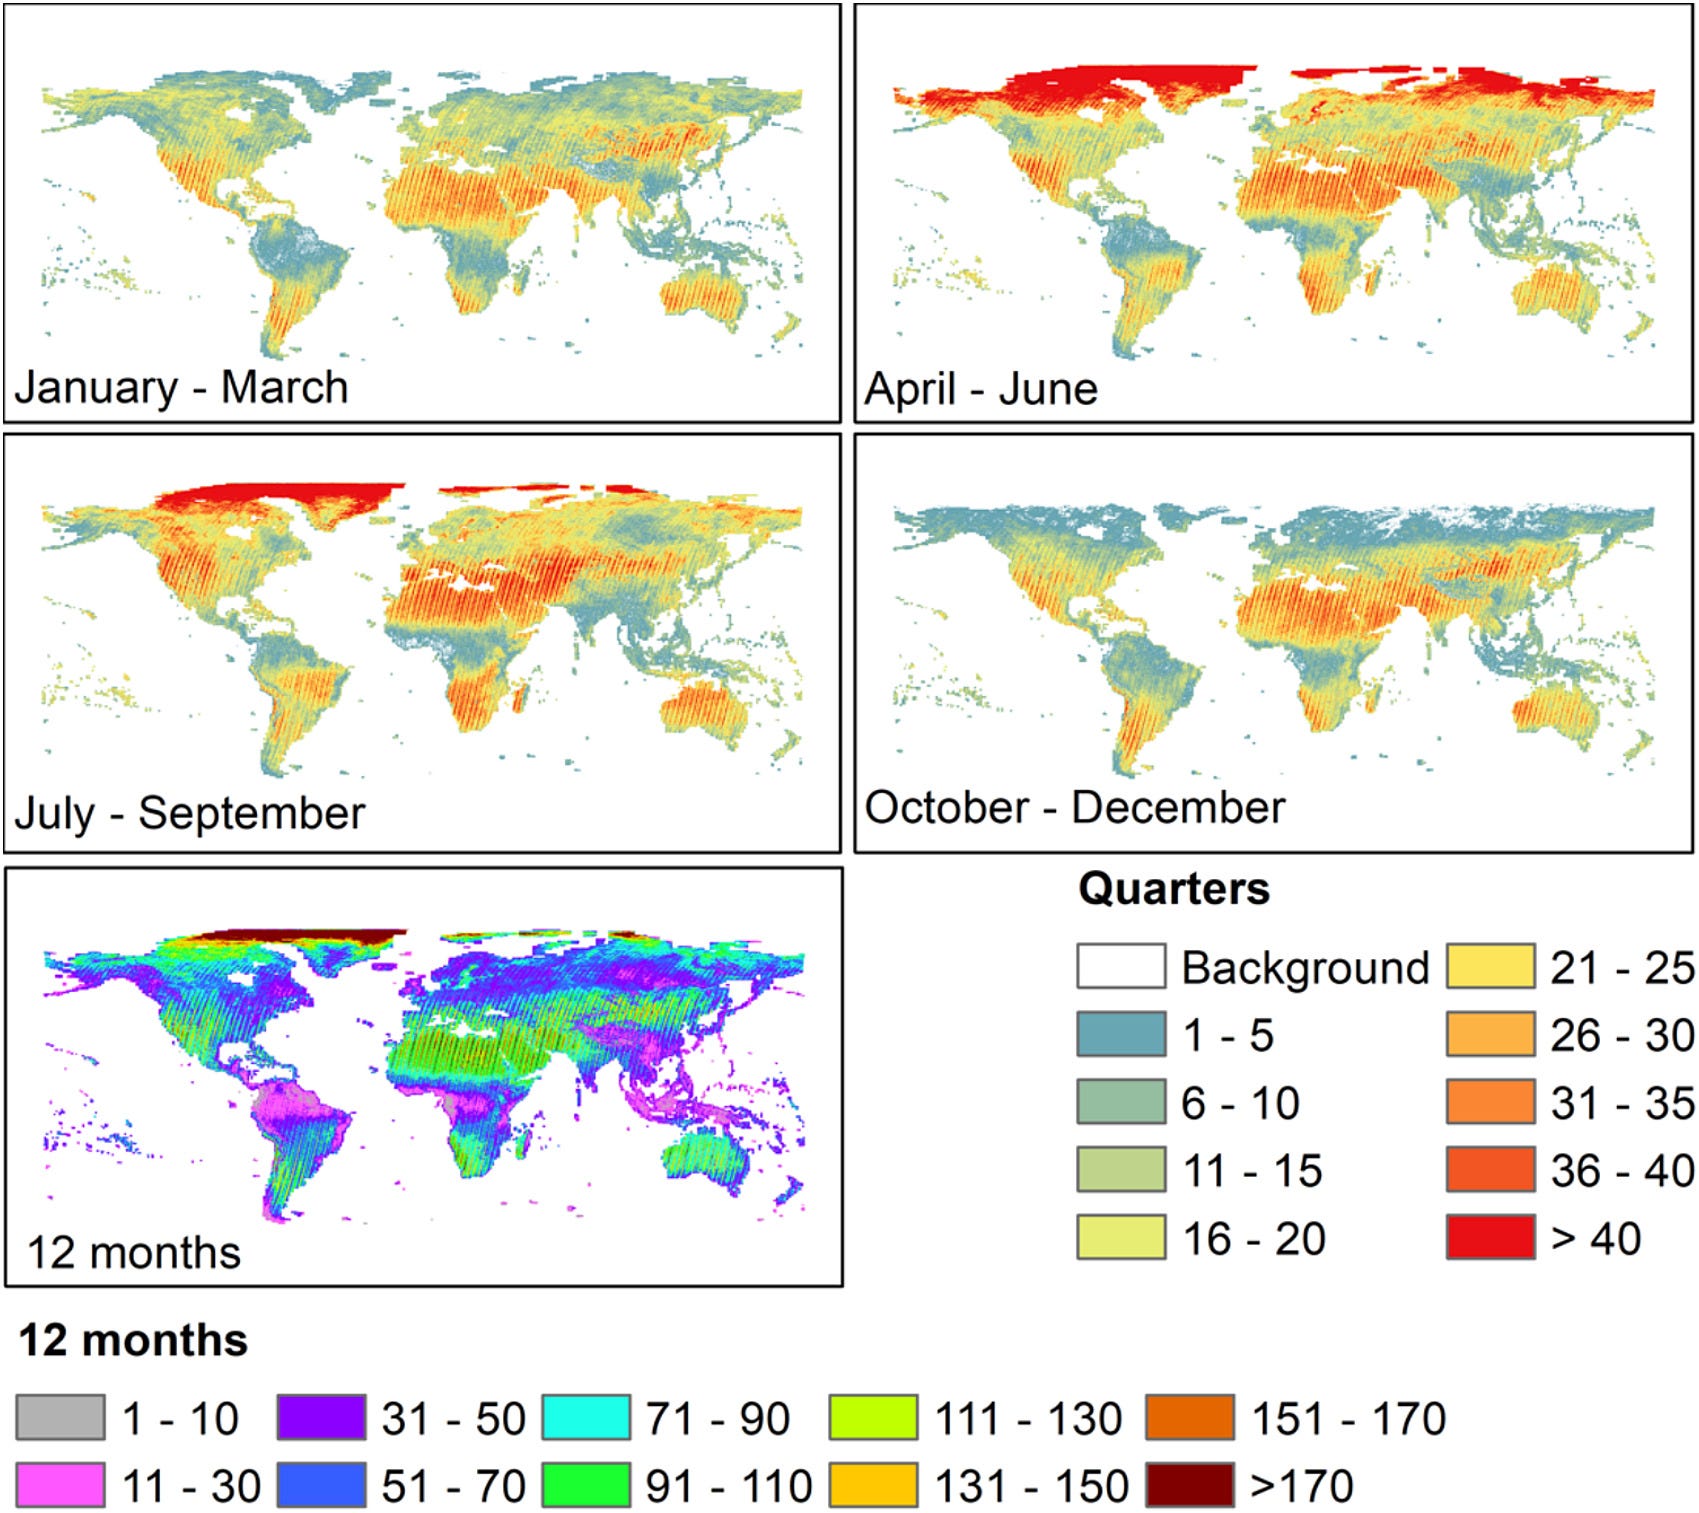
2. Mapping PM2.5 from Flickr photos

Estimating PM2.5 is tough, especially in areas without monitoring stations. A new study aims to do this using millions of photos from Flickr.
To do this, they used GeoCLIP, a pre-trained model that creates location representations from the Flickr photos. Rather than just knowing "this is 40.7°N, 74.0°W", GeoCLIP understands whether a location is urban or rural, industrial or residential. The results were striking: models using GeoCLIP improved within-region performance by 11% and, unlike raw coordinates, actually helped with predictions in new areas. They better captured pollution hotspots in cities like Los Angeles and Pittsburgh too.
But there's a catch. In rural areas with fewer Flickr photos, predictions got noisy with speckle-like patterns that probably weren't real. This highlights a key challenge of needing to these models to work in places where we don’t have a lot of data.
Anyway, the takeaway here is that if you're using location in your models, raw coordinates might seem obvious but can cause overfitting. Pretrained encoders like GeoCLIP are promising (in regions where lots of data is available).
You can access the data here.
3. Microsoft’s new foundation model that predicts weather, pollution and cyclones

And just when you thought I was done talking about foundation models, Microsoft came along with a new one, published in Nature. Most weather and climate forecasting systems are slow and expensive. They rely on complex physics-based models that take years to build and require supercomputers to run. A new geospatial foundation model called Aurora offers a much faster and more flexible alternative. Trained on over a million hours of Earth system data, Aurora matches or outperforms top forecasting systems across a range of tasks while running up to 100,000 times faster.
Aurora delivers some pretty strong results in four key areas: air quality, ocean waves, tropical cyclones and high-resolution weather. It beats CAMS air pollution forecasts on 74 percent of targets, improves on ECMWF’s ocean wave model in 86 percent of cases, and tracks cyclones more accurately than every major agency worldwide. It also produces 10-day weather forecasts at 0.1° resolution with better accuracy than the European Centre’s own high-res model.
The model is open-source and can be fine-tuned for new tasks using relatively little data. That makes it especially useful for countries and agencies without access to high-end computing infrastructure.
You can access the code here.
4. Detecting ship pollution plumes from space
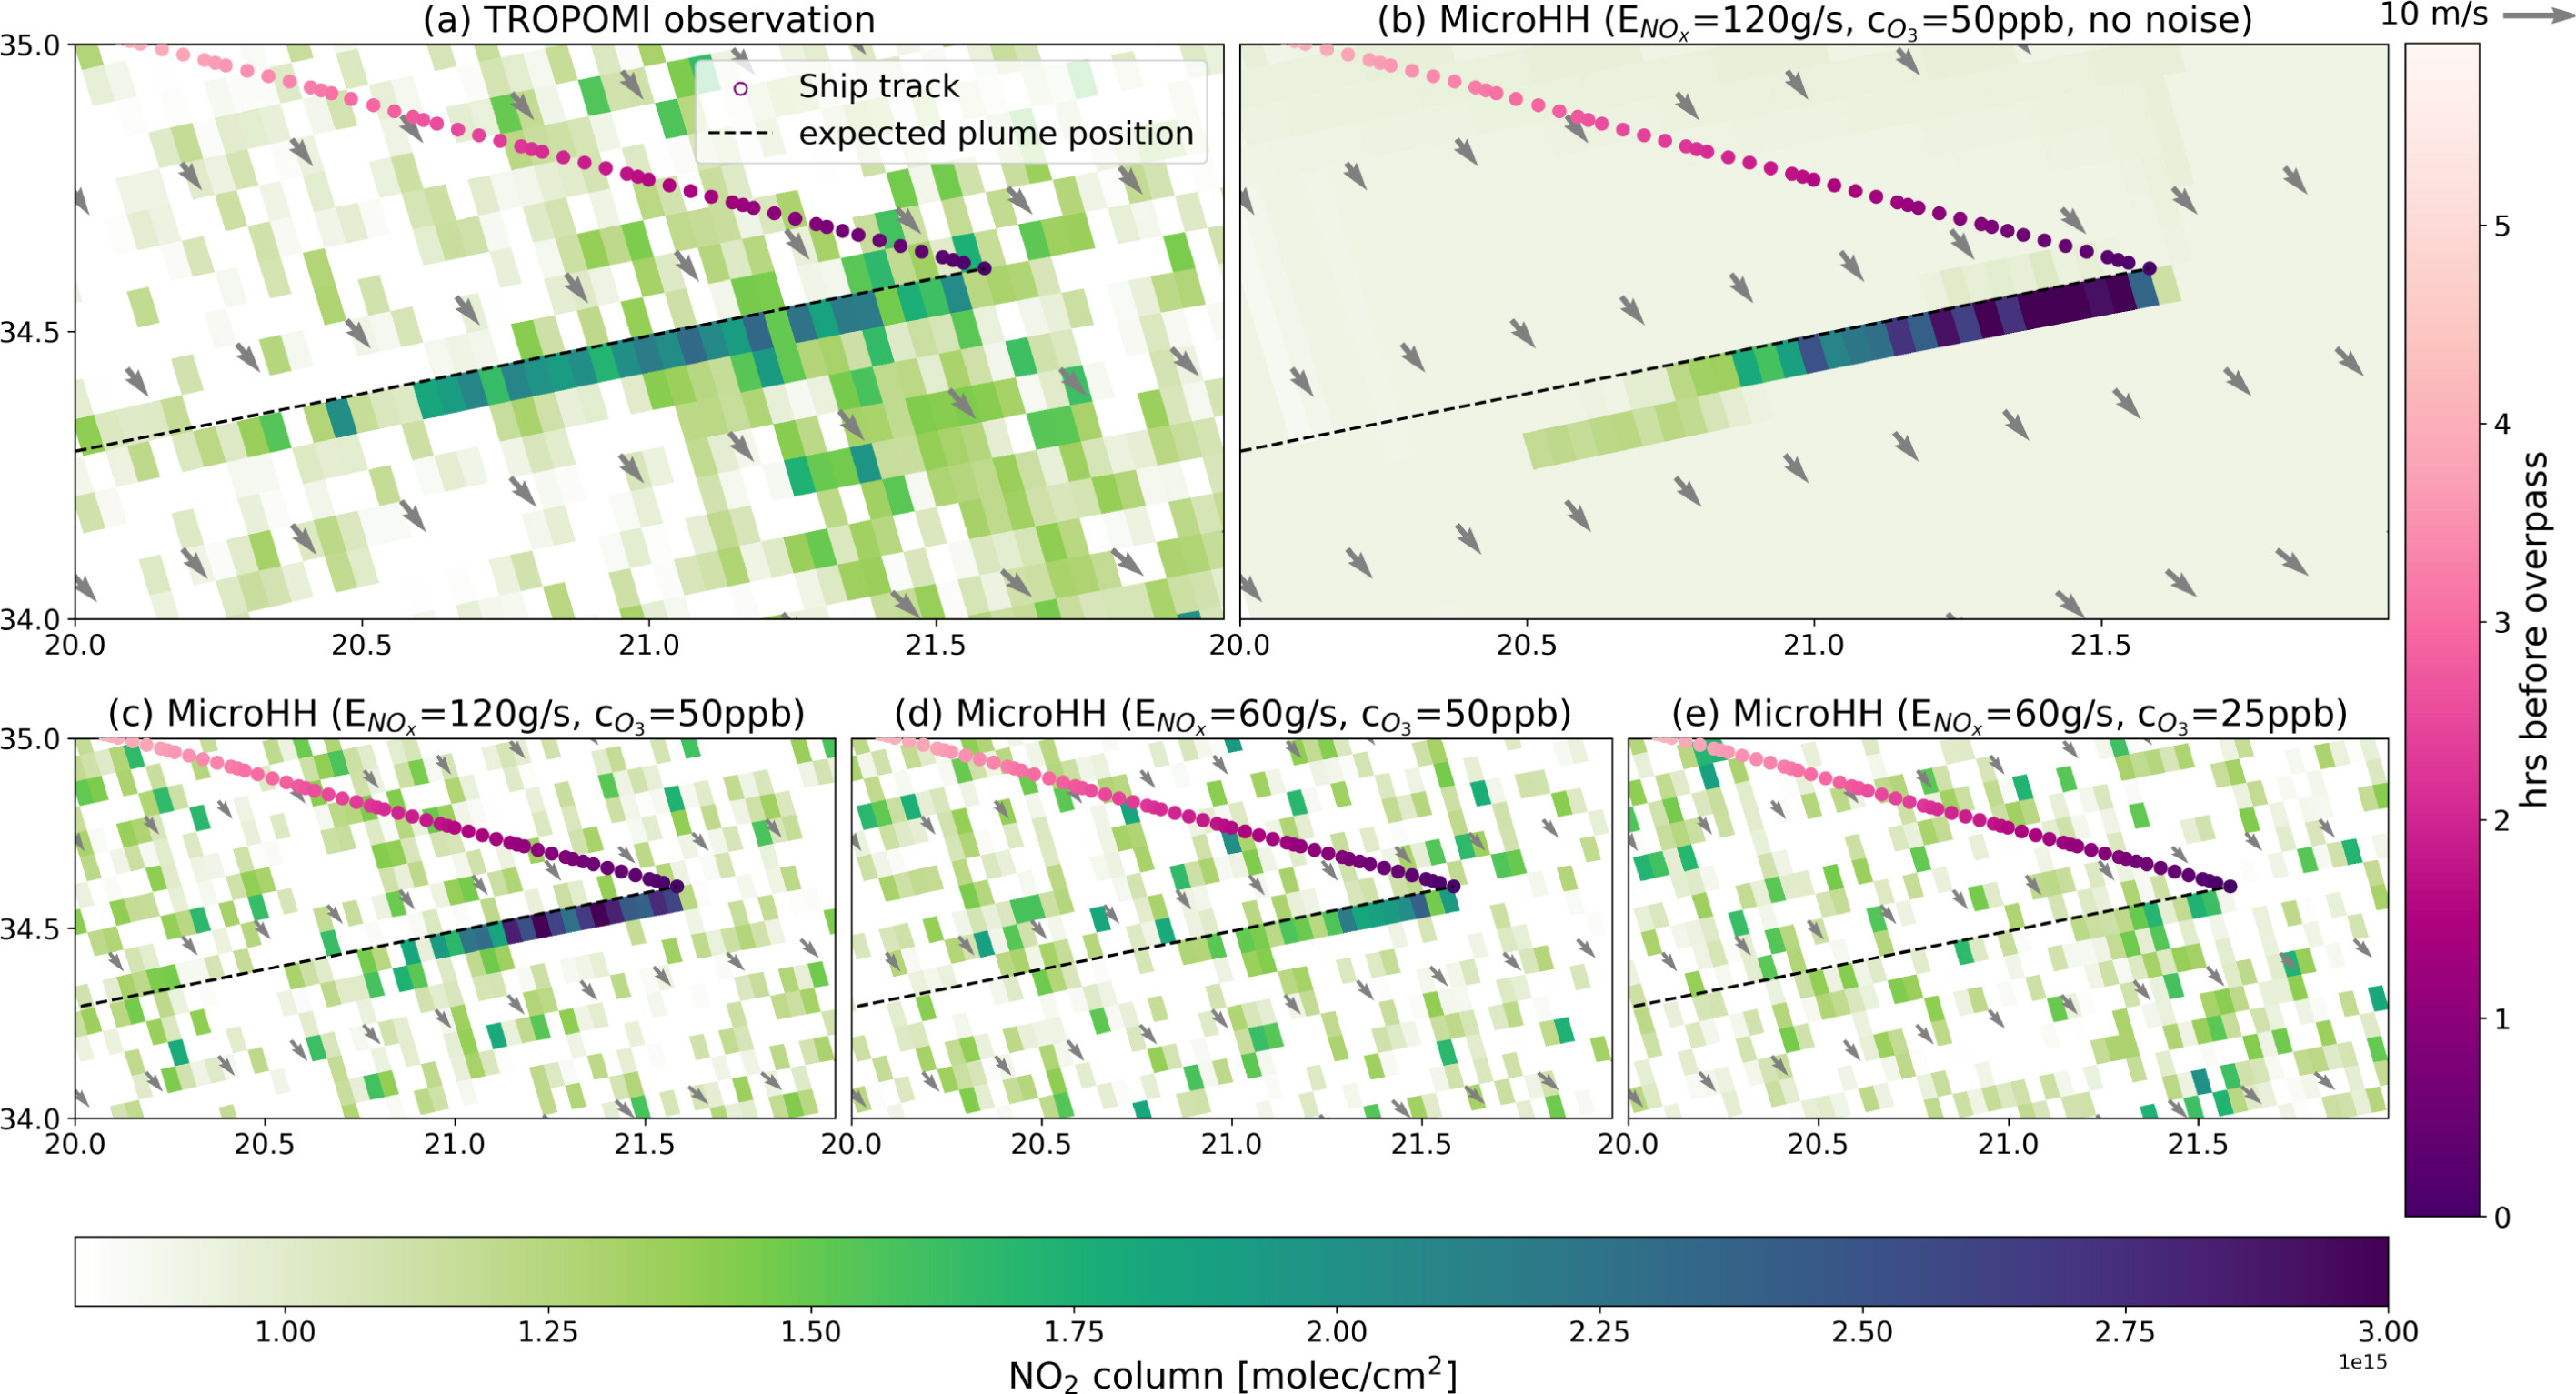
Ever wondered how we monitor pollution from ships way out at sea? Me neither. In any case, a new study in Remote Sensing of Environment came up with a novel way to estimate nitrogen oxide (NOx) emissions from individual ships.
Focusing on the eastern Mediterranean in 2019, they linked 130 NOx plumes to 119 ships, mostly big container ships sailing fast. By combining TROPOMI’s nitrogen dioxide (NO2) data with ship positions from the Automatic Identification System (AIS) and atmospheric models, they estimated emissions ranging from 10 to 317 grams per second.
The study found something surprising: newer Tier II ships (built after 2011) often had higher NOx emission factors than older Tier I ships, especially at low engine loads. About half of Tier II ships exceeded the International Maritime Organization’s (IMO) weighted average limits under MARPOL Annex VI. Ships are optimised for fuel efficiency at high loads, but in real-world slow-steaming, they actually produce more NOx.
Clearly NOx reductions aren’t going as planned. And this is kind of a problem since NOx forms ozone and aerosols that harm health and ecosystems in coastal areas. This satellite method could then be pretty important for emissions monitoring, flagging high polluters for inspection.
Geospatial Datasets
1. Disaster response dataset

DisasterM3 is a large-scale, multi-modal, and multi-task dataset built to improve how AI models assess and respond to disasters using satellite imagery. It includes over 26,000 pairs of pre- and post-disaster images (optical and SAR) from 36 major events across five continents, paired with more than 123,000 instruction–response pairs. The dataset spans ten disaster types (e.g. earthquakes, floods, explosions) and supports nine tasks such as damage assessment, object counting, relational reasoning, and disaster report generation.
2. Google DeepMind forest typology dataset

Google DeepMind is building AI-driven global maps that identify forest types and their role in biodiversity and carbon storage. The initiative includes upcoming layers on natural forests and the drivers of forest loss. Two benchmark datasets are already available: ForTy v1, a global multi-temporal dataset for forest-type segmentation, and Planted, a large-scale dataset for identifying monoculture plantations by species and genus. These tools aim to support better conservation and reforestation strategies.
3. Tree species classification dataset

GlobalGeoTree is a multimodal tress species dataset, comprised of 6.3 million geolocated samples covering 21,001 species. Each of these is paired with Sentinel‑2 time series, 27 environmental variables (bioclim, soil, terrain), and taxonomic labels down to species level. You can access the data here and the code here.
4. NASA surface reflectance dataset
HLS v2.0 is a global, 30 m surface reflectance dataset that fuses Landsat-8/9 and Sentinel-2A/B imagery into a harmonised, analysis-ready format. You can access the data here.
Other useful bits

Muon Space has released the first images from FireSat, its new wildfire-detection satellite. FireSat is the first in a planned 50+ satellite constellation that will scan the entire Earth every 20 minutes, using six infrared bands to detect fires as small as 5 m.
Microsoft has launched the public preview of Planetary Computer Pro, a cloud-based platform that simplifies how enterprises work with geospatial data. It helps organisations store, analyse, and scale massive satellite and sensor datasets using familiar Azure tools and AI workflows.
The World Bank has updated its global poverty lines using 2021 price data, raising the international poverty line from $2.15 to $3.00 per day. This reveals that 808 million people now fall under extreme poverty, which is 125 million more than earlier estimates. Poverty is shifting toward Sub-Saharan Africa and fragile states, and despite progress since 1990, the world is poorer than we thought.
The World Bank has also launched its first open-source software tool: the Metadata Editor. Designed to help manage and publish high-quality statistical metadata, the tool is now available on GitHub under an open licence.
Jobs
The European Bank of Reconstruction and Development is looking for data analysts, based in London.
UN is looking for a Geospatial Information Officer in New York to support the Geospatial Information Section under the Office of Information and Communications Technology (OICT).
Mapbox is looking for a US-based Software Development Engineer under its Location AI team.
IMPACT Initiatives is looking for a Global GIS Specialist based in Geneva and a remote Senior Data Officer.
Earthworks is looking for a US-based Data Analyst to help their Energy Team.
Just for Fun

This astrophotographer captured 225,000 photos of the Moon using two telescopes and cameras, creating a 500GB, 300-megapixel composite image with some amazing details and real colour. You can also notice some mineral differences in the image: reds for iron-rich areas, and blues for titanium.
That’s it for this week.
I’m always keen to hear from you, so please let me know if you have:
new geospatial datasets
newly published papers
geospatial job opportunities
and I’ll do my best to showcase them here.
Yohan
Thanks for sharing Yohan! Very interesting!