

🌐 Sentinel-1, but double the resolution
PLUS: The hidden impact of urban design on our health, Public R&D is making Europe’s regions more unequal and more.

Hey guys, here’s this week’s edition of the Spatial Edge — we’re a bit like the geospatial version of Windsurf: we have 4,000 people. In any case, the aim is to make you a better geospatial data scientist in less than five minutes a week.
In today’s newsletter:
Super-resolution: Doubling Sentinel-1 detail while cutting noise.
Urban design: Walkable cities boost daily step counts.
Public R&D: Funding flows widen Europe’s regional gaps.
Multi-hazards: Satellites map where disasters converge.
NVIDIA: New global reforecast dataset.
Research you should know about
1. Super-resolving and despeckling Sentinel-1 in one go
As you may know, Sentinel-1 is one of the most widely used radar satellites (I go into more detail here), but its imagery has a couple of big drawbacks:
relatively low spatial resolution and
heavy speckle noise.
Commercial SAR satellites provides sharper, cleaner images, but their costs put them out of reach for most researchers. Until now, most methods have tackled either resolution enhancement or speckle reduction, often relying on generative models that risk inventing artefacts and even reinforcing noise.
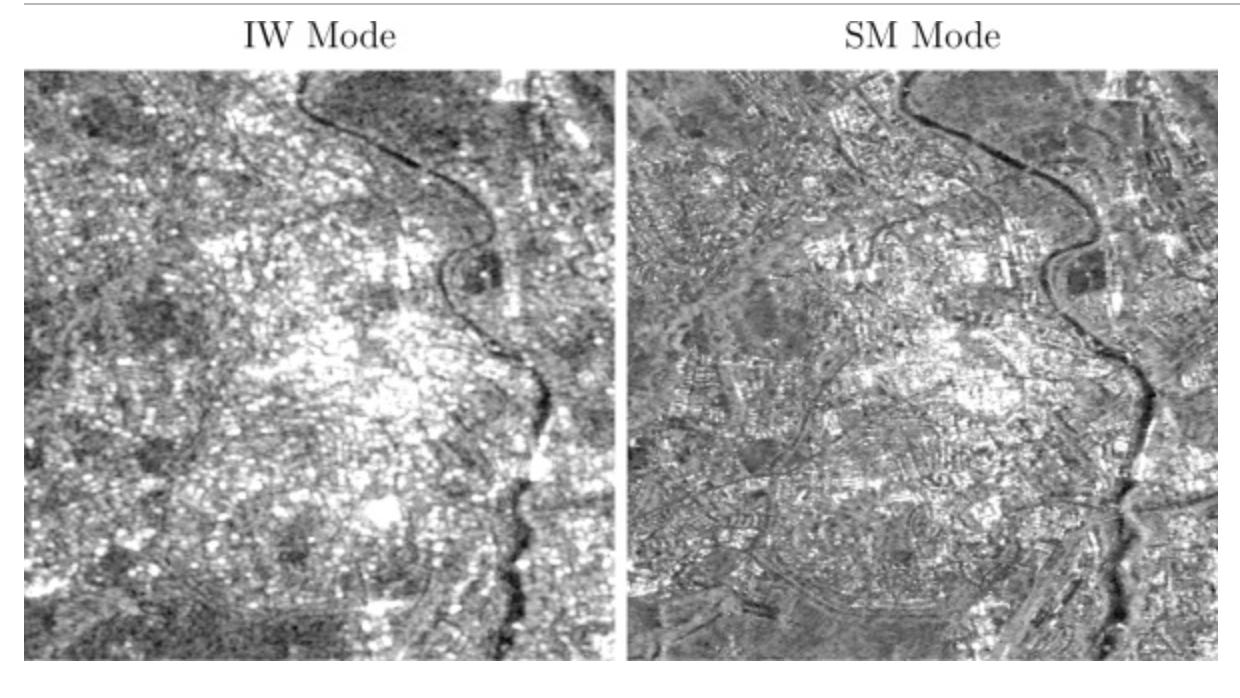
A new study from the team at Tracasa takes a different route by using non-generative deep learning models to both super-resolve and despeckle Sentinel-1 imagery. The authors train on pairs of images captured in two modes of the same sensor: Interferometric Wide Swath (the standard 10 m data) and Stripmap (higher resolution at 5 m). This pairing avoids some of the issues with using external commercial data while ensuring that sensor characteristics remain consistent. The result is imagery that doubles the effective resolution while cutting speckle noise at the same time.
The researchers also tested alternative model architectures and training setups, finding that an efficient transformer-based network (ESRT) outperformed their earlier design while reducing training and inference time by more than half. They found the SSIM loss function gave the best balance between sharpness and noise suppression. Compared with a strong benchmark method, their approach preserved fine details without oversmoothing. In short, this looks like a pretty practical way to make free Sentinel-1 data much more useful for downstream applications such as land monitoring, crop mapping, or urban analysis.
2. The hidden impact of urban design on our health

A new study in Nature has taken advantage of a large natural experiment to examine how city design affects physical activity. The researchers tracked 248,000 days of step counts from over 5,400 smartphone users who moved between 1,600 US cities. Because these relocations exposed individuals to different built environments, the team could isolate how walkability influences behaviour at the individual level.
They found a pretty clear pattern: moving to more walkable places led to more walking, and moving to less walkable places led to less. Surprise, surprise. On average, a relocation from a low-walkability city (25th percentile) to a high-walkability one (75th percentile) increased daily walking by about 1,100 steps, equivalent to 11 extra minutes per day. These gains held across genders, ages, and body types, and were sustained for at least three months. Importantly, the added activity was not just light movement but mostly brisk walking, the type most strongly linked to health benefits.
The effects were pretty consistent across seasons, income levels, and climates, and mirrored in reverse for people moving in the opposite direction. While the increase was smaller for older women, all other groups showed marked improvements. A simulation suggests that if all US cities had the walkability of New York, nearly 50 million more Americans would meet recommended activity guidelines. This provides strong evidence that urban design directly shapes population health.
You can access the data and code here.
3. Public R&D is making Europe’s regions more unequal

A new study looks at how public research and development (R&D) funding is spread across 200 European regions. The findings show that richer regions, those with more skilled workers and higher levels of business R&D, are the ones that receive more public R&D money. Capital cities also attract more funding, while manufacturing regions generally get less. This means public funds tend to flow into areas that are already well resourced.
Business R&D spending started out more unequal across Europe but has shown signs of catching up. Investment has grown fastest in lower-R&D regions, especially in Central and Eastern Europe. Public R&D, on the other hand, has been much more stable, with no evidence of sigma-convergence. In other words, the gaps between regions have not closed in public funding, while business investment has been able to shift more dynamically to new places.
The study highlights that public R&D funding often acts as an anti-regional policy. By flowing disproportionately to strong regions with existing resources, it reinforces spatial inequality rather than reducing it. Business R&D has adapted and spread to new areas, but public R&D remains sticky, anchored in established institutions and human capital hubs. That makes regional disparities in innovation harder to close, even as governments claim to prioritise balanced growth.
4. Mapping where disasters collide

A new study from Kurdistan Province, Iran, looks at how to improve satellite-based mapping of natural hazards. The authors focus on four risks: floods, wildfires, landslides, and land subsidence; using Sentinel-1 and Sentinel-2 imagery from 2015 to 2022. Instead of relying on a standard random forest model, they optimise it with two metaheuristic algorithms: Genetic Algorithm (GA) and Particle Swarm Optimisation (PSO). These methods fine-tune the model’s hyperparameters and substantially boost prediction accuracy.
The results are pretty striking. The RF-GA approach achieved 91.1% accuracy for floods, 83.8% for wildfires, and 99.1% for landslides, while RF-PSO hit 95.9% for land subsidence. Together, these hybrid models outperformed standard random forest methods across the board. The maps show clear spatial patterns too: eastern Kurdistan is more prone to floods and subsidence, while the west faces higher risks from landslides and wildfires. Importantly, the analysis also shows that floods and land subsidence are closely linked, and that wildfires and landslides tend to reinforce each other.
This matters because multi-hazard mapping usually treats risks separately, missing how they overlap and interact. By combining satellite data with optimised machine learning, we can get a much sharper picture of where risks converge and how hazards cascade. In practice, this essentially means better zoning of vulnerable areas, more targeted mitigation, and stronger planning for communities facing several hazards at once.
Geospatial Datasets
1. Global re-forecast dataset
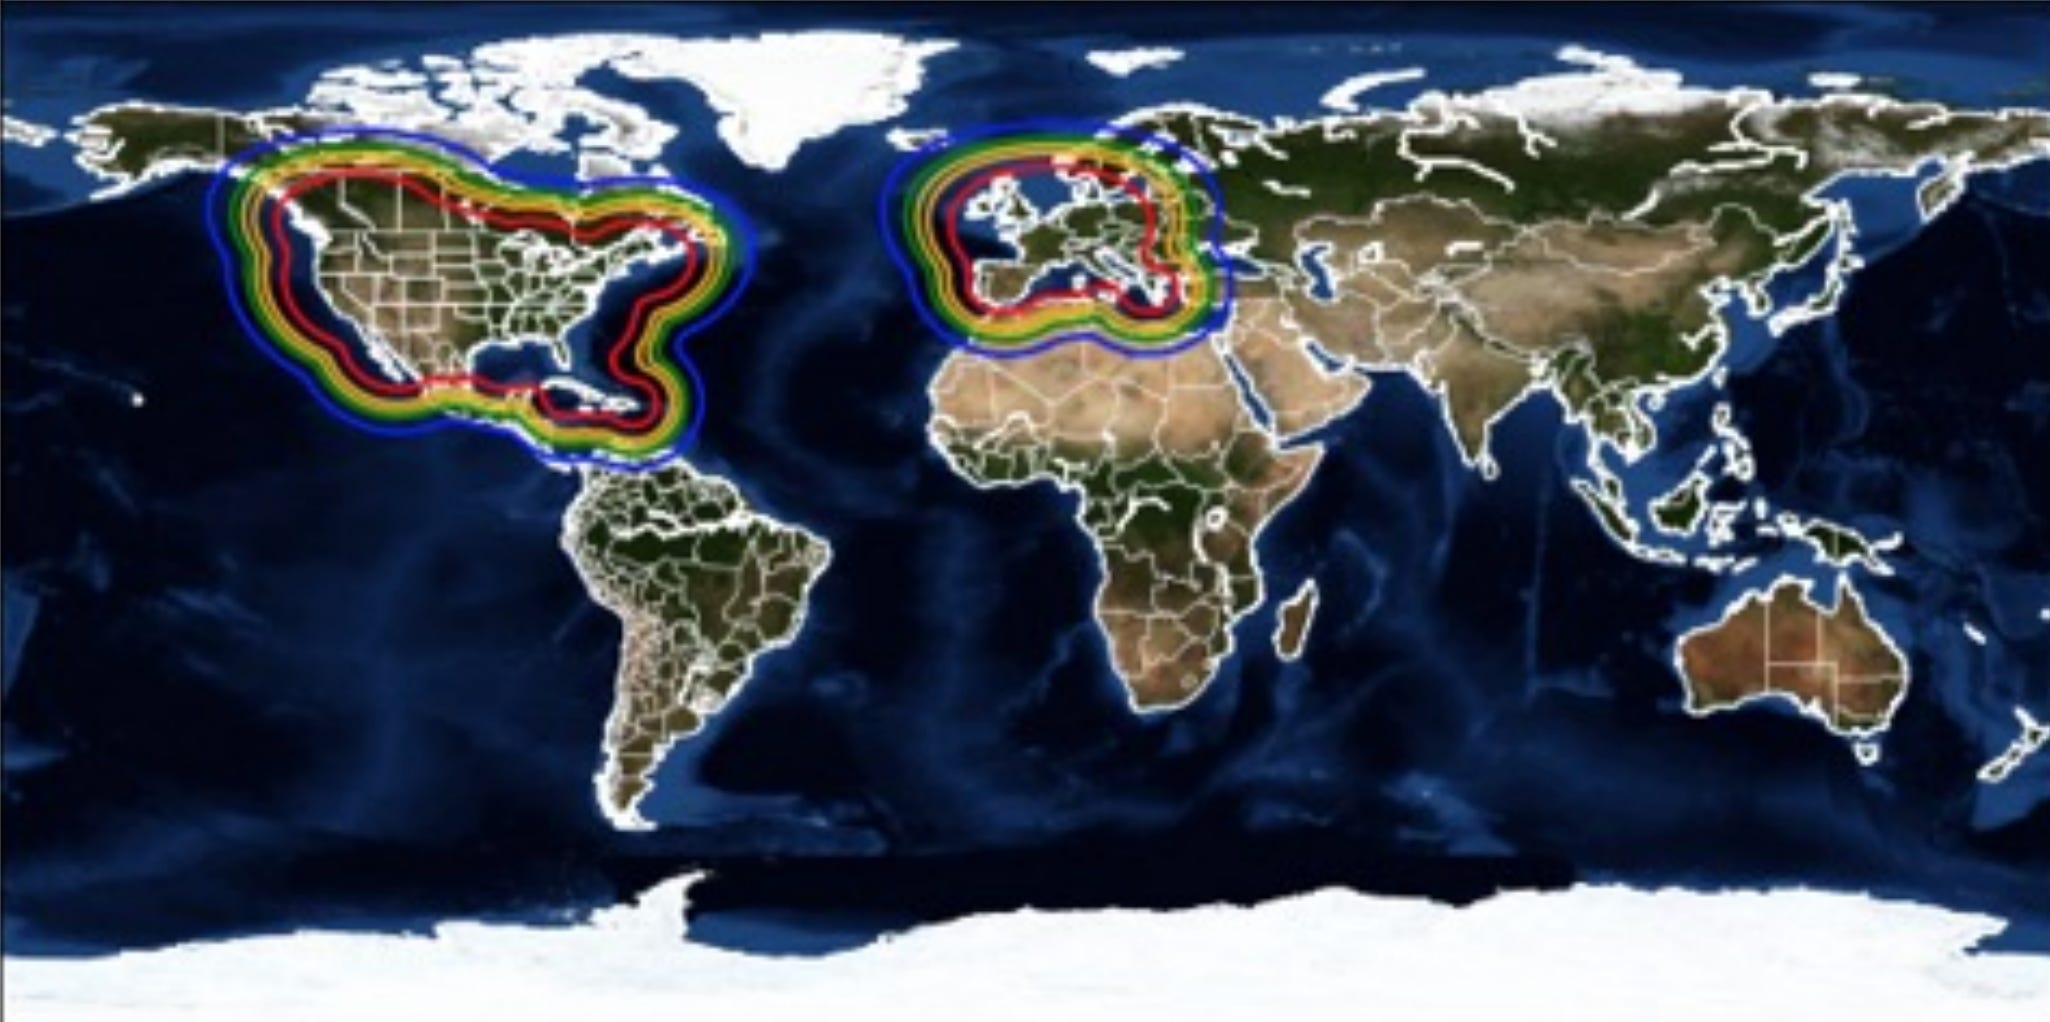
The Weather Company and NVIDIA have released a global reforecast dataset. It includes 1,836 re-forecast cases (2004–2024), sampled around high-impact weather events, with ~4 km resolution over the US, Caribbean, and Europe, and ~15 km elsewhere.
2. Gross Primary Productivity (GPP) dataset

A new 30-m global Gross Primary Productivity (GPP) dataset is now available from Land & Carbon Lab and the Global Pasture Watch consortium. It provides a consistent bi-monthly record from 2000–2024.
Other useful bits
Satellite imagery reveals a sharp rise in illegal landfills across Bosnia and Herzegovina, with some sites expanding near rivers, cultural heritage areas, and residential zones. Estimates suggest more than 1,000 such dumps exist, often lacking permits and posing serious risks to health and the environment, while official efforts to tackle the issue remain limited.
The Sentinel-6B satellite, a joint NASA–ESA mission, will provide real-time data on sea level, wind, and wave height to improve marine weather forecasts and help ships avoid dangerous conditions. It will also extend a 30-year record of sea level observations, ensuring consistent and reliable data for ocean science and shipping safety.
The World Bank has launched Data360, a new development data portal offering powerful analytics and access to over 10,000 indicators.
Esri has partnered with Hyderabad-based Dhruva Space to integrate its ArcGIS technology with Dhruva’s AstraView service, bringing data from over 200 satellites into practical use. This collab will boost applications from urban planning to disaster management, supporting sustainable growth and data-driven governance in India.
Jobs
FAO is looking for a GIS Impact Assessment Specialist based in Rome.
The United Nations Development Programme is looking for a GIS & Remote Sensing Support Volunteer based in Armenia
The World Bank is looking for a Technology Manager based in Sofia, Bulgaria
Humanitarian OpenStreetMap is looking for a remote Product Marketing Manager
Just for Fun

A string of recent issues shows how map errors can cause confusion, inconvenience, and even risk. From Great North Run medals featuring the wrong city to a phantom Aldi in Wales and a FIFA map omitting Crimea, these highlight the real-world impact of cartographic slip-ups.
That’s it for this week.
I’m always keen to hear from you, so please let me know if you have:
new geospatial datasets
newly published papers
geospatial job opportunities
and I’ll do my best to showcase them here.
Yohan