

🌐 Some surprising insights about air pollution (involving blockchain)
PLUS: mapping walkability in Europe, the unpredictability of rivers, and more.

Hey guys, here’s this week’s edition of the Spatial Edge — your weekly map to the latest geospatial news. We buffer out the noise, snap to the most interesting features, and provide geospatial puns that are so bad even ChatGPT couldn’t come up with them. In any case, the aim is to make you a better geospatial data scientist in less than five minutes a week.
In today’s newsletter:
Air Pollution: Isotopes are being used to track sources of pollution
Walkability Maps: Europe scored at 100 m resolution
River Mobility: Landsat reveals unpredictable channel shifts
Ocean SAR: New foundation model for maritime forecasting
Research you should know about
1. Some surprising insights about air pollution

There’s a lot of talk about “big data” in air-quality research, but most of it still relies on modelled inventories. A new paper in Nature Communications shows what true observational big data can look like and how it changes the narrative.
Their uncomfortable conclusion is that cleaner cars and fewer coal plants will not, on their own, deliver healthy air by mid-century. Unless governments also tackle field burning, wildfire fuel loads and even dust-storm management, PM2.5 will plateau above safe levels.
To reach these conclusions, the authors built a global database of 34,815 isotopic “fingerprints” drawn from almost seventy years of air-quality samples in sixty-six countries. Every entry is logged on a blockchain so anyone can check its authenticity and see who added what.
Different pollution sources leave slightly different mixes of heavy and light atoms. Coal, petrol and crop fires each have their own signature. So by looking at isotopes, the team was able to work backwards to the original emitters. Until now, though, isotopic data were patchy, local and short-lived, which made global analyses impossible.
Key findings:
Sources keep shifting:
The dominant contributors to PM2.5 are not fixed. For instance, elemental carbon in the 2000s was mainly from crop burning but swung towards fossil fuels after 2014. Organic carbon showed the opposite pattern.
Biomass burning is rising
Wildfires, farm-residue burning and wood stoves now claim a larger share of PM2.5 everywhere, even where totals are falling.
Traffic rules worked, briefly
Crackdowns cut exhaust-linked ammonium and nitrate, but other emitters filled the gap. I guess this shows why single-sector strategies have diminishing returns.
Climate policy alone won’t hit WHO limits
Even with 1.5 °C warming, PM2.5 would sit near 5 µg m⁻³ in the Americas and 14 µg m⁻³ in Asia by 2100. Natural sources, especially fires and dust, essentially become the main obstacle.
Anyway, it’s a pretty interesting study, and the open IDGAR database could be useful for anyone modelling air quality.
2. Mapping walkability across Europe, 100 m at a time
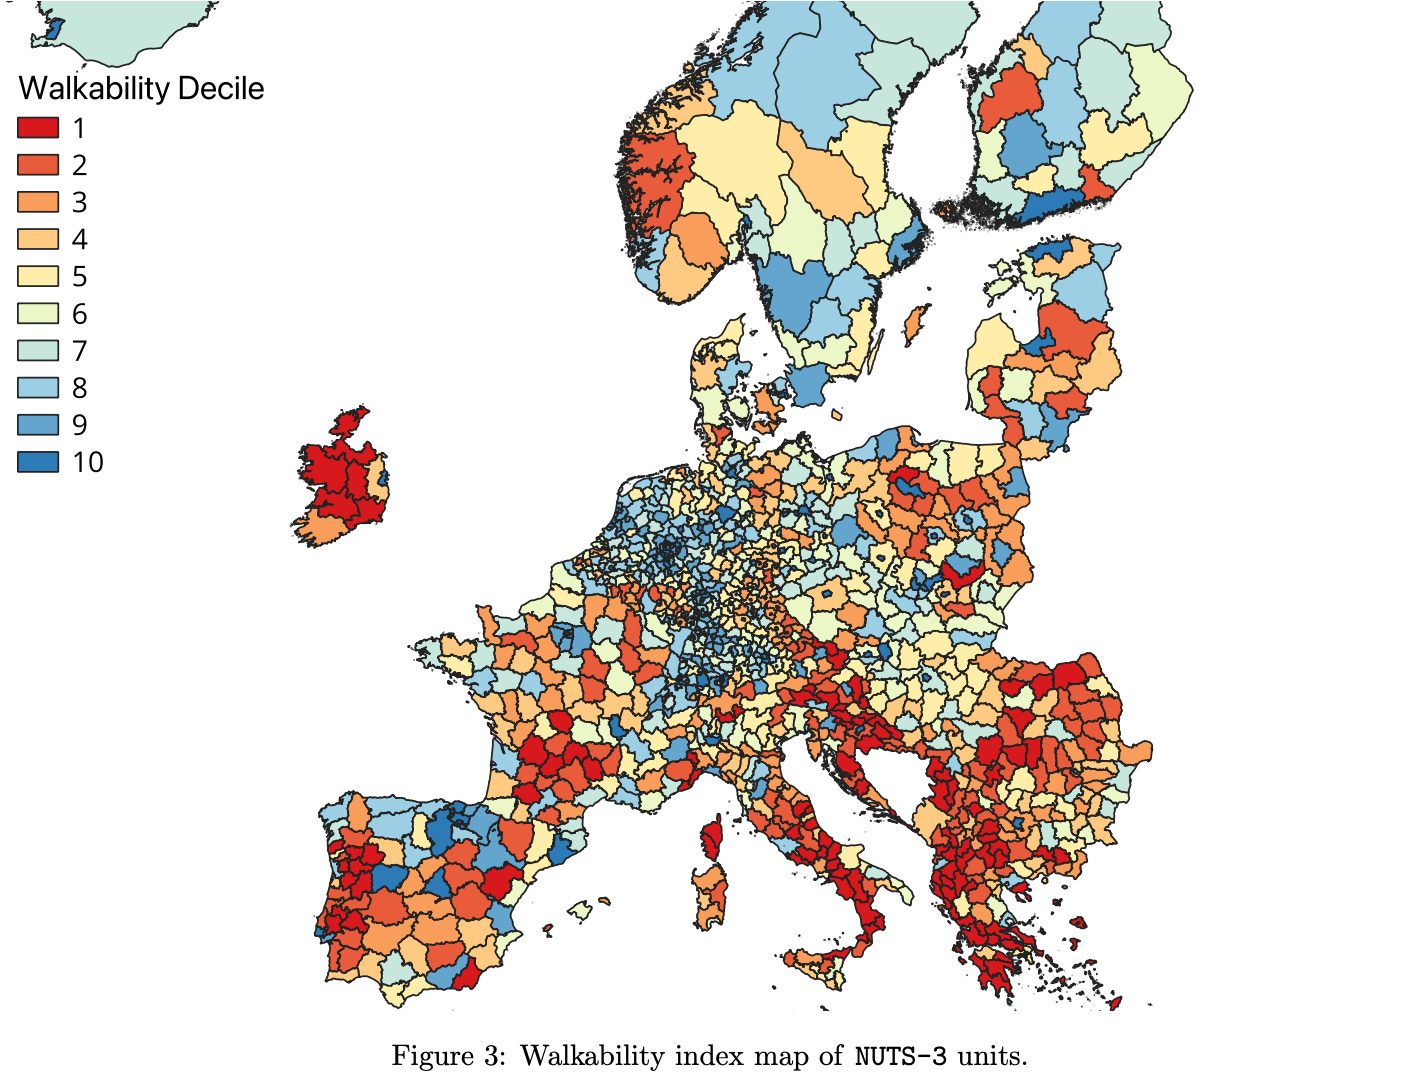
If you’re a European who likes walking, then you’re in for a treat with this one. Or, if you just like researching walking patterns, then you’ll appreciate this too.
A new study has built what might be the most detailed walkability map of Europe so far. The authors broke the continent into about one billion 100 m × 100 m neighbourhoods, then scored each one with a seven-part index:
Street walk length – total length of pedestrian streets
Street intersections – how many three-way (or more) junctions
Green spaces – NDVI from Sentinel-2 images
Slope – hills can slow you down
Public transport stops – bus, tram, metro, rail
Land-use mix – how varied the surrounding land cover is
15-minute isochrone area – how far you can walk in fifteen minutes
What stands out
Urban centres predictably score highest, but some countries (Austria, Denmark, the Netherlands, Sweden) also do well in rural zones.
Good walking conditions don’t seem to be spread evenly. Spain, Hungary, Italy and Romania show a two-decile gap between dense urban clusters and their city cores.
The trade-off between greenery and dense street grids was confirmed. Street intersections and street length are tightly linked, which is expected. Green space moves in the opposite direction.
In big cities the link between slope and walkability flips sign: hilly districts sometimes rate higher, perhaps because steep historic cores pack in short, walkable streets.
3. Rivers are far more unpredictable than we assumed

Most textbooks say you can guess how much a river shifts by looking at simple things like how wide the valley is or whether the channel meanders or braids. However, a new study in Nature Communications takes a massive dataset of Landsat imagery (over 30 years’ worth) and shows that rivers in the Philippines are far more dynamic and unpredictable than many existing models assume.
The authors used satellite-derived “locational probabilities” to map how often different parts of a river channel are occupied over time. If a section is consistently in the same place, it’s marked as stable. If it shifts around a lot, it’s unstable. They analysed this across 600 km² of rivers in ten Philippine catchments.
There’s no clear pattern in river movements
Even rivers that look similar on the surface can behave very differently underneath. Two sections with the same width can show wildly different levels of mobility. And some rivers that seem stable overall still have small pockets of major change.
What’s driving this river movement?
This river movement seems to depend on a complex mix of local geology, hydrology, and sediment dynamics, and none of these behaved consistently across space.
My take:
There’s a growing push to make geomorphology predictive with big data. This study is a bit of a reality check: even with three decades of imagery and cloud computing, rivers keep plenty of secrets.
You can access the data and code here.
Geospatial Datasets
1. Ocean SAR foundation model

OceanSAR‑1 is the first SAR foundation model focused on the oceans, trained on the full Sentinel‑1 wave mode archive. It’s being used for stuff like weather forecasting at the moment. You can access the model here.
2. Satellite-derived shoreline data

The U.S. Geological Survey (USGS) has released the CoastSeg Shoreline Dataset, which has satellite-derived shoreline positions for various U.S. locations from 1984 to 2023.
3. Globally synthetic tropical cyclone tracks

This dataset provides 12,000 years’ worth of globally synthetic tropical cyclone tracks, generated using the STORM model and tailored to El Niño, La Niña, and neutral phases between 1980 and 2021. You can access the data here and the code here.
Other useful bits

The ArcGIS Earth 2.4 release update brings smoother 3D performance, new support for Web Feature Services (WFS), and better navigation tools. Users can now open and visualise WFS layers directly, explore underground features with a new “clip the terrain” function, and enjoy improved drawing, measurement, and timeline tools for temporal data.
After 15+ years, the Polar Geospatial Center has wrapped up its final annual update of the ArcticDEM and REMA strip datasets, adding 124,000 new elevation strips for the poles. That brings the total to over 1 million! PGC is now looking for new partners to help keep this vital climate and planning data flowing.
A new study led by Plymouth Marine Lab has standardised how we calibrate optical sensors for ocean colour validation. Using the open-source HyperCP tool, the team cut variation across sensors to just 2%. This makes it easier for researchers worldwide to get reliable climate and water quality data.
ESA's Biomass satellite launched on 29 April aboard a Vega-C rocket from French Guiana. Equipped with a pioneering P-band radar, it will map global forest biomass over five years, which will be pretty important for assessing carbon storage and climate change.
Jobs
My team at ADB is looking for a data scientist based in Manila.
UNOPS is looking for a remote GIS/IT expert.
ESA is looking for a Geospatial System Engineer based in Frascati.
The Allen Institute for AI is looking for a Lead Machine Learning Engineer based in Seattle.
Mapbox is looking for a VP of Product based in the US.
Just for Fun

Wonder what a mountain would look like on another planet? Check out this visualisation of a 4 mile (6.44km) tall mountain on Jupiter's moon.
That’s it for this week.
I’m always keen to hear from you, so please let me know if you have:
new geospatial datasets
newly published papers
geospatial job opportunities
and I’ll do my best to showcase them here.
Yohan