


Hey guys, here’s this week’s edition of the Spatial Edge — a place where you aren’t judged for being a little sinusoidal... Anyway, the aim as usual is to make you a better geospatial data scientist in less than five minutes a week.
In today’s newsletter:
AI Image Search: ProVG improves satellite object detection.
Farm Boundaries: PRUE maps fields at global scale.
Car Dependency: New index maps urban transport reliance.
Carbon Credits: REDD+ projects show major over-crediting.
Ocean Data: WOD23 compiles centuries of ocean measurements.
Photosynthesis Data: TRAX GPP maps global productivity.
Research you should know about
1. Teaching AI to search satellite images like a human
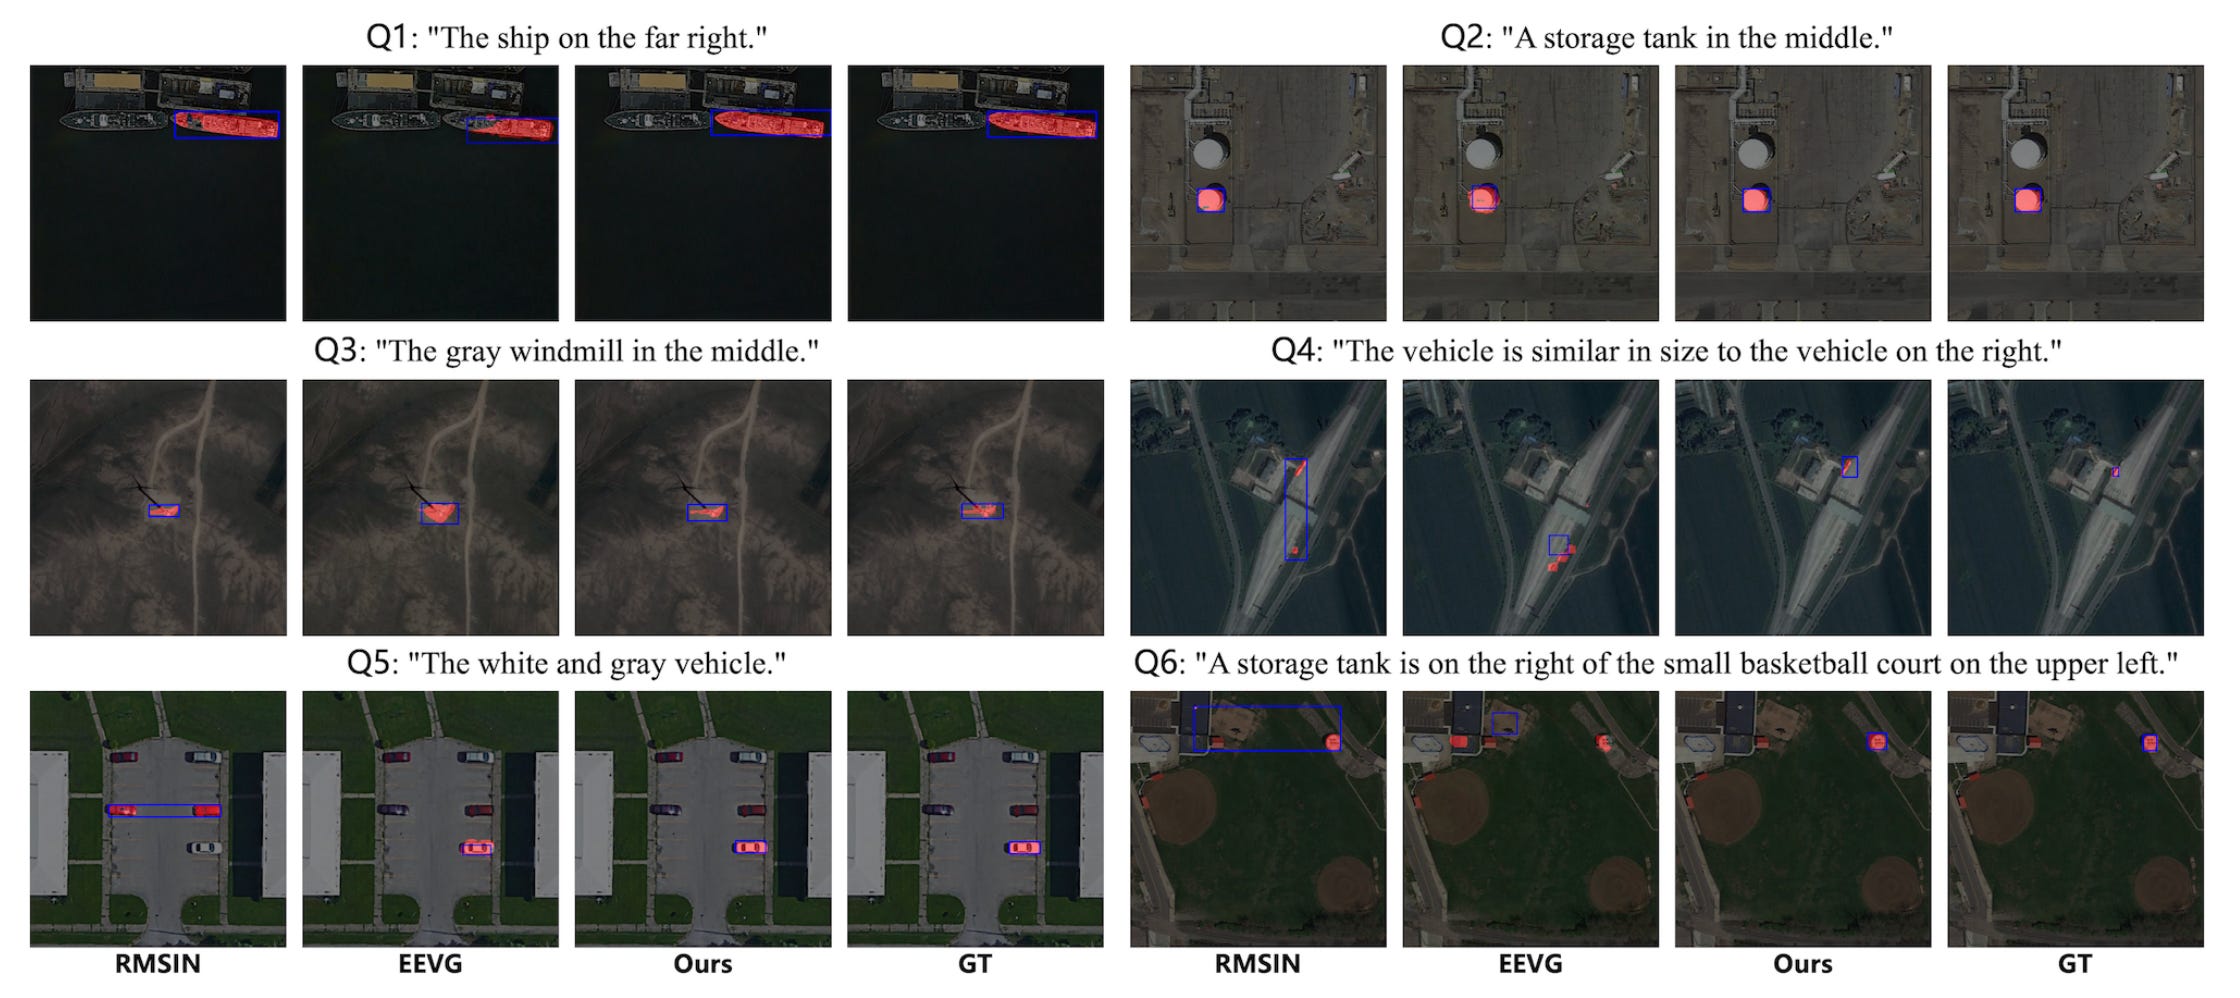
A new study introduces ProVG, an AI framework designed to dramatically improve object detection in satellite imagery based on text descriptions. Spotting a specific target in a remote sensing image can be pretty difficult because the scenes are massive and packed with identical-looking objects. Usually, AI models try to find a target by processing the user’s entire text prompt as a single chunk. It turns out this approach isn’t great. When a model processes a sentence all at once, it doesn’t pick up on fine-grained clues like spatial relationships or specific physical attributes, which often leads to the model highlighting the wrong object entirely.
To fix this, the researchers looked at how human brains actually process visual searches and built a progressive framework that mimics our natural cognition. Instead of swallowing a sentence whole, ProVG breaks the text prompt down into three distinct pieces: (1) global context, (2) spatial relations, and (3) object attributes. The model then applies these clues in a strict sequence to filter the image. First, it surveys the global context to get a general understanding of the scene. Next, it uses spatial clues to narrow down the search to a specific neighbourhood. Finally, it verifies the exact target by matching the specific physical attributes.
Alongside this structured searching method, the framework also includes special modules to handle the extreme scale variations found in satellite photos, helping it fuse details from both zoomed-in and zoomed-out perspectives. The researchers tested ProVG against a huge lineup of existing models across two major remote sensing benchmarks. The results were pretty impressive. By simply decoupling the language and forcing the model to search step-by-step, ProVG consistently outperformed current top-tier systems, proving to be incredibly accurate at drawing both basic bounding boxes and precise pixel-level masks around targets.
2. Mapping the world’s farms from space
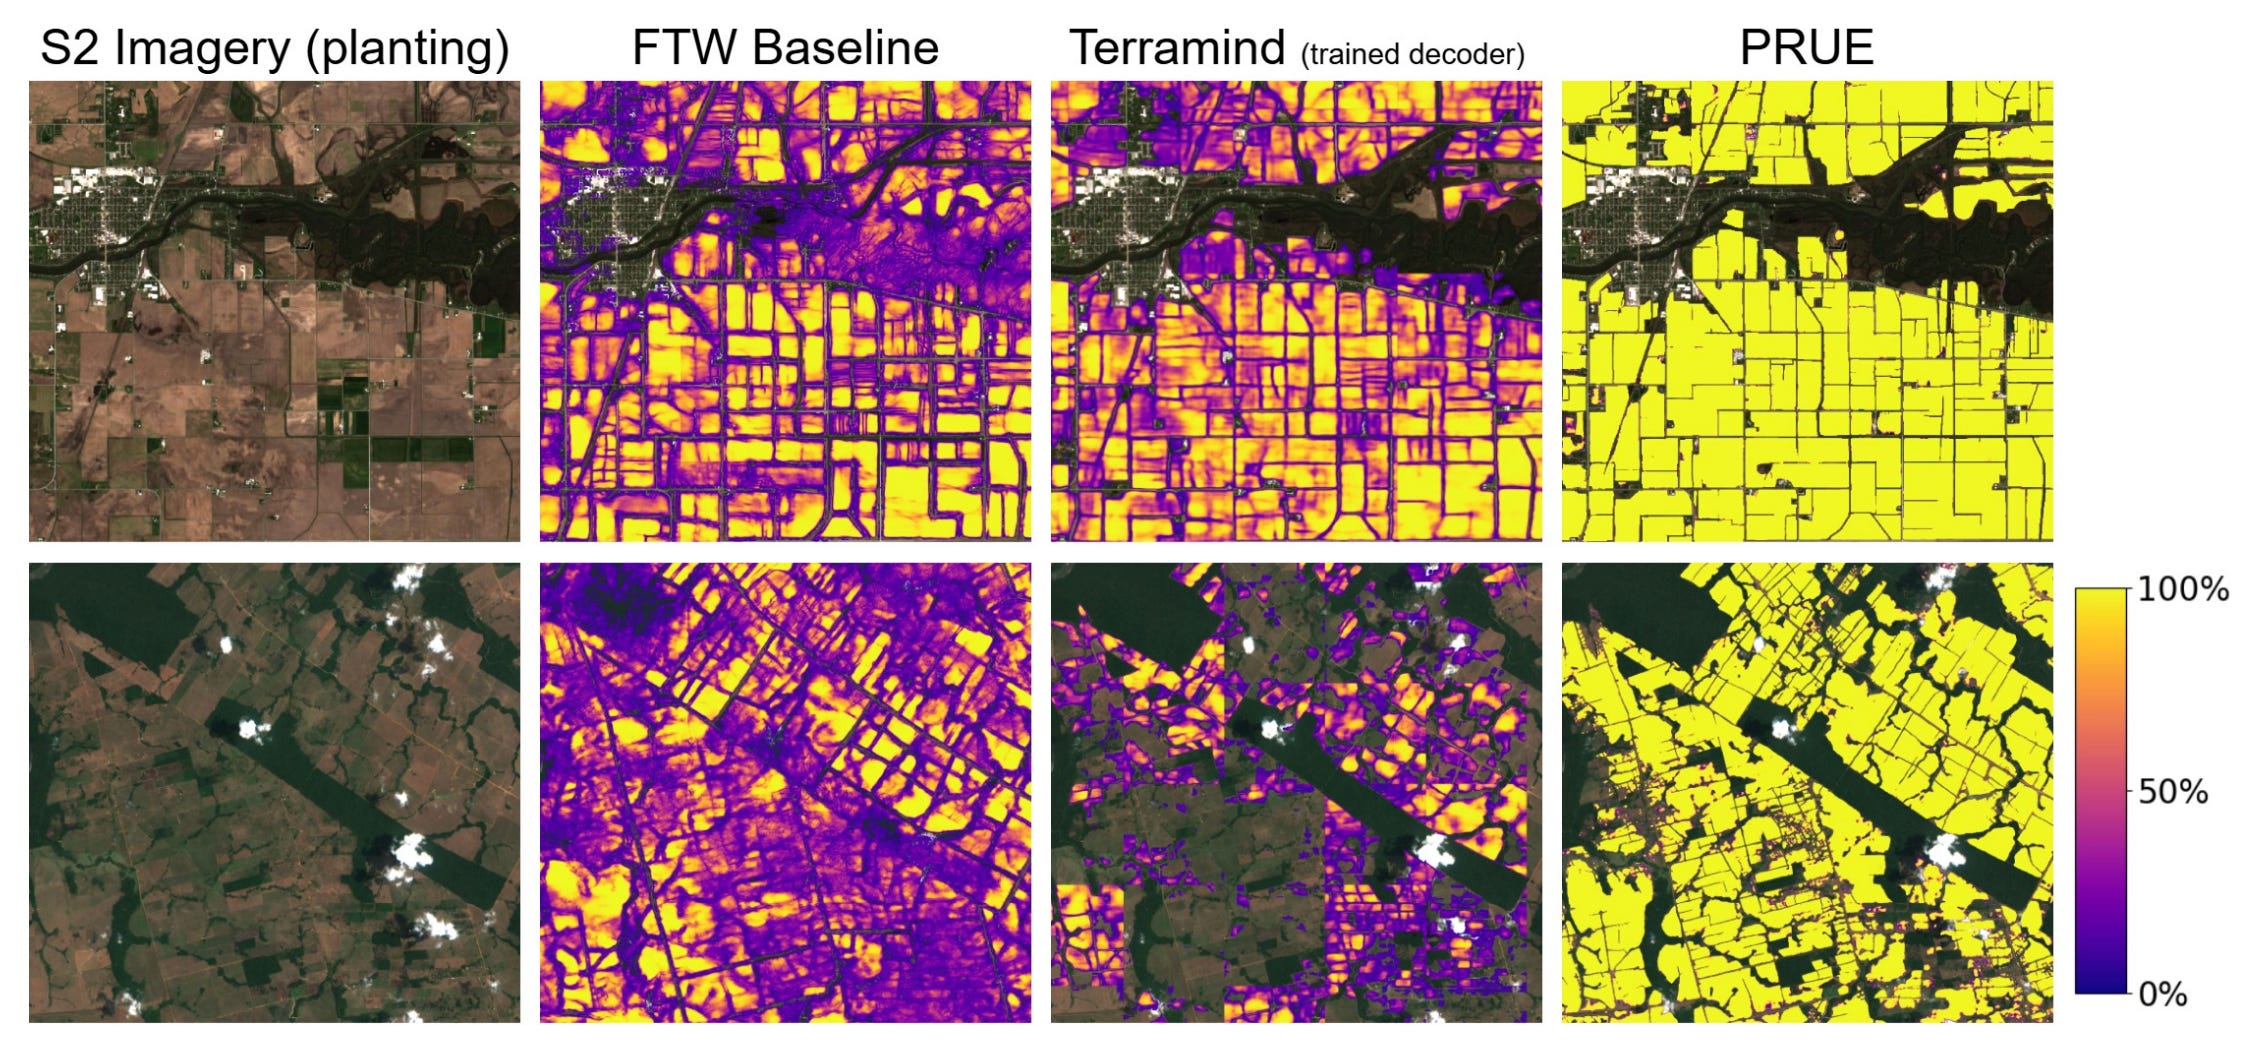
Knowing exactly where farm fields begin and end can be pretty important for tracking crop yields, managing water resources, and monitoring climate initiatives. There are too many approaches to name that uses AI to automatically draw these boundaries by scanning satellite images. However, when these models are taken out of the lab and deployed in the real world, there can be a lot of issues… A model that works perfectly in the sunny plains of Illinois might completely mess up when scanning the cloudy, mountainous terraces of Japan, drawing jittery lines or hallucinating extra fields.
To solve this, researchers built PRUE (Practical Recipe for Field Boundary Segmentation at Scale). They tested 18 different AI architectures against a massive global dataset of fields to see what actually works. This involved introducing new, real-world tests to measure how the AI handled changes in brightness, picture scaling, and the order of the images it was fed. They discovered that while some of the largest, most hyped ‘foundation models’ struggled, a specialized U-Net architecture crushed the competition. By feeding this model mathematically enhanced images and tweaking how it penalises mistakes during training, the researchers created an incredibly robust system.
The results speak for themselves. PRUE scored 6% higher in overall accuracy than previous top-tier models and proved remarkably stable when the lighting or image scale was tweaked. To prove it works at scale, the researchers used PRUE to map out every single agricultural field in Japan, Mexico, Rwanda, South Africa, and Switzerland, covering 4.7 million square kilometres in just a few hours.
3. Decoding car dependency in modern cities
To reach net-zero emissions, urban planners are pushing for car-free zones, better cycling infrastructure, and improved public transport. However, moving away from private vehicles is incredibly difficult because decades of car-centric urban growth have transformed the automobile from a convenience into an absolute necessity. For many residents, giving up their car means losing access to essential services, leisure activities, and jobs. A new study addresses this by quantifying exactly how reliant different neighbourhoods are on private vehicles compared to public transport.
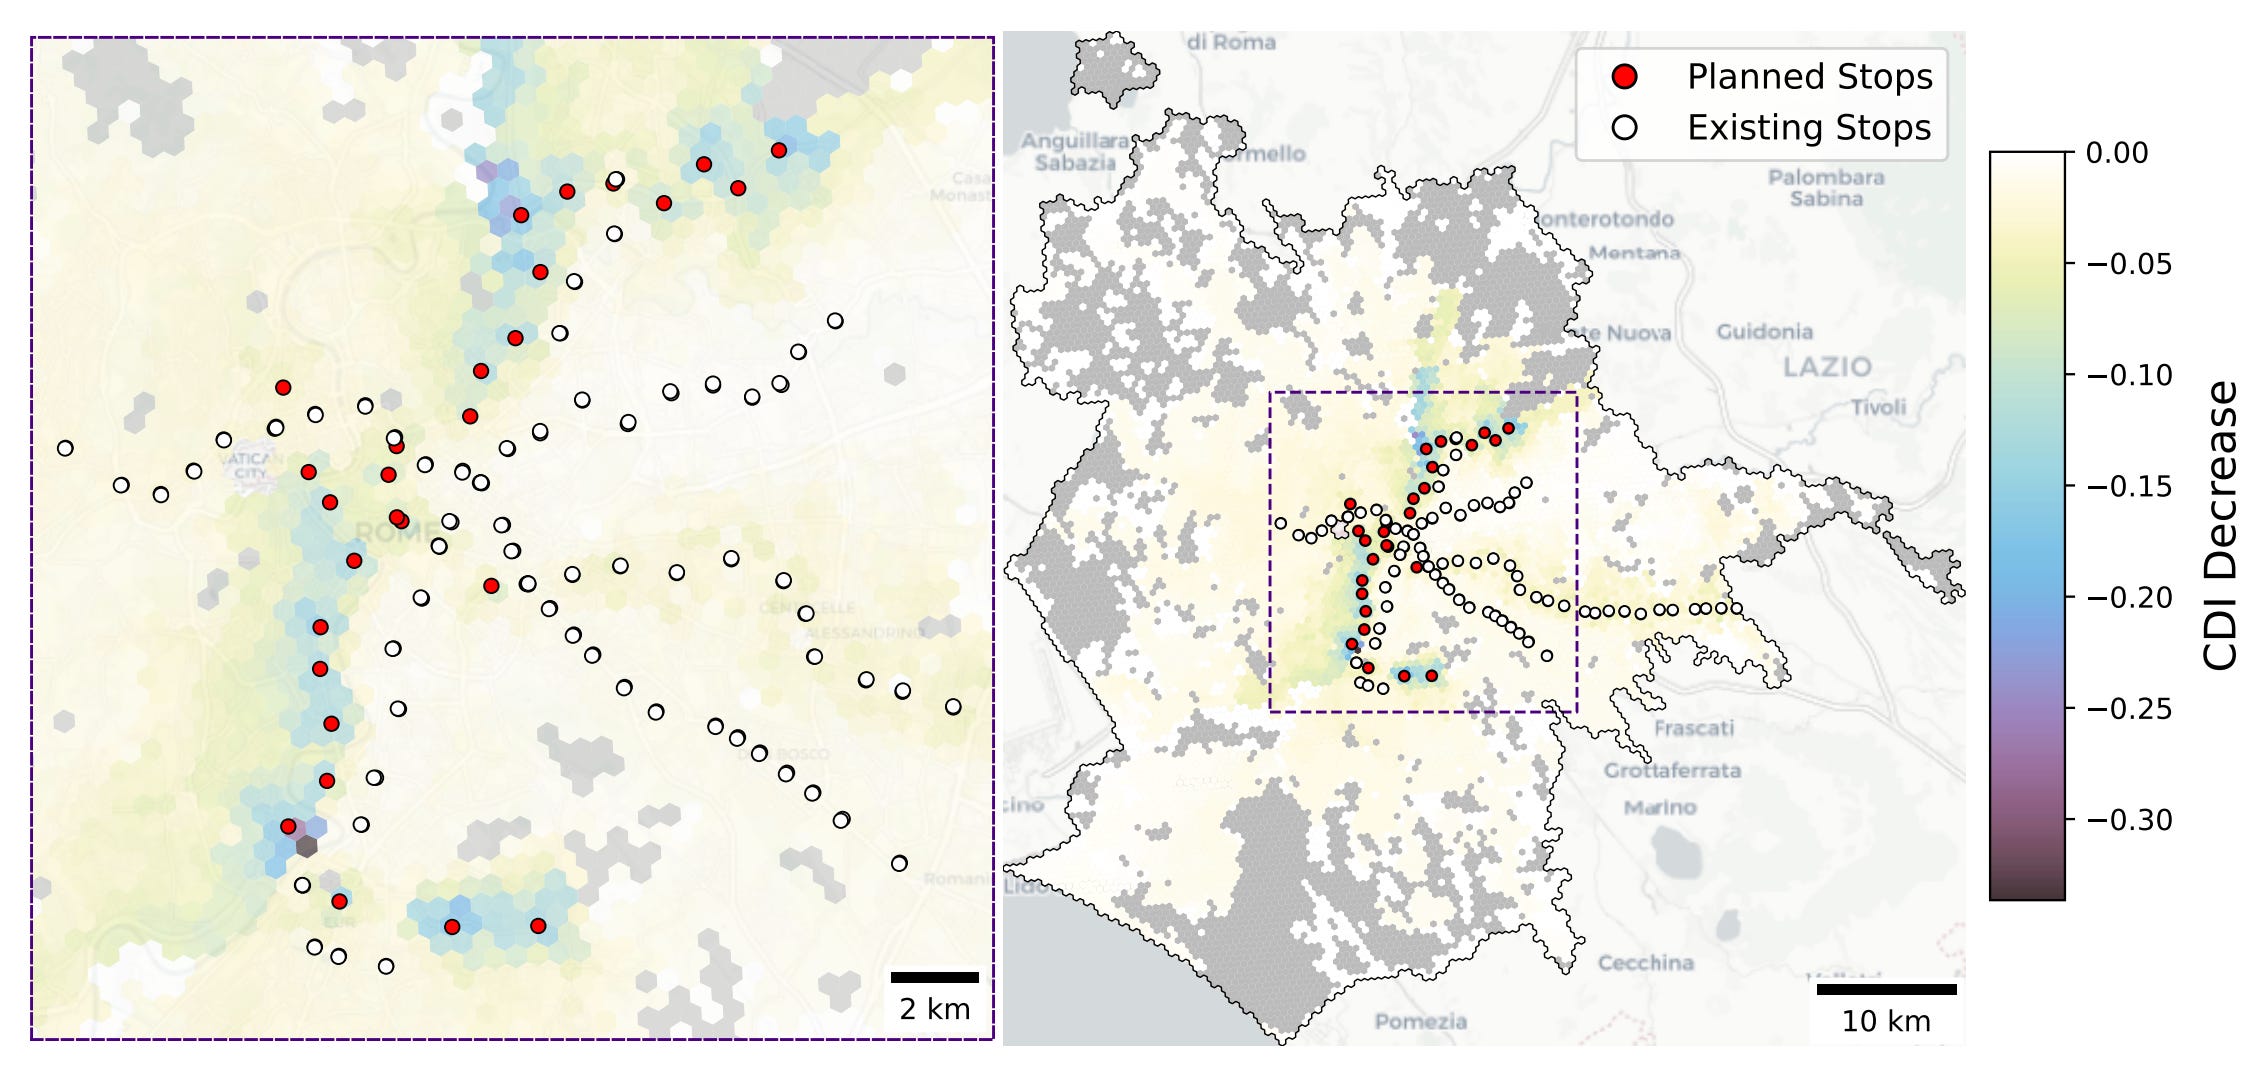
A team of researchers developed the Car Dependency Index to map the accessibility gap between driving and taking public transport across 18 major cities in Europe and North America. By crunching high-resolution geospatial data, they calculated how many points of interest a resident could reach within a normal journey time using either a car or a bus and train network. The data revealed a lot of spatial inequalities, with peripheral districts almost entirely trapped in high-dependency cycles while central areas were far better equipped for car-free living. When looking closely at Vienna, the team also discovered that this neighbourhood dependency was a massive driver of car ownership, completely independent of a household’s income level.
To see if infrastructure upgrades could fix the problem, the researchers simulated the impact of a planned metro expansion in Rome. While the new transit line successfully removed an estimated 60,000 commuting vehicles from the roads, the benefits were extremely localised to the people living right next to the new stations. This proves that building a single new train line is simply not enough to break the cycle of car dependency across an entire city. Ultimately, if policymakers want to dismantle car-based systems and build truly sustainable urban spaces, they need to commit to massive, network-wide public transport expansions rather than isolated projects.
4. The truth behind forest carbon over-crediting
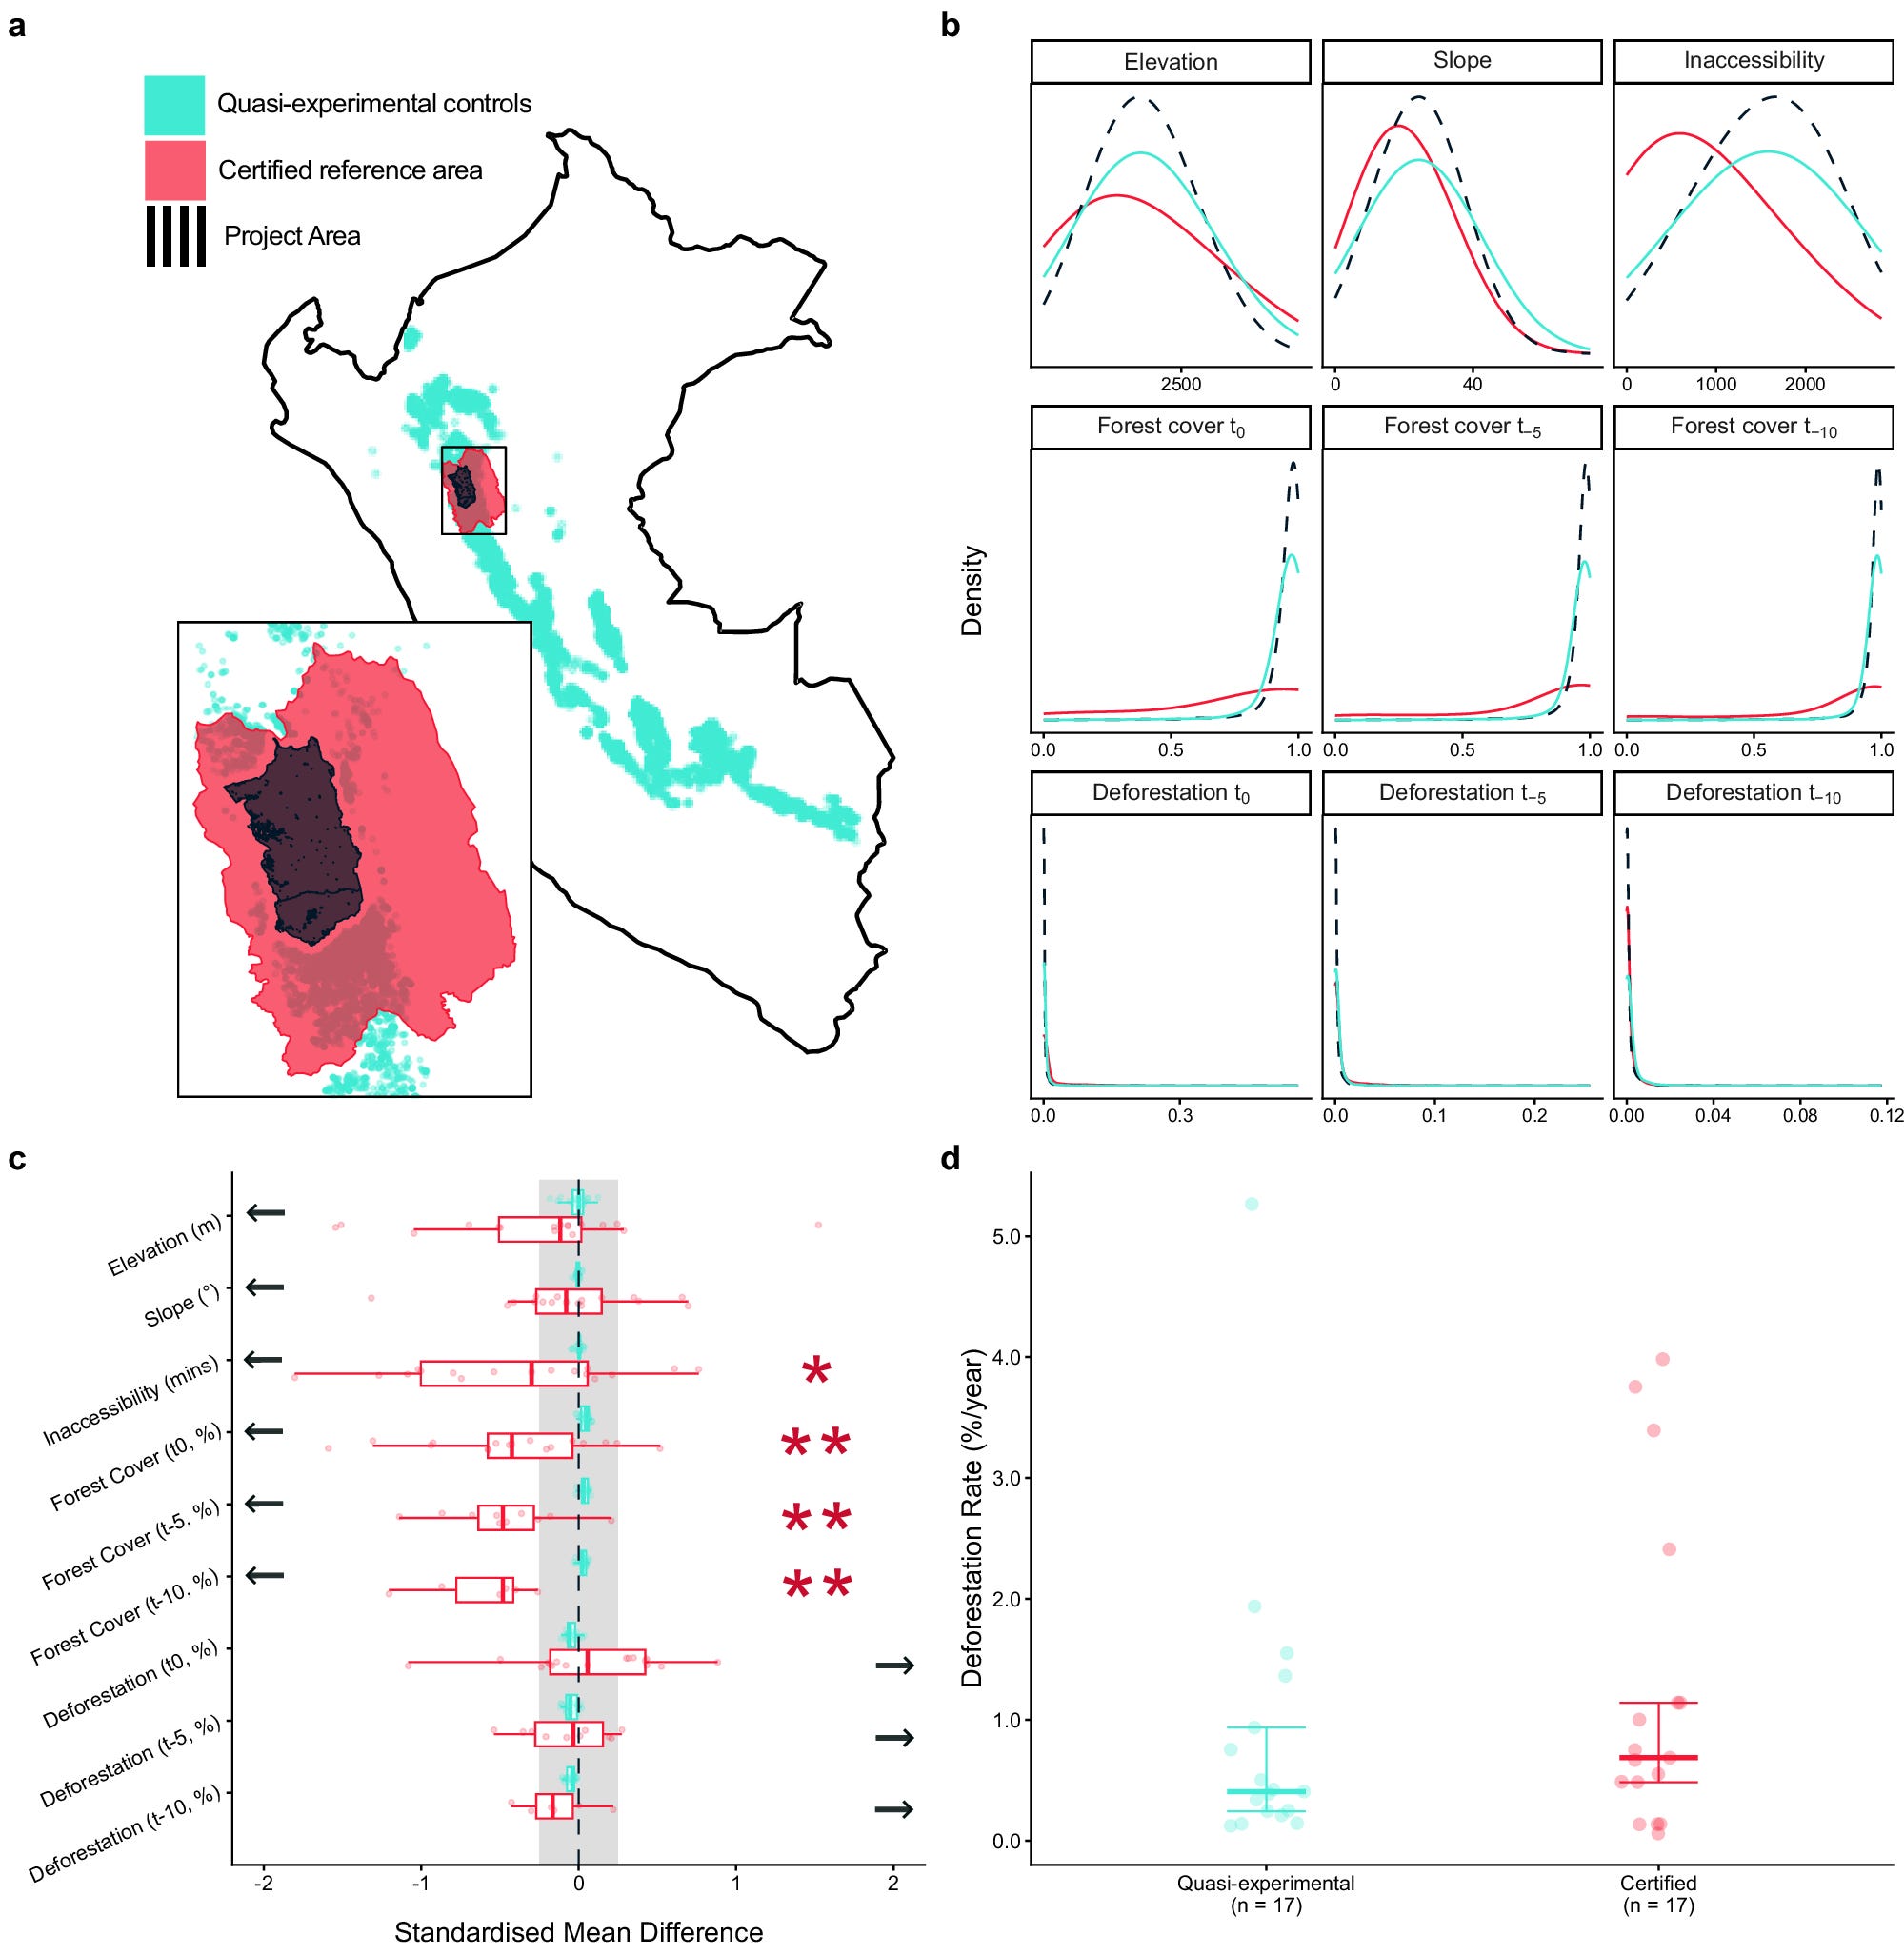
Forest carbon credits, particularly REDD+ projects, are meant to fund tropical forest conservation. However, recent controversies revealed that many early projects issued far more credits than they actually earned, causing voluntary carbon markets to lose over a billion dollars in value. Some industry figures pushed back against these claims, arguing that independent evaluations used flawed global satellite data that simply missed the real deforestation. To settle the debate, a new study from Nature Communications synthesised data from six independent evaluations covering 44 REDD+ projects to see exactly where the discrepancies came from.
The results showed that while most projects did successfully reduce deforestation, they still claimed to have saved nearly 11 times more forest than they actually did. Importantly, the researchers proved that the use of global satellite data was not the problem; these tools actually detected more deforestation than the custom layers used by the projects themselves. Instead, the massive over-crediting stemmed from how projects chose their baseline reference areas. Projects routinely selected highly accessible, heavily degraded comparison zones that were far more vulnerable to logging than the actual protected areas. When combined with overly pessimistic predictive models, this made the projects look vastly more effective than they really were.
To ensure carbon markets genuinely benefit the climate, the researchers argue that the industry must abandon flexible, prediction-based baselines. Future credits must rely on rigorous, after-the-fact evaluations using independent methods to measure real-world impact. You can access the data here and the code here.
Geospatial Datasets
1. World ocean database
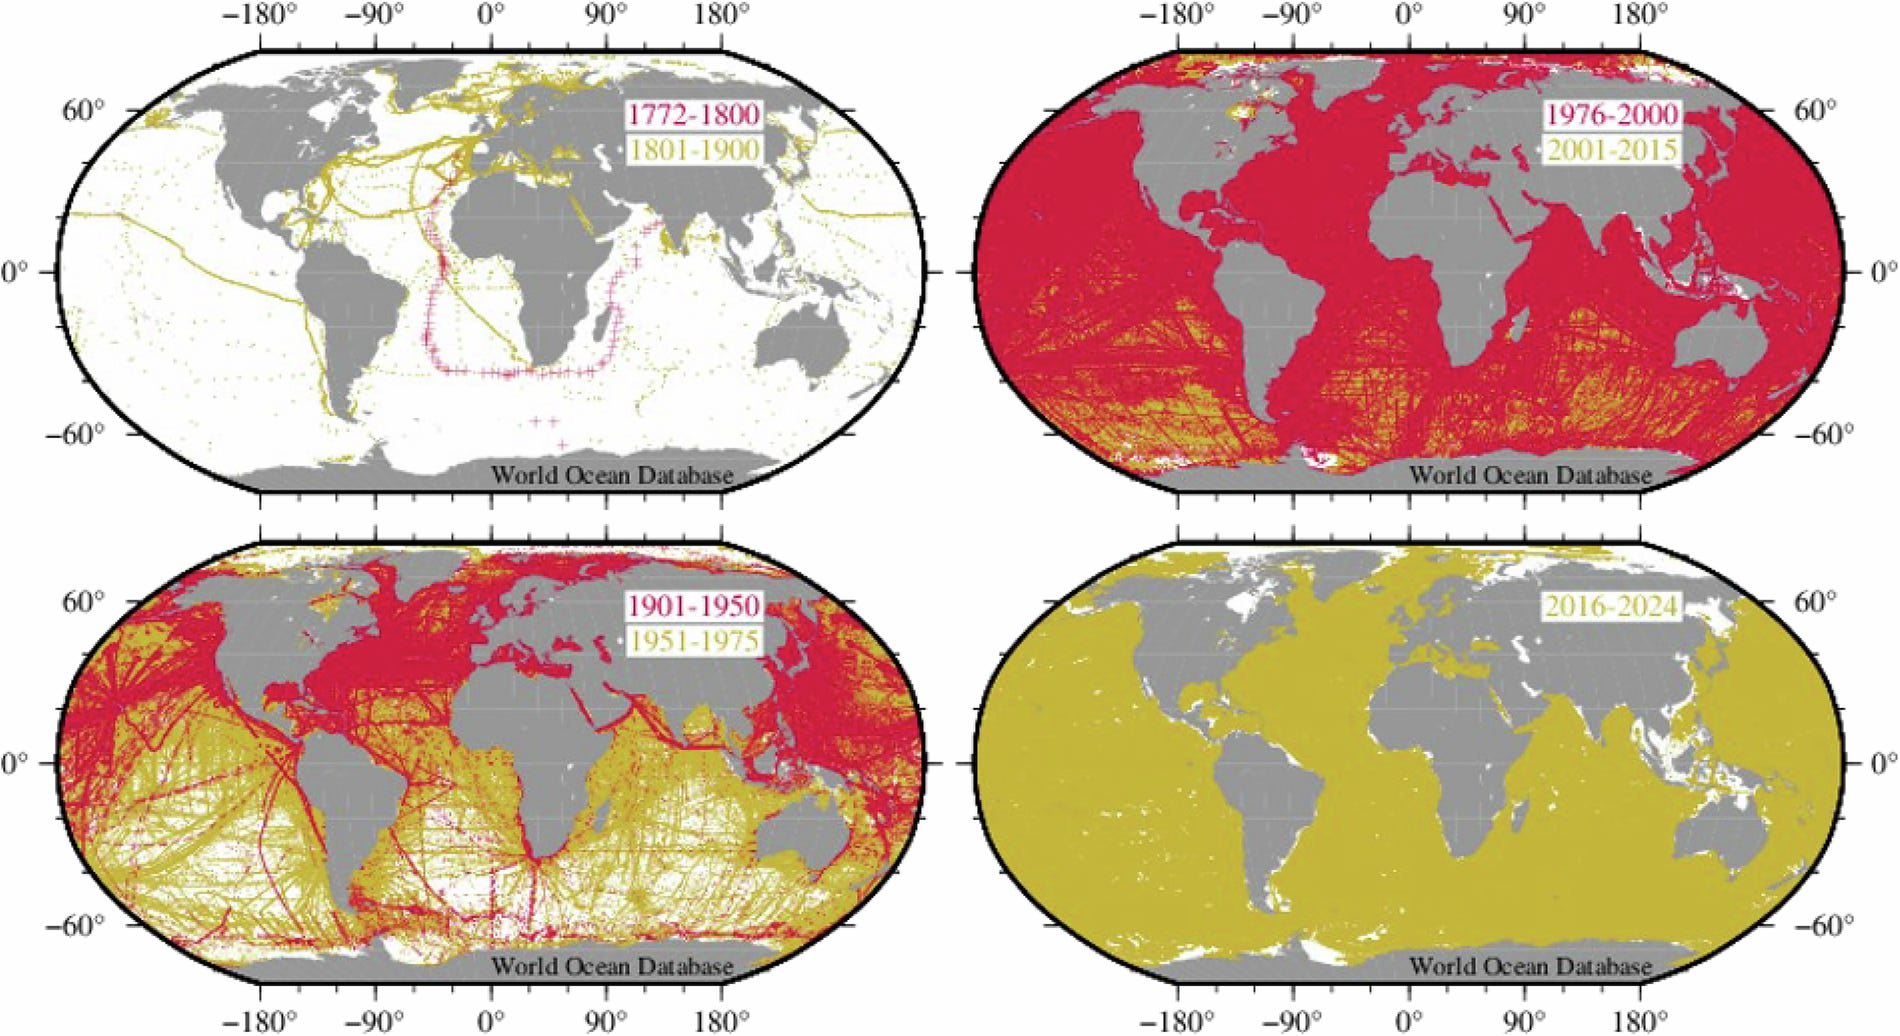
The World Ocean Database 2023 (WOD23) is a large digital collection of oceanographic in situ profile measurements covering the instrumental record from 1772 to 2022, with around 18.6 million water column profiles and 3.6 billion measurements across 27 physical and chemical variables, including temperature, salinity, and oxygen. You can access the data here.
2. High-res global GPP dataset
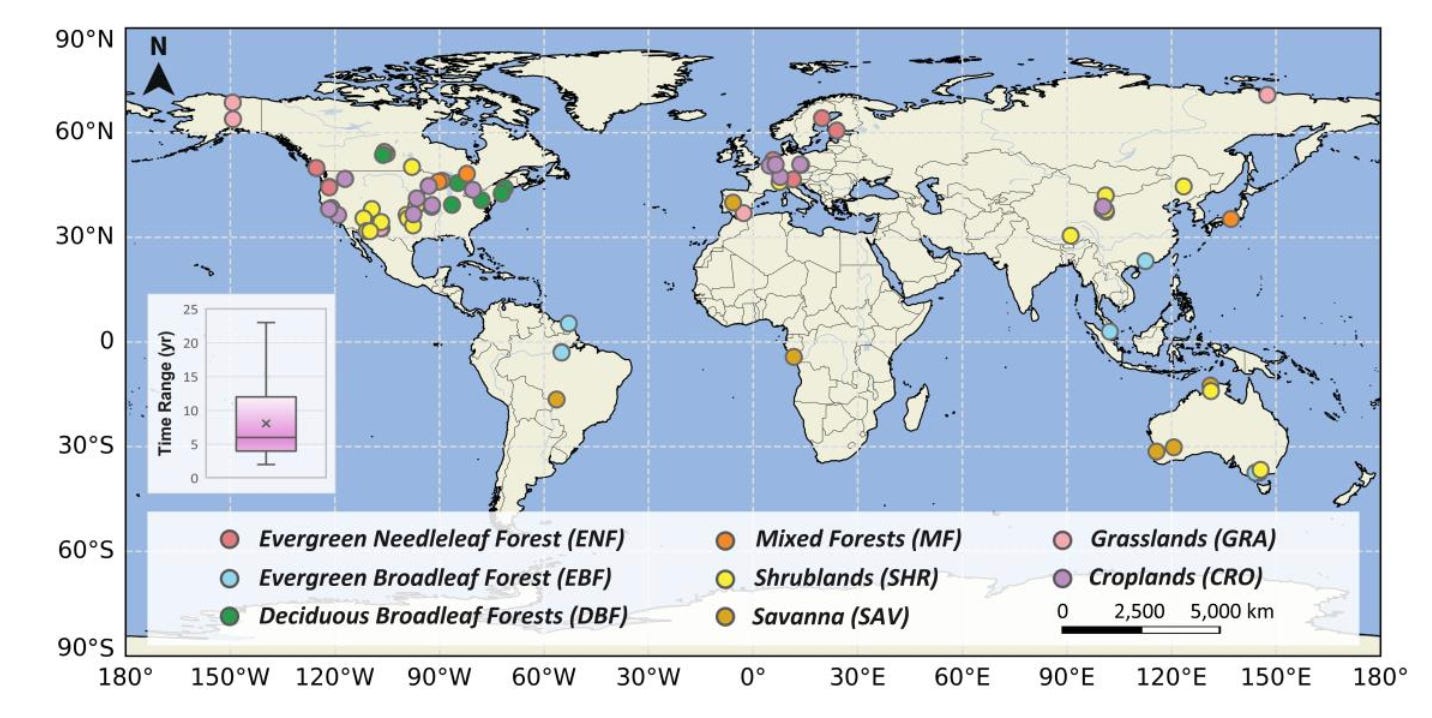
The newly introduced TRAX GPP dataset provides a 0.05° global record of terrestrial photosynthesis from 2001 to 2024, using a hybrid Long Short-Term Memory framework with seasonal-trend decomposition and atmospheric CO₂ assimilation constraints to capture carbon cycle dynamics and CO₂ fertilisation effects. You can access the data here and the code here.
3. Long-term soil analysis dataset
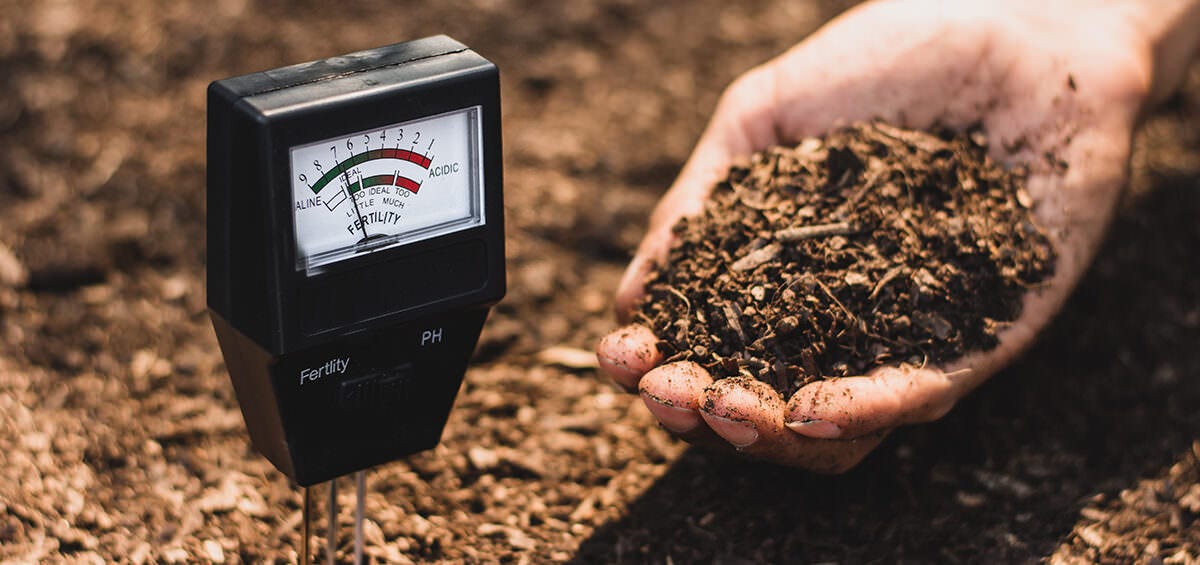
The Sol_Run dataset provides a seventeen-year record of soil analysis data for Réunion Island from 2008 to 2024, with more than 266,000 records from nearly 25,000 unique samples covering physical and chemical properties such as pH, nutrient content, and cation exchange capacity. You can access the data here.
4. High-res Mediterranean wildfire dataset
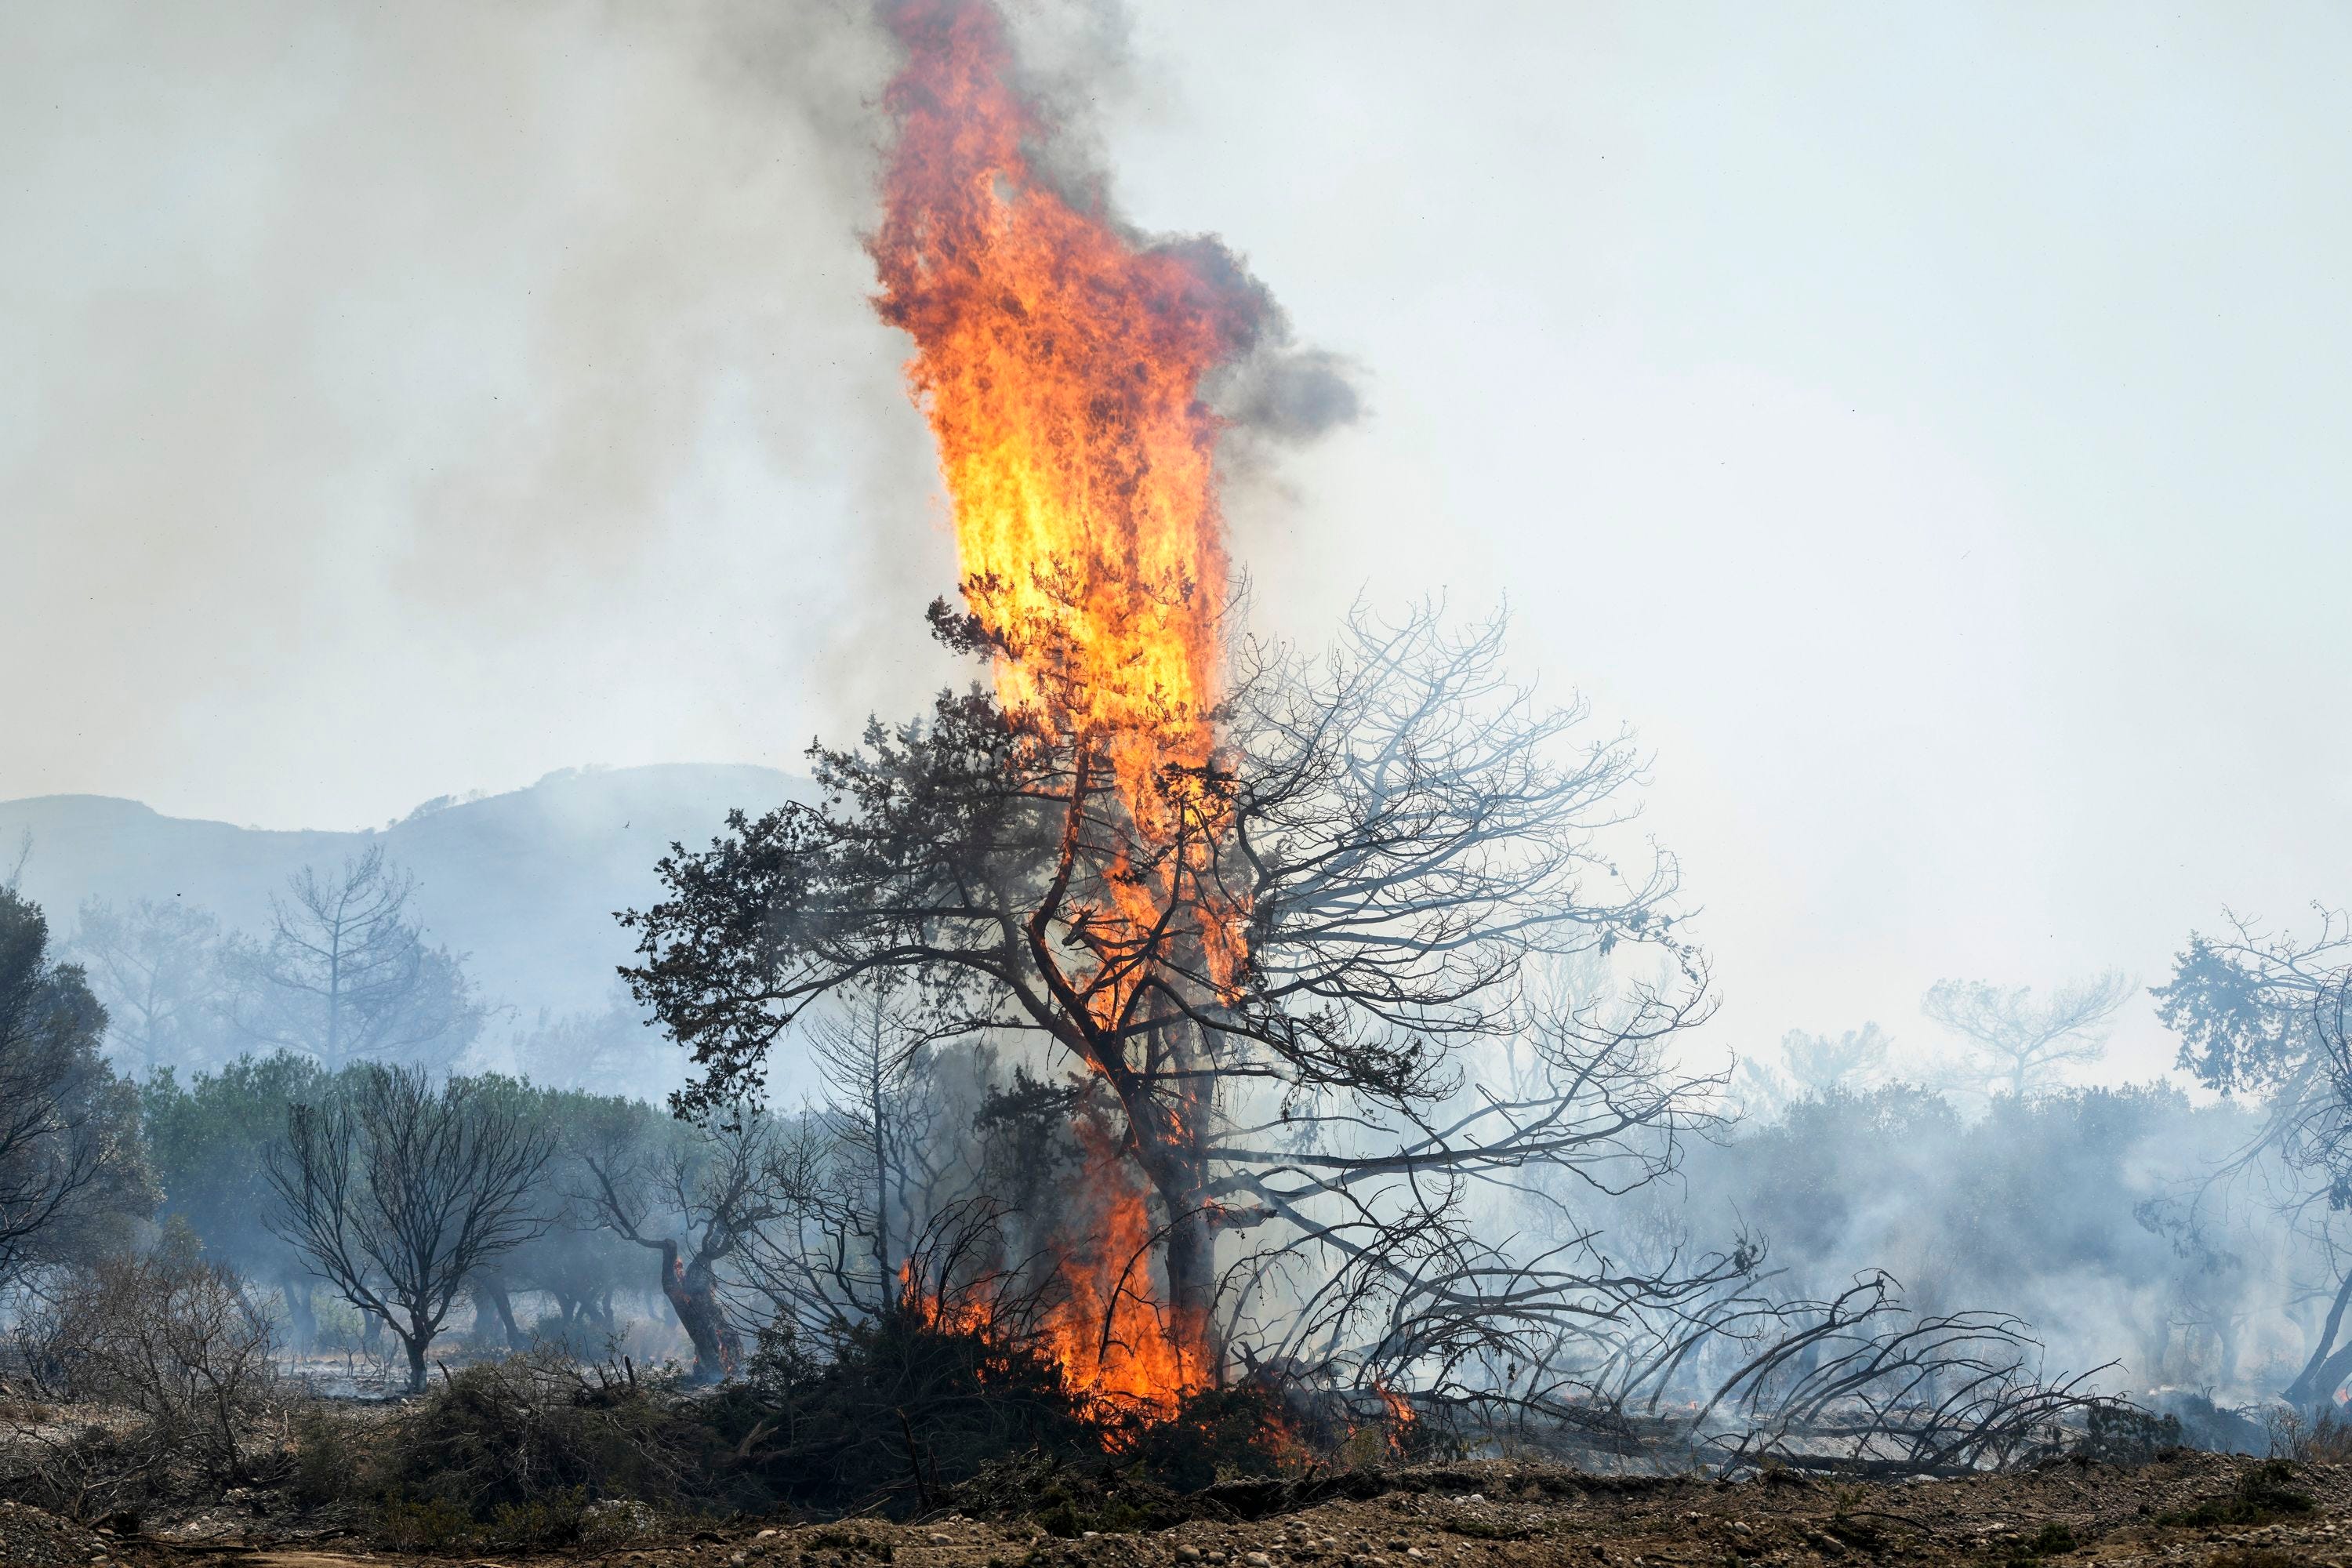
The CalWildFire dataset brings together eleven years of daily in situ wildfire and meteorological data for the Mediterranean region of southern Italy, combining ground-validated meteorological measurements, field-based burned area records, and calculated fire weather indices. You can access the data here.
Other useful bits
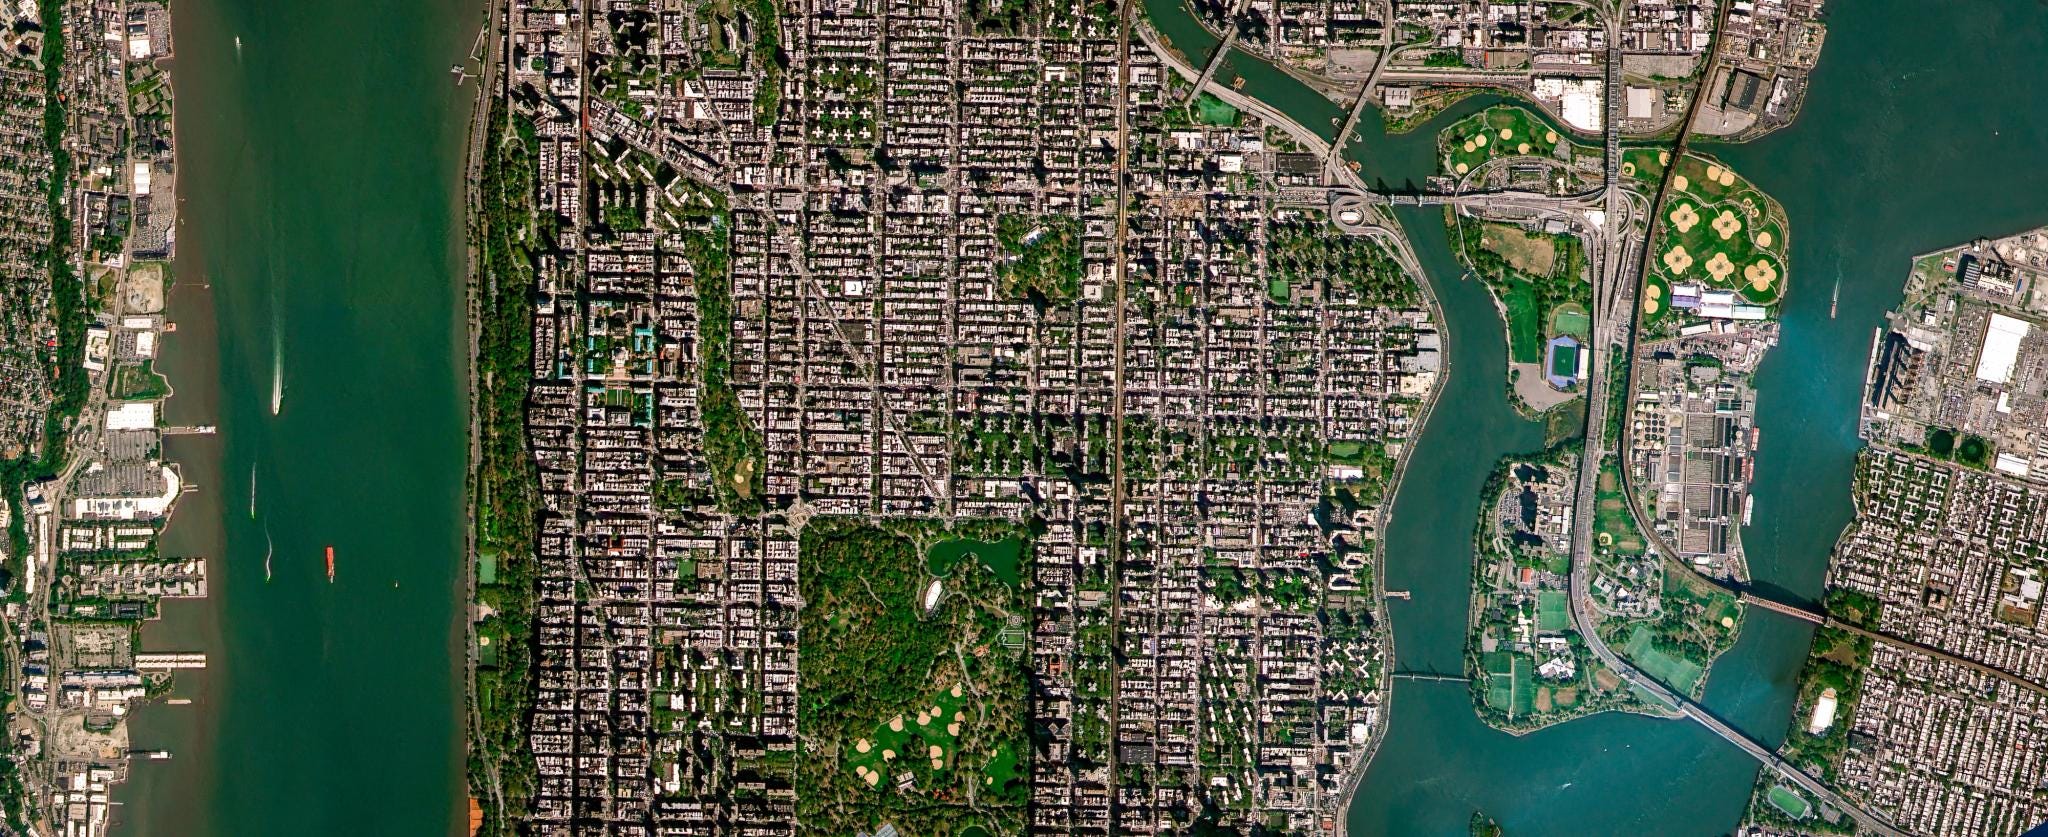
Planet has launched SuperRes technology, a new AI-based super-resolution dataset that sharpens its satellite imagery from 3 metres to 2-metre resolution. The update makes small-scale details, such as rooftop markings and individual trees, easier to inspect while retaining Planet’s daily global monitoring coverage.
Earth Index is officially live offering free global access to its AI-powered satellite search tools. The platform is already being used to identify issues such as illegal deforestation and hazardous quarries through large-scale satellite image search.
Render a House has launched a new 3D mode that allows users to place their own 3D models directly within the Google Earth environment. The update makes it easier to see how proposed projects fit into their real-world surroundings and create more consistent project images.
Jobs
World Vision is looking for a WASH Data Fellow based in the US.
Google is looking for a Technical Program Manager under their Geo team based in Singapore.
UNODC is looking for a Geospatial Information Management Intern based in Vienna.
Esri is looking for a GIS Solution Engineer – Global Alliances & Partners based in San Antonio.
Just for Fun
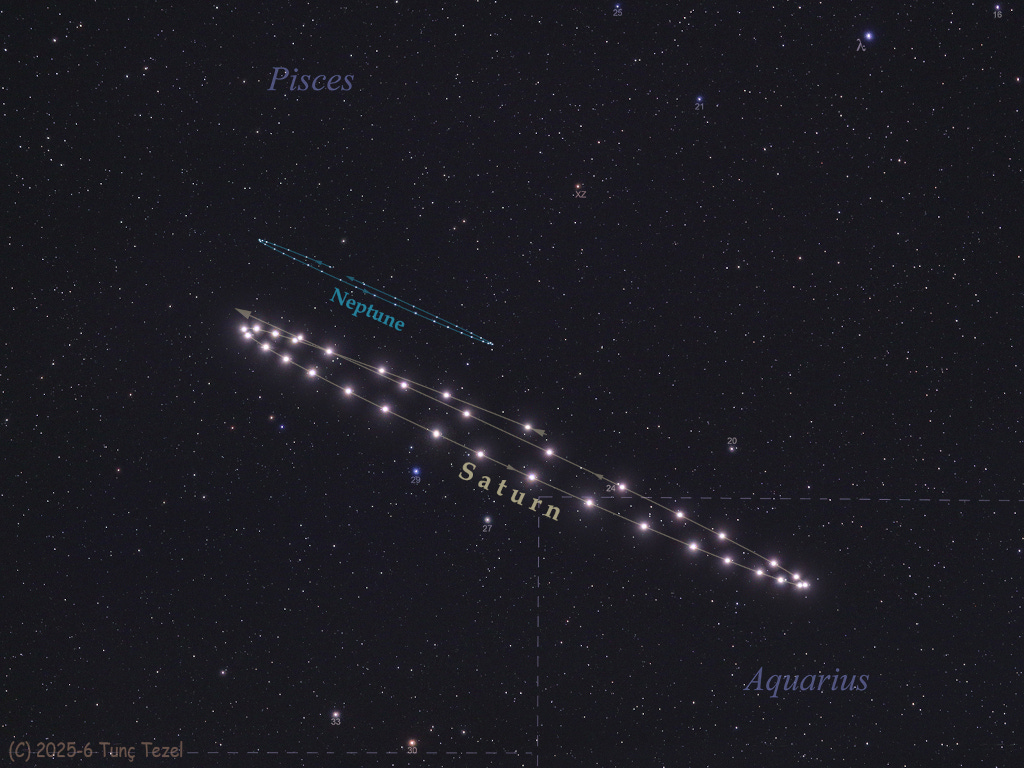
Saturn and Neptune in retrograde, traced across 34 nights from May 2025 to February 2026. This composite shows Saturn as the brighter foreground planet and Neptune as the dimmer object behind it, both appearing to move backwards across the sky as Earth overtook them on its faster inner orbit around the Sun. Saturn moved from Pisces into Aquarius and back again, while Neptune remained in Pisces, during their closest apparent pairing since the Saturn-Neptune conjunction of 1989.
That’s it for this week.
I’m always keen to hear from you, so please let me know if you have:
new geospatial datasets
newly published papers
geospatial job opportunities
and I’ll do my best to showcase them here.
Yohan