


Hey guys, here’s this week’s edition of the Spatial Edge, a place where every raster gets the resolution it deserves. Anyway, the aim as usual is to make you a better geospatial data scientist in less than five minutes a week.
In today’s newsletter:
Poverty Targeting: ML maps find 83% of Sri Lanka’s poorest areas.
Location Embeddings: MIND lets you adjust spatial scale after training.
Warming Acceleration: Regional warming sped up from the 1980s onwards.
Old-growth Forests: Spatial validation shrinks embeddings’ edge over Sentinel.
German Farmland: Annual crop maps from 1990 to 2023.
Research you should know about
1. Testing whether poverty maps find the poorest places
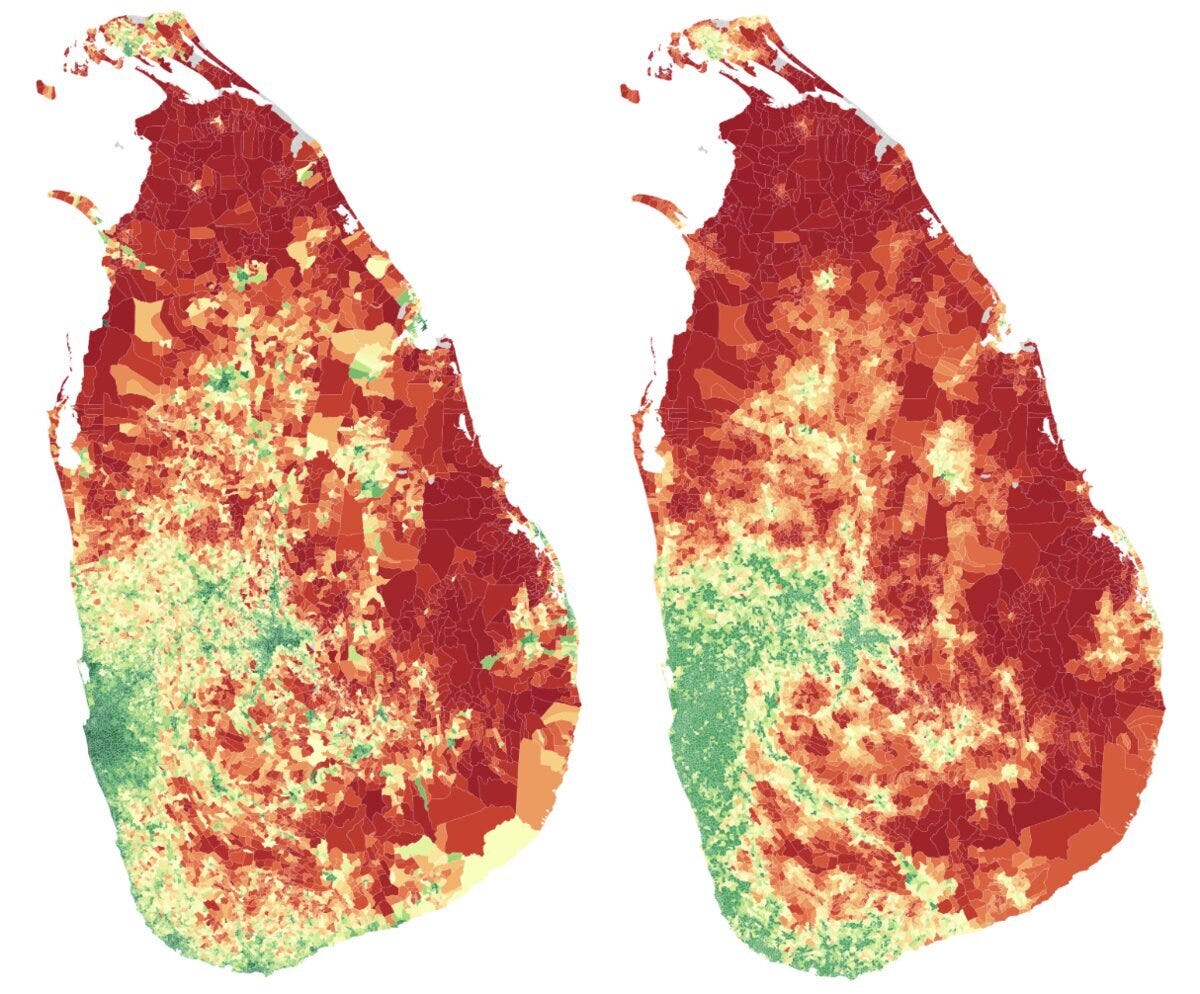
Machine learning poverty maps are usually judged on R², but a new study from LIRNEasia and Carnegie Mellon University tests whether they actually find the poorest places. Governments using these maps to target aid work with a fixed budget, so what counts is whether the areas they pick really are the most deprived. A model can score well on R² and still get that ranking wrong.
They predicted an asset-based poverty index for all 13,985 of Sri Lanka’s smallest administrative units using mobile phone records and satellite data, then scored the models on how many of the poorest units they recovered. Inputs included 11 call-detail-record features (call volumes, mobility, handset type) and 21 remote sensing features like night-time lights, vegetation, accessibility and Landsat embeddings, with the 2012 census as ground truth. The key metric is Recall. This is basically asking the question ‘of the truly poorest areas, what share does the model pick when you can only target the top k%’.
At a 25% targeting budget, random forest and XGBoost models found 83% of the poorest areas, against 45% for a night-time lights baseline. That said, random train-test splits inflated performance (0.870 vs 0.829 with spatially grouped holdouts), and leave-one-province-out recall ranged from 0.944 in Western Province to 0.461 in Northern Province. The census asset index itself only recovered 68% of the consumption-poorest areas, so matching it doesn’t guarantee you reach consumption-poor households. The authors argue for validating against current consumption data, plus community consultation and routes for appeal, before these maps are used to allocate money.
2. A location embedding you can zoom in and out of
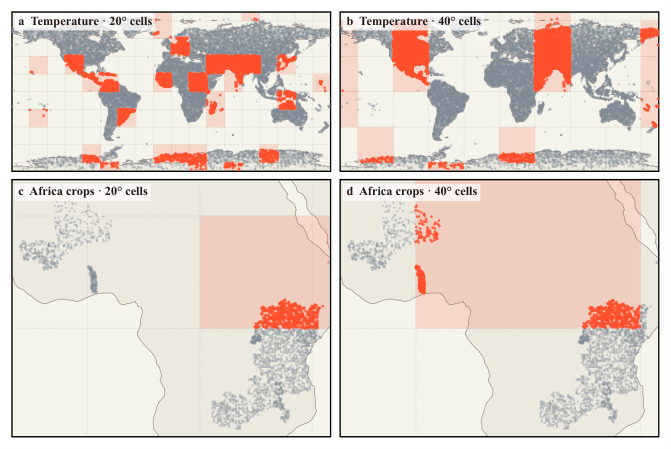
Location embeddings turn any latitude and longitude into a feature vector, but they tend to fall apart far from where they were trained. Geographic measurements are sparse, and standard random splits hide this: in the benchmark used here, 93% of test points sat within 25 km of a training point. A new study led by Taylor Geospatial, with UBC, CU Boulder, UCL, TUM, Arizona State and others, tackles these geographic gaps.
They built MIND, a coordinate model that distils four existing location encoders into one embedding whose spatial detail you can dial up or down after training. A SIREN network maps coordinates to a 3,072-dimensional embedding trained to reconstruct AlphaEarth, Climplicit, GeoCLIP and SINR. It’s supervised in nested chunks (64, 128 and so on up to 3,072 dimensions), so early dimensions capture broad patterns (a characteristic distance of about 790 km) and later ones add finer detail (about 200 km). A “chunked penalty” then down-weights the fine-grained dimensions when you need to extrapolate, with no retraining. They also released CoordBench, 52 datasets with 78 climate, land cover and socioeconomic targets.
MIND does best when predicting far from training data, with an R² of 0.356 on 10° regional holdouts against 0.303 for GeoCLIP. On random folds, simple inverse-distance weighting actually did slightly better (0.675 vs 0.643), which shows how forgiving random splits are. At the hardest 40° holdouts R² drops to 0.184, still ahead of GeoCLIP’s 0.151. The checkpoints and CoordBench are on Hugging Face, with a global 1 km embedding grid on Source Cooperative.
3. Where global warming has sped up since 1970
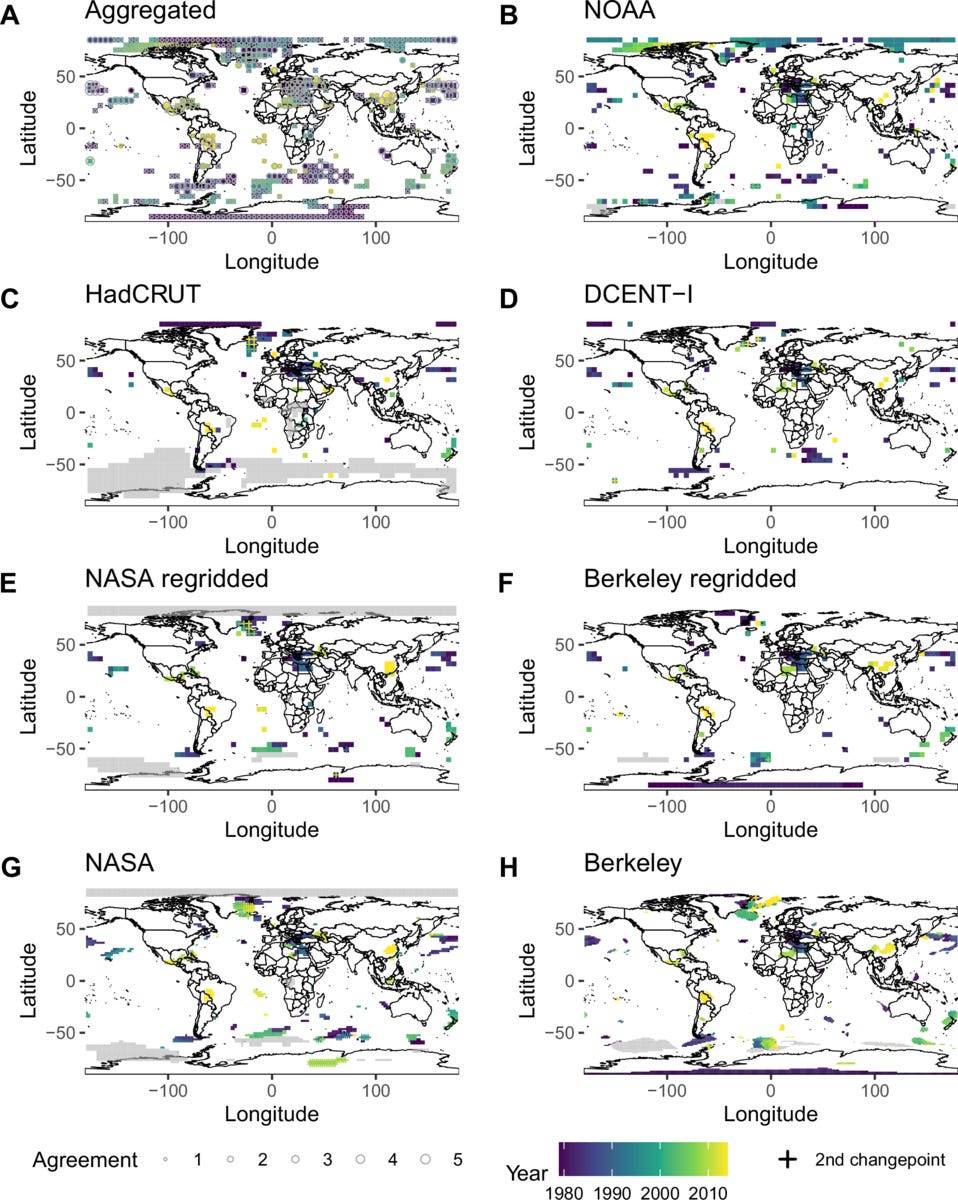
After record-breaking temperatures in 2023 and 2024, there’s an active debate about whether global warming is speeding up, but a global average can hide what’s happening region by region. A new study in Nature Communications from UC Santa Cruz, Lancaster University and NOAA’s Geophysical Fluid Dynamics Laboratory looks at where and when warming has accelerated.
They fitted piecewise linear changepoint models to annual surface temperatures for every grid cell in five global datasets from 1970 to 2024. This picks up when, and by how much, the local rate of warming changes. They regridded the finer datasets (Berkeley Earth and NASA) to 5° to compare like with like, and focused on patterns that showed up consistently across datasets.
Between 4% and 10% of grid cells show a detectable change in their warming rate, and these are mostly accelerations clustered in the Northern Hemisphere mid-latitudes. The timing varies a lot, from the late 1980s in the eastern Mediterranean (in line with falling aerosol pollution there) to around 2010 in the Gulf of Mexico, southeast Mexico and southeast China, which has the largest acceleration of all. Globally, an acceleration still isn’t detectable in surface temperatures, so the authors argue the debate needs a regional lens. The data and code are on Zenodo.
4. How local climate changes what triggers childhood asthma
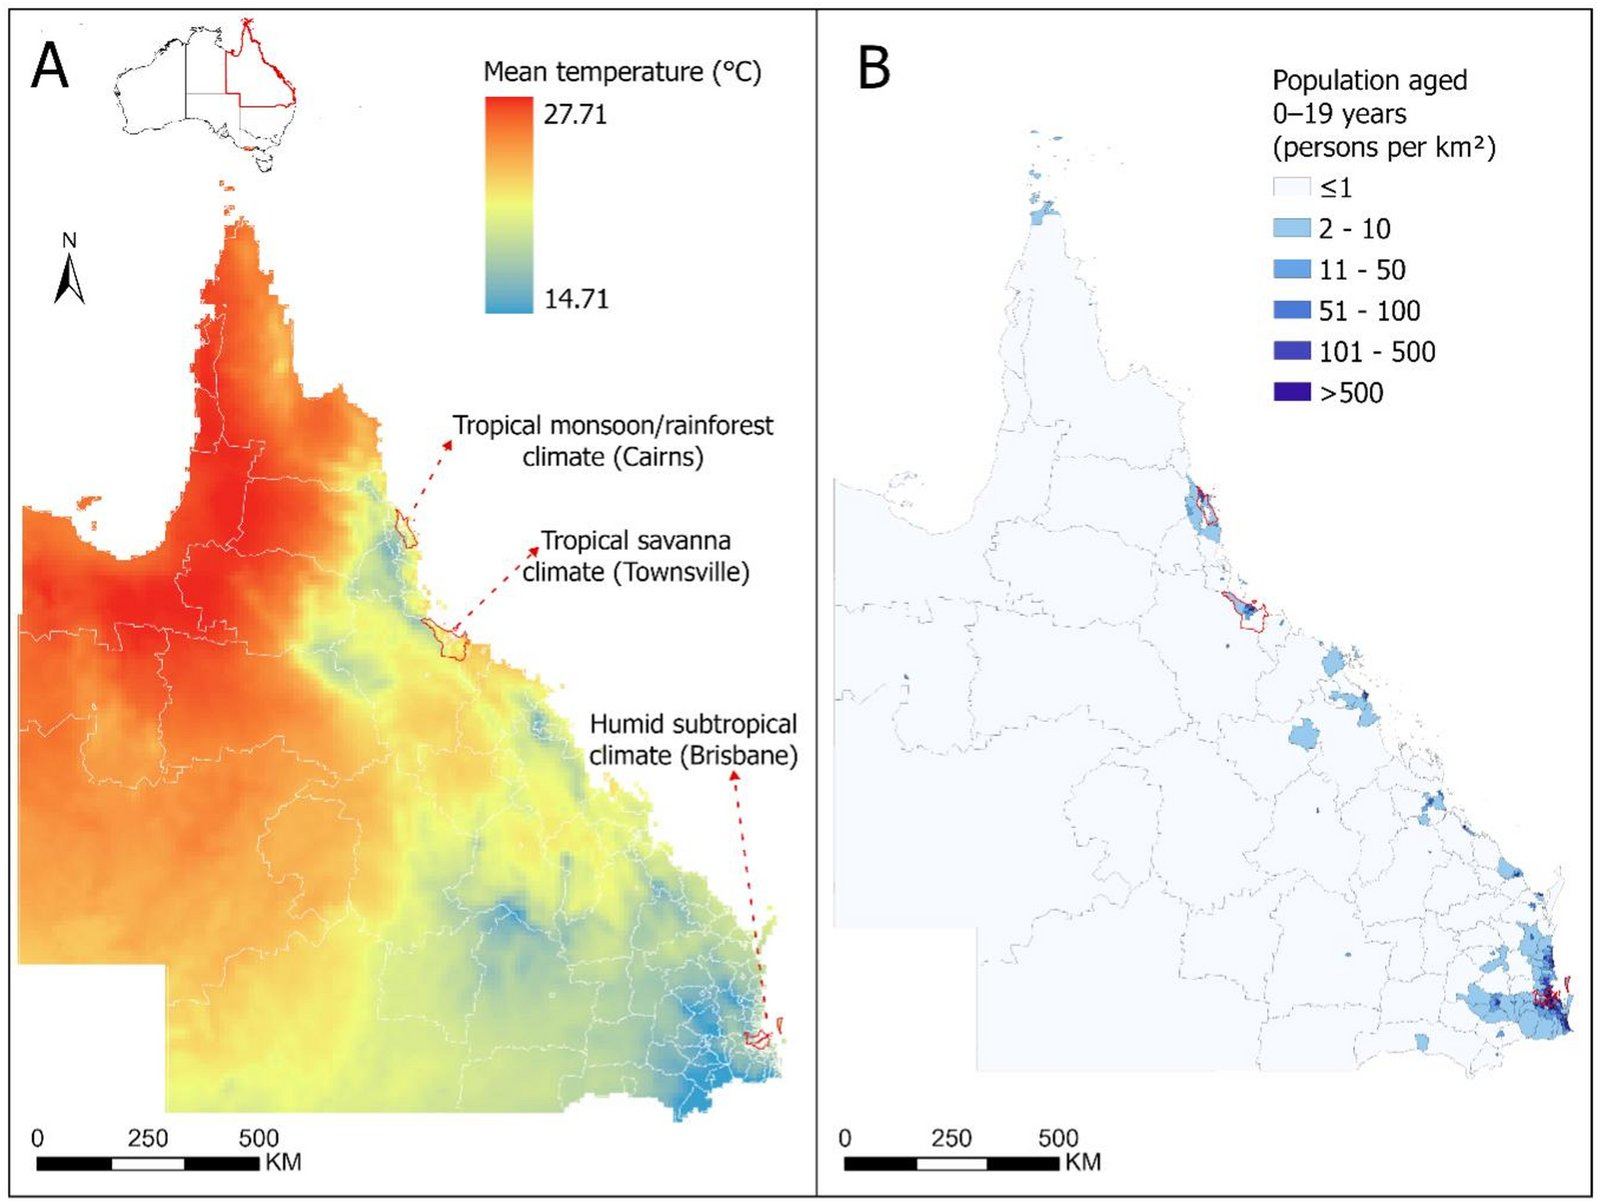
Childhood asthma hospitalisations spike at certain times of year, but it’s unclear whether the environmental triggers are the same in different climates. A new study in Scientific Reports from Queensland University of Technology compares three high-risk areas of Australia with very different local climates.
The researchers linked 11,177 child and adolescent asthma hospitalisations from 2003 to 2019 with weather, air pollution and vegetation greenness. They used distributed lag non-linear models to estimate region- and season-specific associations, and random forests to rank which environmental factors mattered most.
Greener vegetation was linked to more hospitalisations everywhere, most strongly in the tropical monsoon and rainforest region (incidence rate ratio 1.65). Warmer temperatures went with a 5–8% lower risk per 1 °C, while air pollution effects depended on region and season: SO₂ had the largest effect, in the tropical savannah wet season (IRR 2.11). Greenness and temperature came out as the leading predictors in every climate, which points towards region- and season-specific asthma surveillance.
5. Embeddings lose their edge for old-growth forest under proper validation
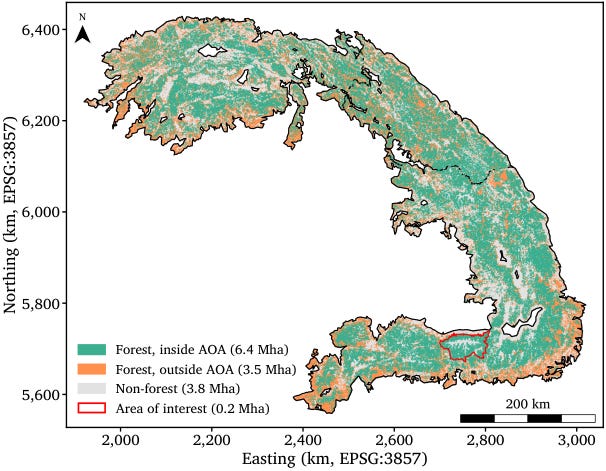
Finding Europe’s remaining old-growth forests matters for conservation, and geospatial foundation model embeddings look like an easy win, but a new study from the University of Cambridge shows part of their advantage comes from how models are validated. The team worked in Romania’s Făgăraş Mountains, building 4,825 high-confidence labelled forest parcels (1,016 old-growth and 3,837 confirmed non-old-growth) with Fundaţia Conservation Carpathia.
They compared AlphaEarth and TESSERA embeddings with standard Sentinel-1/2 features, using spatially blocked cross-validation with and without a 10 km buffer between training and test parcels. The buffer distance came from the spatial autocorrelation in the labels (a semivariogram range of about 6.6 km). Each feature set was added to a baseline of terrain and access variables like slope and distance to roads, and they tested both pixel-based XGBoost and CNNs.
Without a buffer, TESSERA led clearly (PR-AUC 0.84 vs 0.76 for both Sentinel features and AlphaEarth), but with a 10 km buffer the gap shrank to 0.03–0.04 and was no longer significant. Satellite features of any kind still added 0.21–0.25 PR-AUC over terrain and access alone, and CNNs didn’t beat pixel-based models at 10 m. The final map flags 55,025 ha (36% of the forested area) as old-growth. The code is on GitHub.
Geospatial Datasets
1. Annual crop maps for Germany, 1990 to 2023
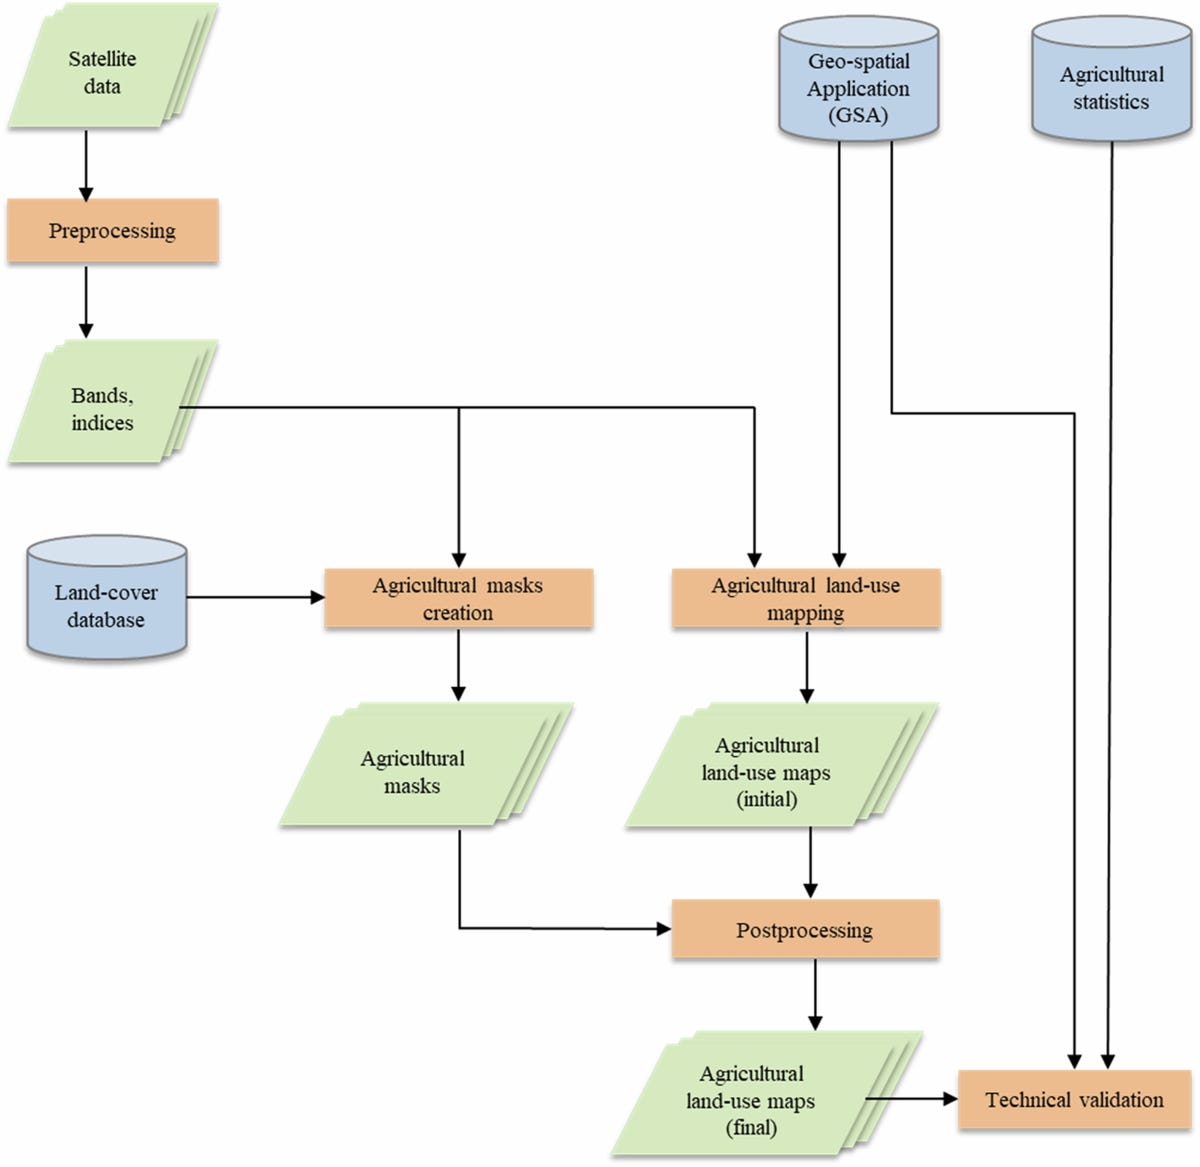
These annual agricultural land-use maps of Germany cover 13 crop classes plus grassland at 30 m for every year from 1990 to 2023, built from Landsat and Sentinel-2 with a deep learning model trained on farmers’ declarations. You can access the data here.
2. The shape of the daily temperature cycle, everywhere on land
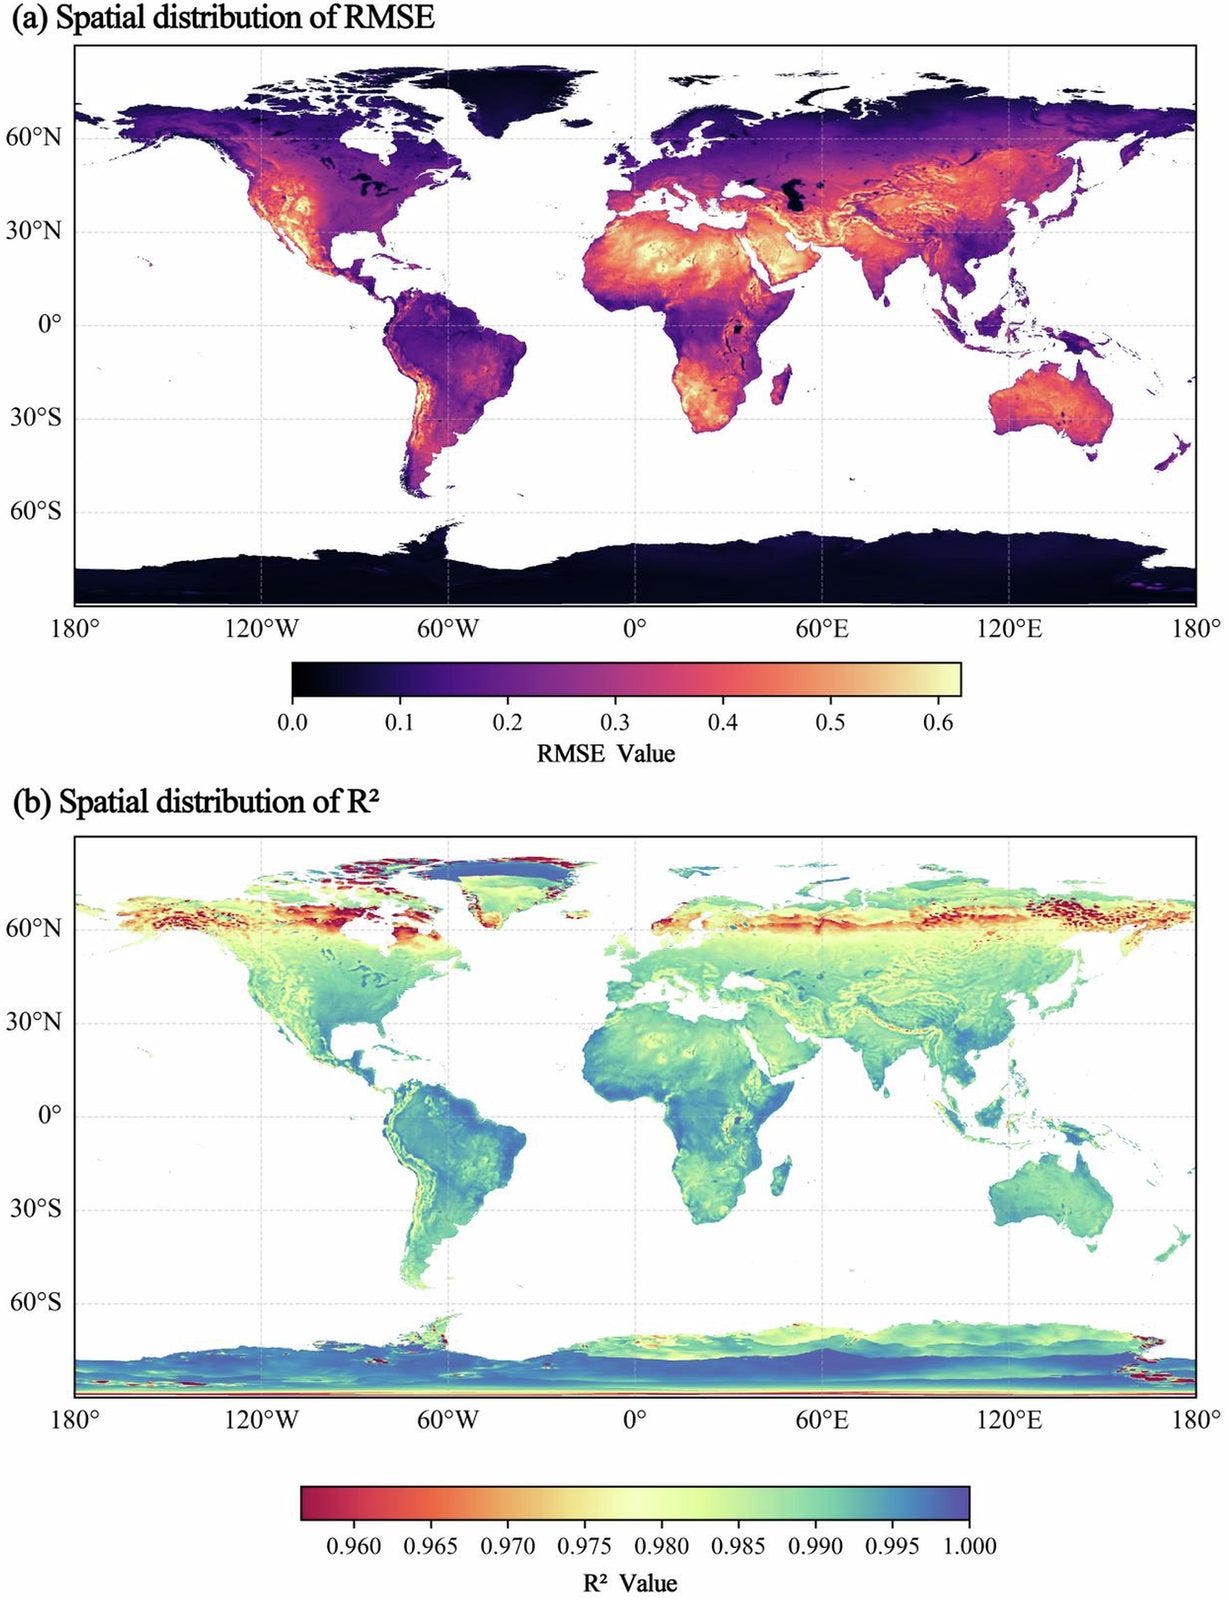
This diurnal temperature cycle dataset gives monthly parameters describing how temperature rises and falls through the day (harmonic amplitudes and phases, daily range, and the hours of minimum and maximum) over land at 0.1° for 1990–2024, fitted to ERA5-Land. You can access the data here and the code here.
3. Where China’s grazing livestock are, season by season
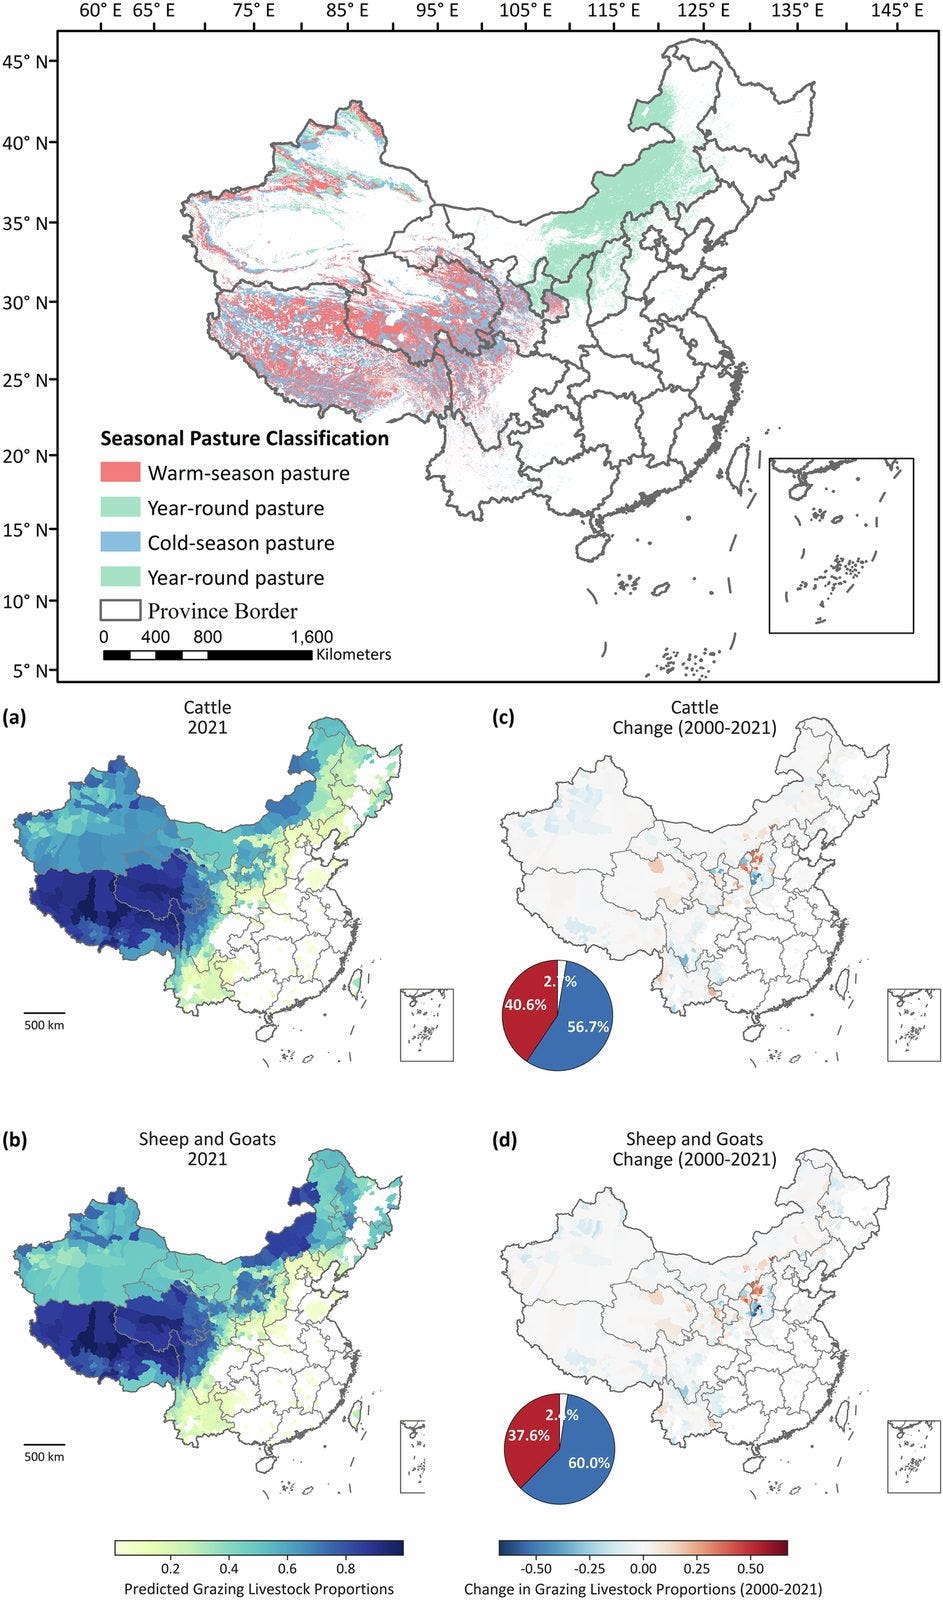
CLRD-GLPS maps cattle, sheep and goats across China’s grazing systems at 1 km for 2000–2021, with separate warm-season and cold-season distributions and uncertainty layers. You can access the data here.
4. A benchmark for county-level crop yield prediction
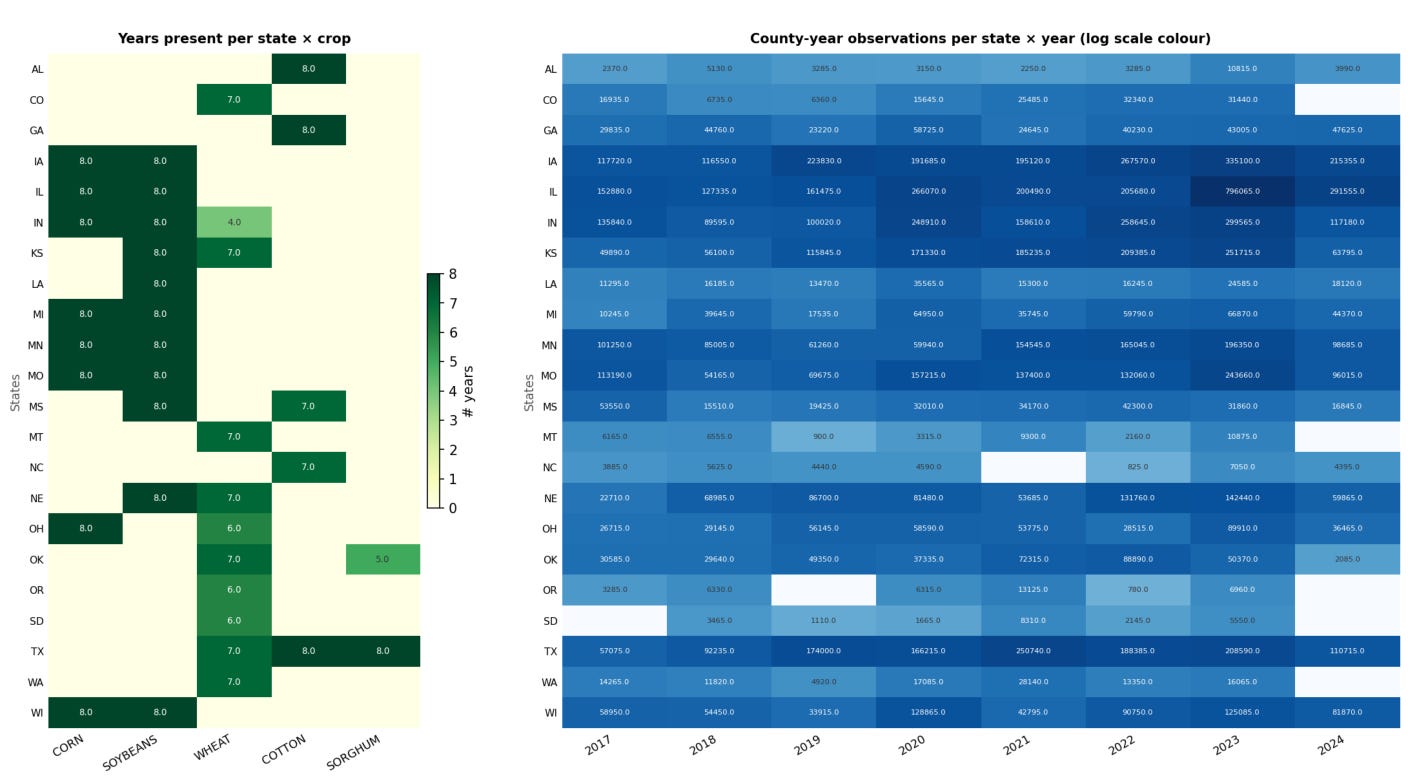
AgroBench is a US crop yield benchmark with over 13 million pixel observations for corn, soybeans, wheat, cotton and sorghum across 5,107 county-years from 2017 to 2024, combining Sentinel-2, Sentinel-1, MODIS land surface temperature, CHIRPS rainfall and SRTM elevation. A random forest baseline reaches R² 0.58 under leave-one-year-out validation. You can access the code here, with the processed data due on Zenodo.
5. US forest attributes linked to field plots
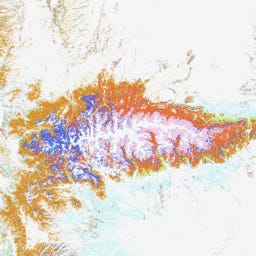
TreeMap 2023-1 from the US Forest Service maps 22 forest attributes (forest type, canopy cover, live and dead biomass, carbon, stand height and more) at 30 m across the contiguous US for 2016, 2020, 2022 and 2023. Each pixel is matched to the most similar Forest Inventory and Analysis plot, so you can pull hundreds of extra variables using the plot ID. You can access the data here.
Other useful bits
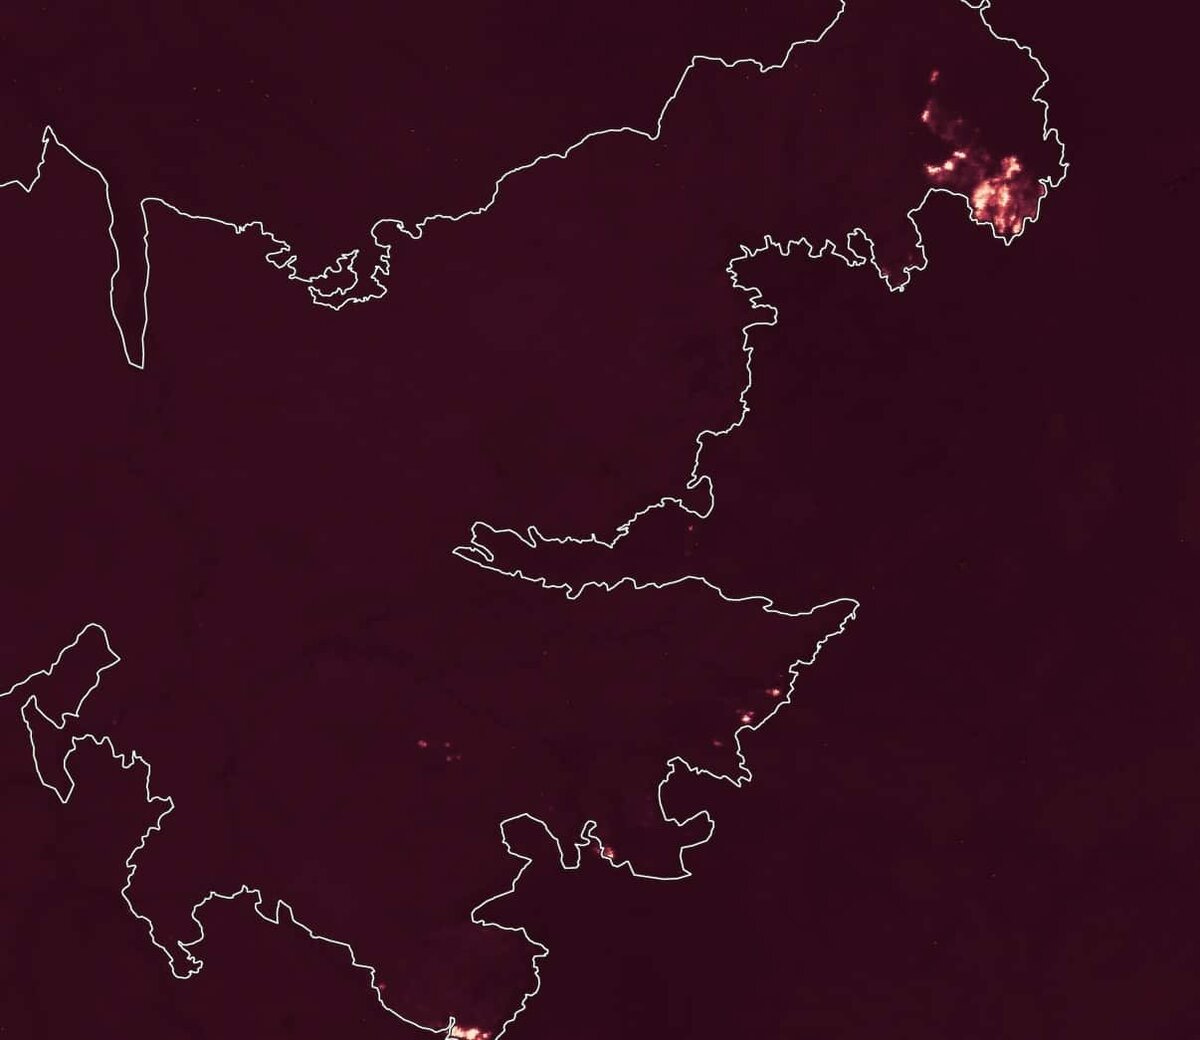
Earth Fire Alliance and Muon Space have released the first images from the FireSat constellation, whose three satellites reached orbit on 7 July and can detect fires as small as 5 × 5 m. First light includes the 290,000-acre Big Grass Fire on the Oregon–Idaho border. Early adopters get twice-daily data by the end of 2026, with hourly global revisit planned by 2029.
The Copernicus Data Space Ecosystem’s openEO service now serves 109 Copernicus Land Monitoring Service collections, plus nine new Sentinel-5P Level-2 products covering CO, NO₂, methane, SO₂, formaldehyde, ozone, aerosol layer height, aerosol index and cloud. You can load, filter, process and export them in the same openEO workflows as the other CDSE collections.
USGS has reprocessed about 44,000 Landsat MSS products from Landsat 2 and 3 after finding wrong gain and offset values in Bands 4 and 5 that made scenes look too bright or too dark. Around 1,700 products also had a solar elevation bug that wrongly flagged roughly 27,000 extra pixels as cloud, so if you work with 1970s Landsat, check the processing date in your product IDs.
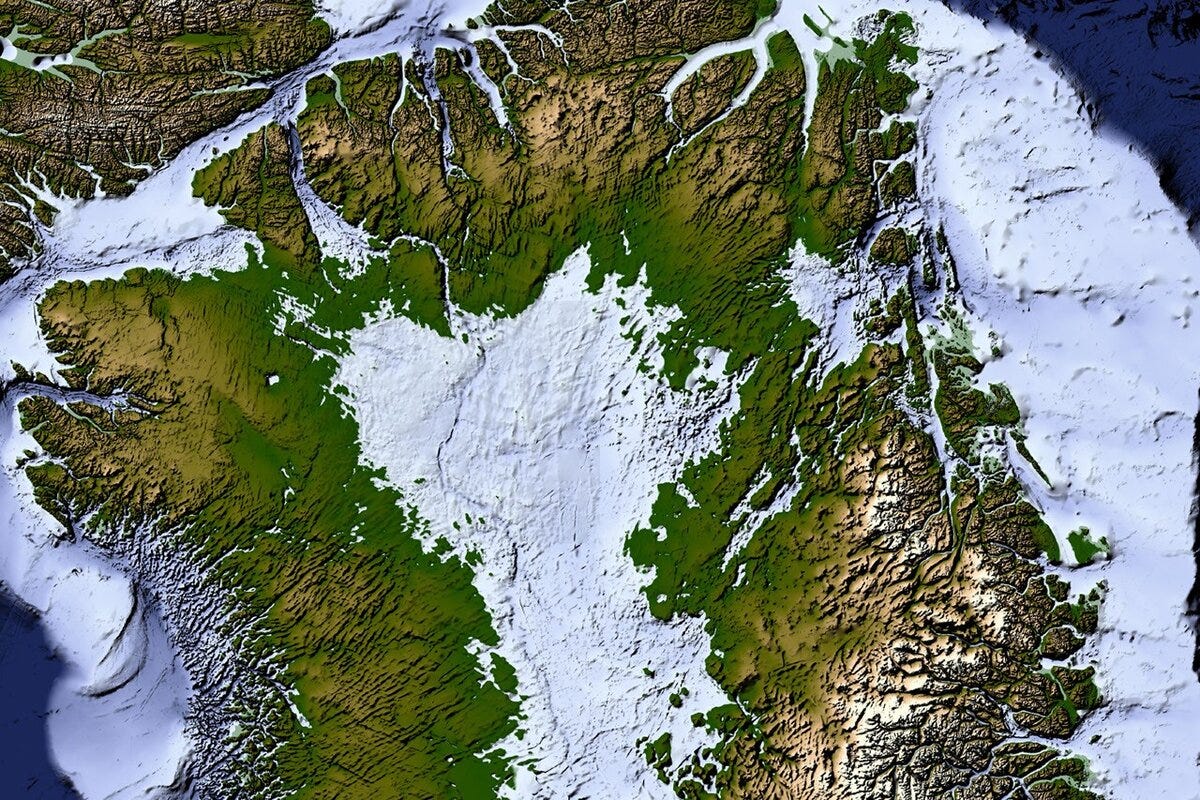
NASA has mapped 1,943 valleys hidden beneath Greenland’s ice, about a third of them newly identified, by reading subtle bumps and dips in satellite data of the ice surface. About half of the previously known valleys turn out to extend much further inland, and the work improves the BedMachine Greenland dataset.
Image: NASA Earth Observatory.
Hydrosat has unveiled its Osiris thermal constellation, with the first two satellites launching in 2027. Each carries a 25 m thermal sensor (three longwave infrared bands and a 160–340 km swath) plus a 9-band visible and near-infrared sensor at 10 m.
Jobs
Yale University is looking for a Lead, Geospatial Artificial Intelligence and Machine Learning based in New Haven, United States.
Planet is looking for a Data Scientist based in Haarlem, Netherlands (hybrid).
Moody’s is looking for an Analytics & Modeling Analyst, Coastal Flood based in London, United Kingdom.
Forschungszentrum Jülich is looking for a Research Software Engineer, AI and Earth Observation based in Jülich, Germany.
Just for Fun
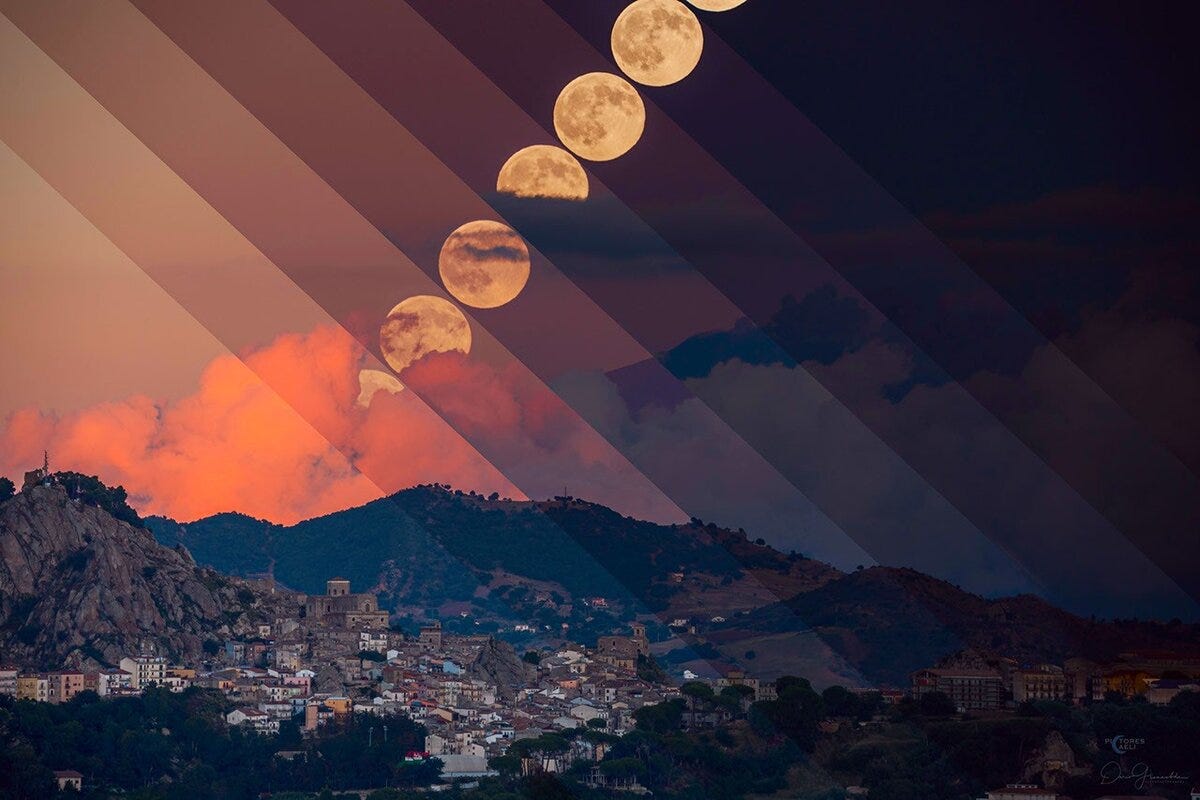
This composite of the Harvest Moon rising was taken near Nicosia in Sicily, with ash and gas from Mount Etna drifting in the background. The lower clouds reflect the colours of anti-twilight, and the pink band low in the sky is the Belt of Venus. At full moon the Moon and Sun sit in opposition, so the Moon rises just as the Sun sets.
That’s it for this week.
I’m always keen to hear from you, so please let me know if you have:
new geospatial datasets
newly published papers
geospatial job opportunities
and I’ll do my best to showcase them here.
Yohan