

🌐 The massive $192 billion trade risk hiding in our shipping lanes
PLUS: surprises in forecasting extreme rainfall, simple models can outperform more complex ones, and more.

Hey guys, here’s this week’s edition of the Spatial Edge — a geospatial newsletter that’s hotter than a Nelly song… In any case, the aim is to make you a better geospatial data scientist in less than five minutes a week.
In today’s newsletter:
Maritime Risks: Narrow lanes face $192 billion in trade risks.
Extreme Rainfall: Local history drives risks for a billion people.
Simple Models: RNNs outperform complex setups for African rainfall.
Ecosystem Loss: Agriculture threatens vital grasslands and non-forest landscapes.
Building Data: High-resolution building characteristics for the Global South.
Research you should know about
1. The massive $192 billion trade risk hiding in our shipping lanes
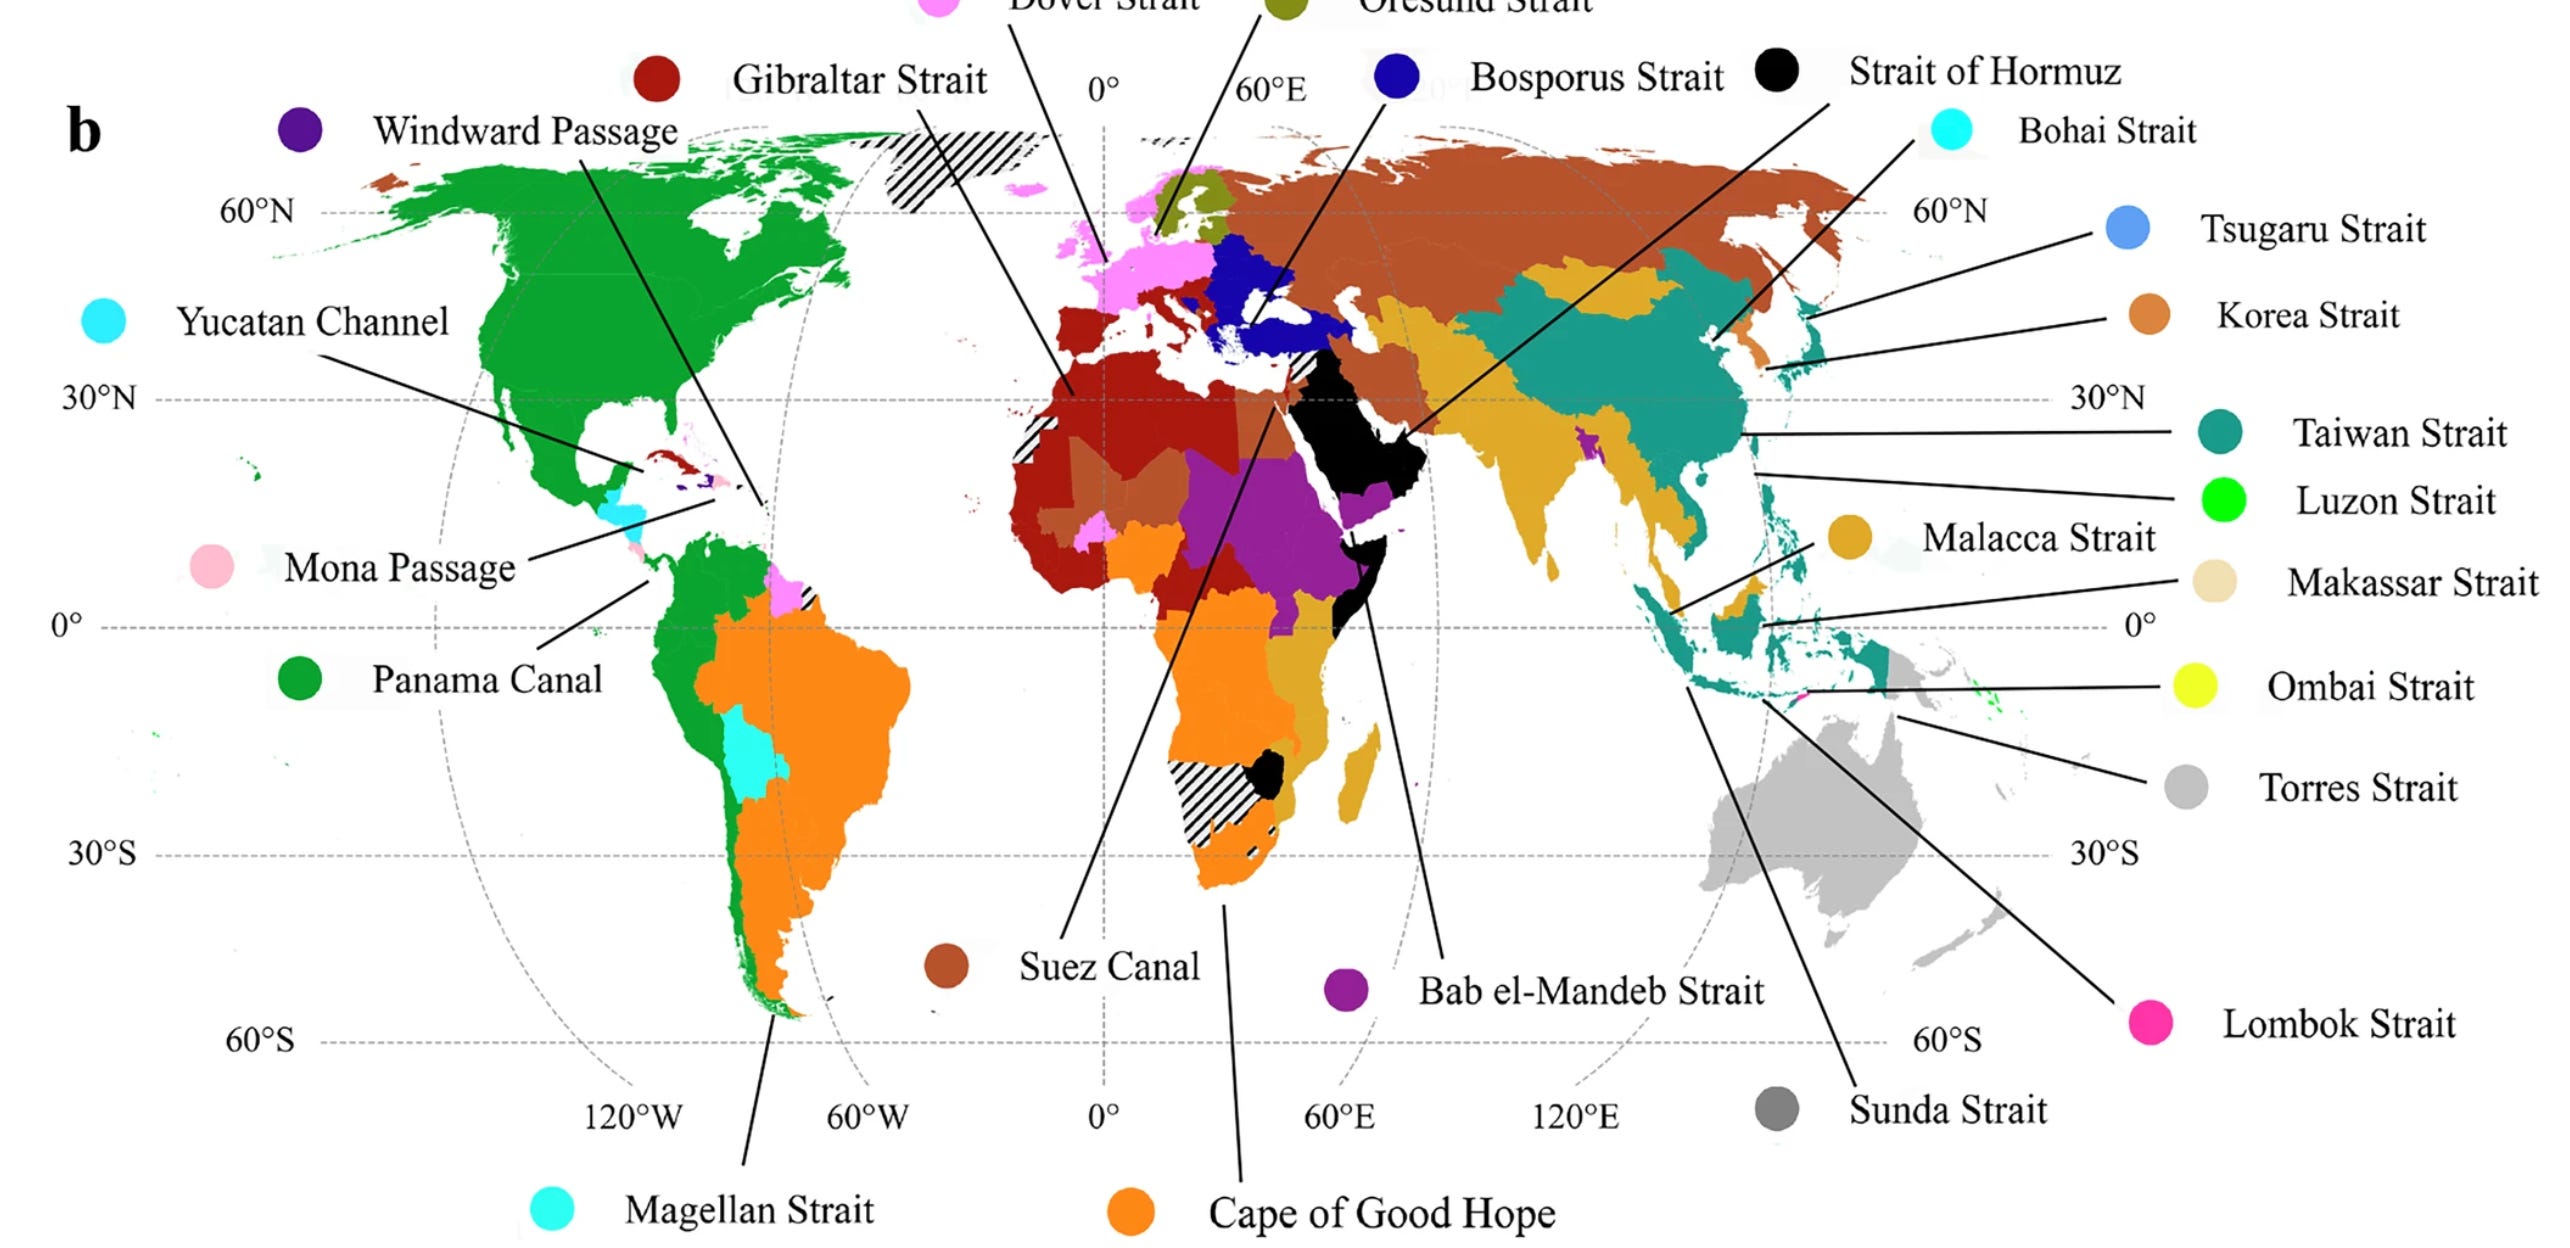
Global trade relies on a handful of narrow passageways, known as maritime chokepoints, which are surprisingly vulnerable to a bunch of different hazards. A new study in Nature Communications finds that about $192 billion of trade is exposed to disruptions every year from things like cyclones, droughts, and geopolitical conflict. While we often think of these as local problems, the effects are actually systemic. Many countries are heavily dependent on multiple chokepoints without even realising it, particularly those in Central Asia or West Africa that might be thousands of kilometres away from the actual trouble.
To figure out the actual risk, the team calculated the Expected Value of Trade Disrupted by looking at how likely a hazard is, how long a closure would last, and how much trade would be blocked. They also validated their transport model against real-world vessel movements from the PortWatch platform, which uses AIS data to track ships. This approach accounts for whether there’s a way to go around a blockage or if ships are just stuck. They even looked at how joint disruptions might happen, such as when a single cyclone hits multiple chokepoints at once.
Altogether, the annual economic bill for these disruptions is roughly $10.7 billion, with an extra $3.4 billion tacked on from spiked freight rates. These price jumps happen because rerouting ships pulls capacity out of the global fleet, which makes shipping more expensive for everyone everywhere. Geopolitical risks at the Taiwan Strait and the Suez Canal are the primary drivers of these losses. Even if a country isn’t near a conflict zone, it might still see higher inflation and pricier goods because of the way these maritime links are all stitched together.
You can access the data and code here.
2. We’re underestimating the next record-shattering rain event

We often think of extreme rainfall through the lens of a steady climate trend, but a new study in Nature Communications shows that local history is a much bigger driver of near-term disasters. The researchers found that record-breaking potential depends on a bunch of factors, but the size of the standing record is a pretty big one. If a region has a low historical record just because of natural luck, it’s in a much more dangerous spot for a surprise jump in the near future. This path-dependency means that our local experience of the past is just as important as the global models we use to predict the future.
The way climate change interacts with these records is pretty surprising because it doesn’t hit every place the same way. On average, moderate warming is set to hike up the chance of a record-breaking event by about 40% by 2050. However, the most sensitive areas are actually the ones with high standing records. These regions see the steepest increase in risk, with a 75% jump in the likelihood of a record-shattering event. It turns out that while low-record areas are most at risk right now, the high-record areas are becoming less safe at the fastest rate.
There’s also a human element involved in how these records turn into full-blown disasters. When a place hasn’t seen a record-breaking storm in a long time, the local society often loses its sense of risk, which leads to a massive gap in preparedness. This is a major threat for about a billion people who are likely to face record-shattering rainfall by the end of the century. Many of these hotspots are in fast-growing urban areas where poverty and rapid urbanisation make the population even more vulnerable to the next big surprise.
You can access the code here.
3. Complex models aren’t always better for rainfall

I've been looking at how we predict rainfall in Africa lately, as it's a pretty big factor for food security across the continent. A new paper in Scientific Reports examines the use of deep learning for daily forecasts in cities like Nairobi and Abuja. The researchers were analysing over 40 years of NASA’s MERRA-2 data, which is a popular reanalysis dataset for this kind of work, to see if they could improve on traditional stats by comparing single models like Recurrent Neural Networks (RNNs) against more complex hybrid setups.
The results are a bit of a reality check for anyone who thinks more complex is always better. Even though hybrid models are theoretically more powerful, the study found that single models actually did a better job in most spots. Specifically, the RNN came out on top in Nairobi, Pretoria, and Rabat (this was news to me, since I thought the RNN was all but dead…). There are a bunch of reasons for this, but it’s mostly because simpler models are more reliable, have fewer parameters, and don’t overfit the noisy weather data as easily. The only place where a hybrid model took the lead was in Abuja, which suggests that extra complexity only pays off when the rainfall patterns are particularly wild.
There’s also a bunch of interesting spatial stuff happening here. The researchers found that rainfall patterns between these cities aren’t really correlated, meaning local atmospheric conditions are driving the bus rather than one big continental system. Relative humidity was the biggest predictor in most spots, which I guess makes sense for the tropics. However, in drier places like Rabat, the weather from the previous two days was the most important factor. This highlights how important it is to use location-specific modelling because what works for one African city can’t just be copy-pasted onto another (something we’ve all been guilty of)…
4. Why our focus on deforestation is missing half the picture
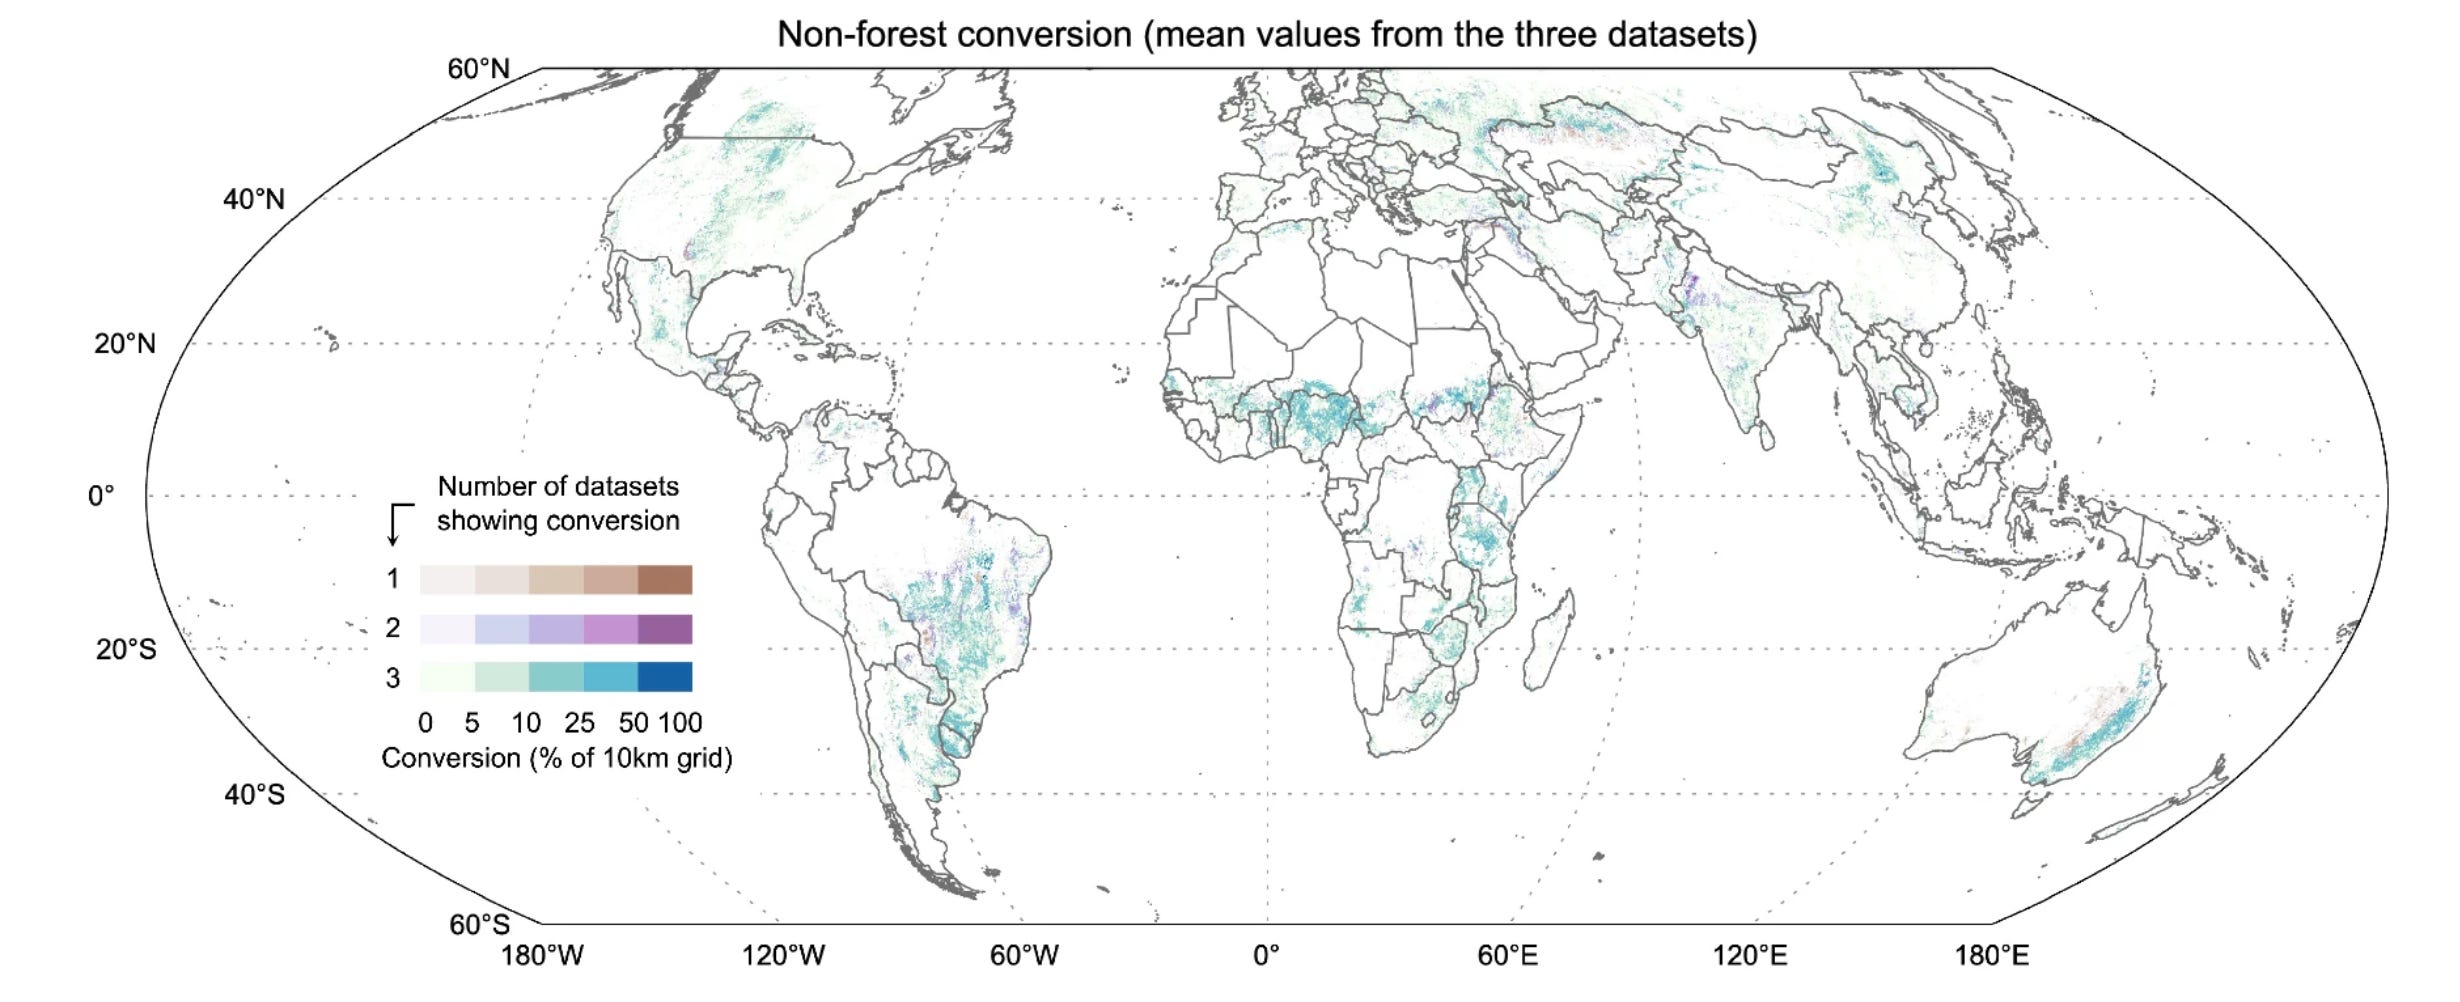
While the world’s eyes are usually glued to deforestation rates in the Amazon, a new study shows that agricultural expansion is impacting non-forest ecosystems just as much. Grasslands, shrublands, and wetlands are often overlooked in global conservation talks, yet they store huge amounts of carbon and host a massive chunk of the planet’s biodiversity. By analysing land cover changes from 2000 to 2020, researchers found that the conversion of these open landscapes into croplands and pastures is often more extensive than the loss of actual forests. This is a pretty big deal because these areas are typically less protected and are more vulnerable to being ploughed up for farming.
There’s a bunch of reasons why this study stands out, but the main one is how it handles satellite data. The team used three different high-resolution datasets to track where these changes are happening, which is important because different models have different ways of defining a forest or a wetland. For example, some datasets might count tree crops like oil palm as forest while others see them as agriculture, which can lead to messy results. By comparing the data they analysed, they identified a consistent group of global hotspots where non-forest land is disappearing fast. Brazil, the United States, China, Russia, and Argentina topped the list, making up over 60 per cent of all non-forest conversion worldwide.
The environmental cost of this shift is massive. The study found that habitats for over 5,000 threatened species have been affected by this expansion, and over half of these creatures rely specifically on non-forest ecosystems. Even within supposedly protected areas, conversion rates for grasslands and wetlands are actually increasing. This suggests that current conservation frameworks are failing to shield these vital landscapes, particularly in places where agricultural suitability makes them a prime target for new farms. As supply chains come under more scrutiny, focusing solely on trees will likely leave some of the world’s most carbon-rich and diverse landscapes at risk.
You can access the code here.
Geospatial Datasets
1. Building characteristics dataset

This dataset derives high-res (100 m) annual building characteristics for the Global South from 2016 to 2023, based on the Google Open Buildings Temporal dataset. It provides six spatial layers per year, including building count, area, volume, height variability, and proximity metrics. You can access the data here.
2. Global vegetation dataset

VegVault is a huge, versioned SQLite database (~110 GB) that brings together global vegetation data across both the present day and the last ~20,000 years. You can access the data here and the code here.
3. City and town boundaries dataset
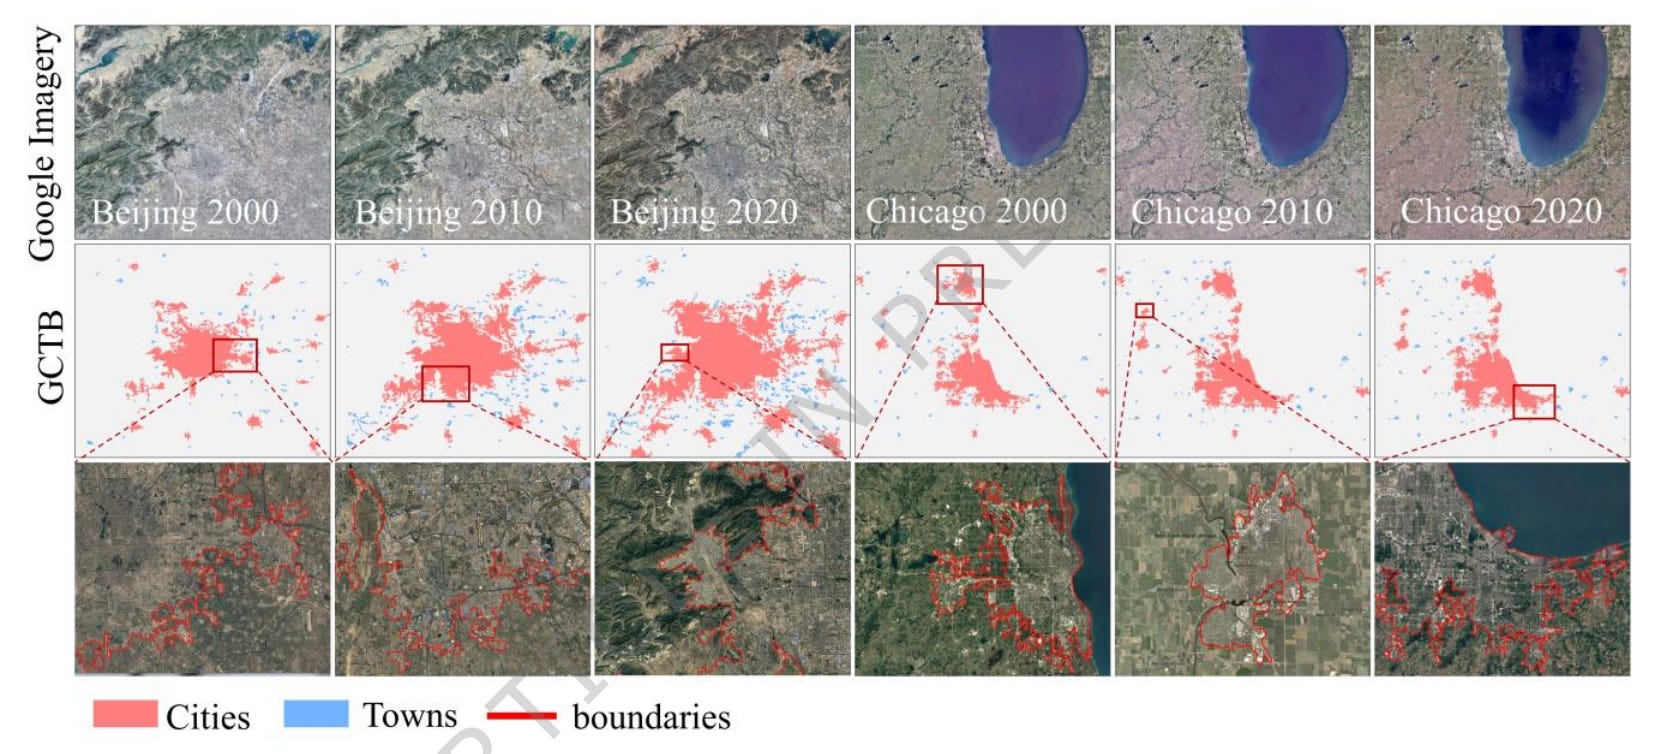
A new Global City and Town Boundaries (GCTB) dataset maps annual urban settlement boundaries worldwide from 2000–2022 at 30 m resolution. You can access the data here and the code here.
4. Cartographic map benchmark dataset
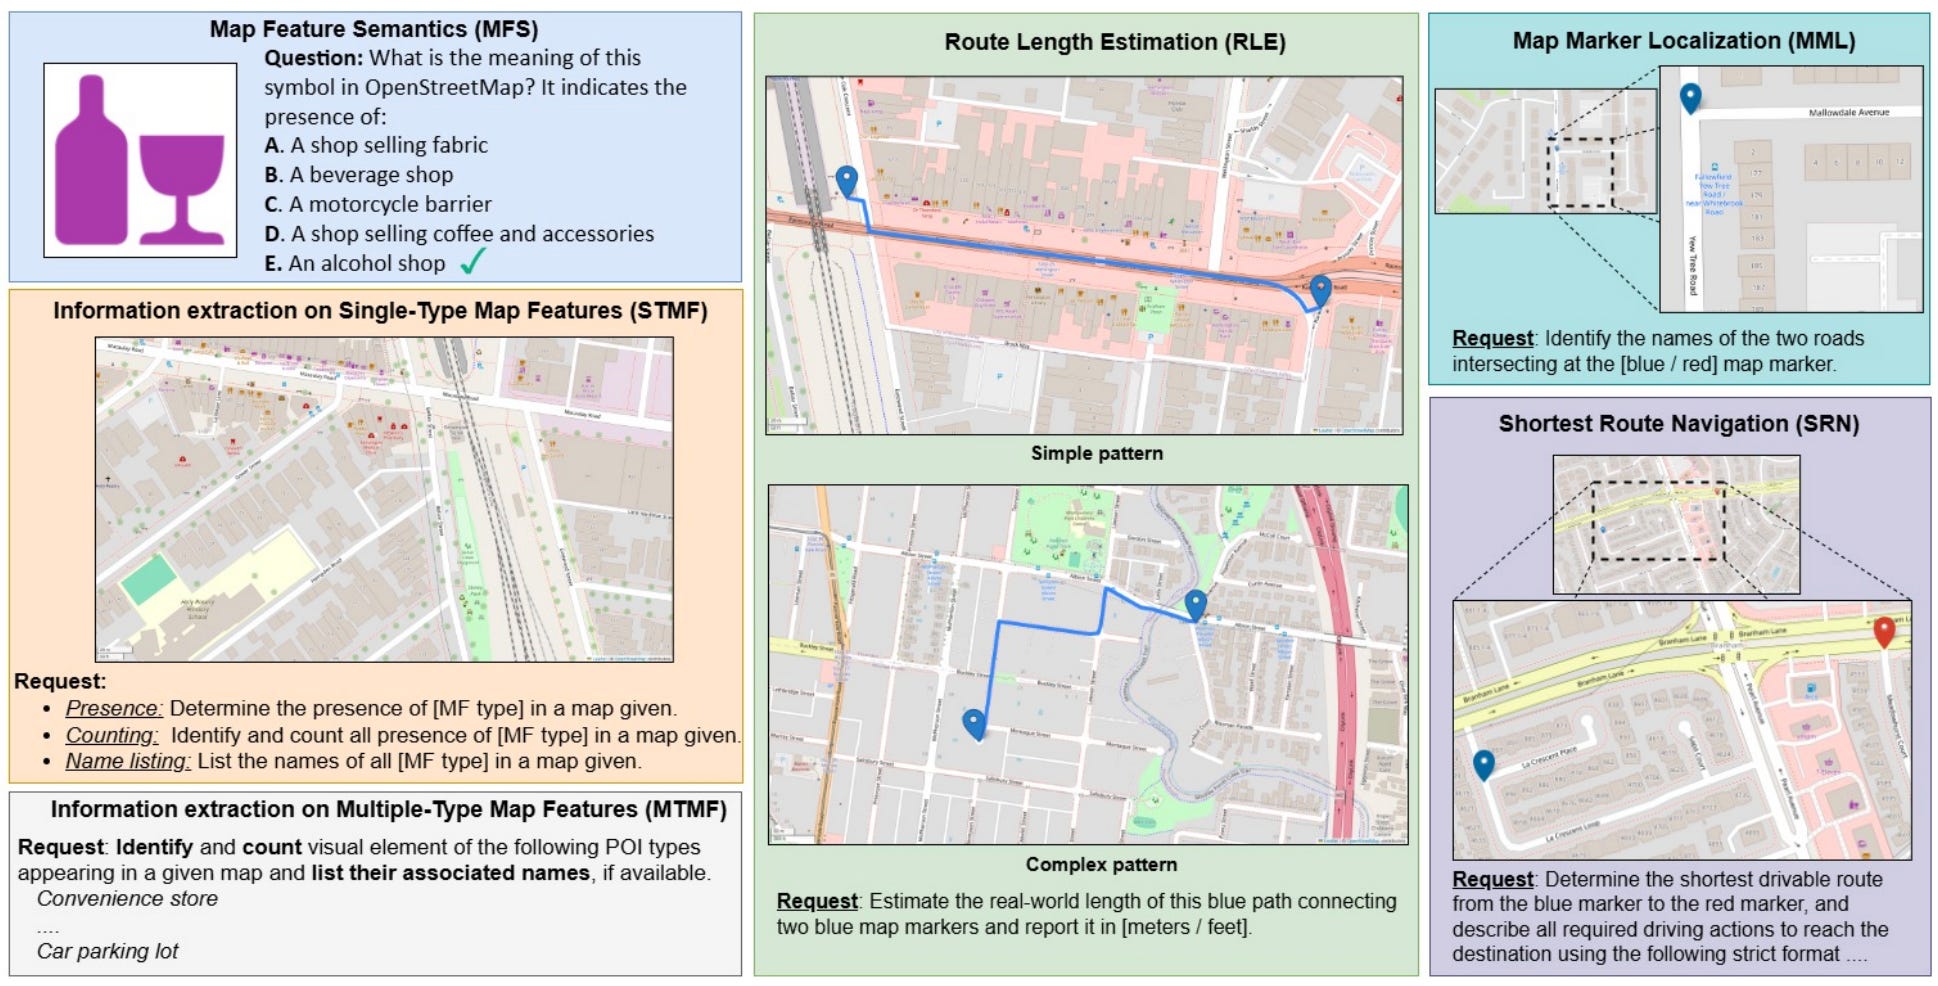
CartoMapQA is a new benchmark dataset for testing how well vision–language models can actually understand cartographic maps, not just talk about them. It includes 2,251 QA samples across 853 OpenStreetMap-rendered maps, covering a neat hierarchy of tasks from symbol/feature semantics and feature counting/name extraction through to scale-bar distance estimation and turn-by-turn shortest-route navigation. You can access the data and code here.
Other useful bits

This handy Python–Flask tool lets you draw a box on a map and download OpenStreetMap or satellite tiles for offline use, exporting them as a ZIP or MBTiles file. It’s ideal for personal or educational projects, with features like tile count previews, live map previews, and flexible zoom levels.
The Library of Congress Geography and Map Division has released its 2025 digital scan highlights, featuring notable 18th-century Dutch wall maps and a rare hand-drawn Islamic world map. The collection also includes significant historical documents such as Albert Speer's 1942 Berlin redevelopment plan and various newly digitized panoramic "bird's-eye-view" city maps.
As satellite launches are projected to reach 1.7 million by 2030, astronomers are urging UN bodies to establish international standards to mitigate light and radio interference. While some operators are testing non-reflective coatings and signal-steering, the sheer volume of planned megaconstellations threatens to permanently degrade both optical and radio observations.
Scientists have used Parker Solar Probe data to map the Alfvén critical surface, the "spiky" boundary where solar plasma becomes solar wind. These maps show the surface expands and becomes more irregular during solar maximum, offering a new tool for predicting how solar storms might affect Earth.
Jobs
The Alan Turing Institute is looking for a Senior Research Associate based in London under its Environment Forecasting Mission.
The Gates Foundation is looking for a Senior Strategy Officer, Geospatial Insights (LTE) based in Seattle under its Global Development Division.
UNOCC is looking for a Geographical Information Systems Intern under its Data Unit (offering a flexible work arrangement).
Just for Fun
Check out this "Earthrise" footage captured by the Japanese lunar orbiter, SELENE (Kaguya).
That’s it for this week.
I’m always keen to hear from you, so please let me know if you have:
new geospatial datasets
newly published papers
geospatial job opportunities
and I’ll do my best to showcase them here.
Yohan