

🌐 The unexpected drivers of global warming
PLUS: new $450 open-source LLM beats OpenAI's o1, using deep learning to recognise depth from 2D images, and more.


Hey guys, here’s this week’s edition of the Spatial Edge — a weekly round-up of geospatial news.
I’ve come to think of geospatial data science as the ‘Pepsi’ of the data science world. Not as cool as the straight-up Computer Science folks (’Coca Cola’), but with a bit better taste than the Human Geography crowd (’Dr Pepper’). In any case, with takes like this, the aim is to make you a better geospatial data scientist in less than 5 minutes a week.
In today’s newsletter:
Unexpected global warming causes: the role of albedo in 2023.
Depth Completion: detecting depth from 2D images
New LLM: UC Berkeley’s Sky-T1 outperforms OpenAI at low training costs.
NASA Data: New datasets for weather, ozone, and glaciers.
Living Atlas: High-res elevation updates improve terrain analysis.
Research you should know about
1. A surprising cause of global warming in 2023

2023 was a pretty crazy year for the environment. The average temperature rose to 1.5°C above the pre-industrial level (though a couple of days ago we were told this was surpassed by 2024).
In any case, the scientific community has discussed a bunch of factors contributing to these temperatures in 2023:
El Nino
Greenhouse gases
Stronger solar activity
Bigger volcanic eruption effects, and so on.
But even after factoring in these things, 0.2°C in warming was still unexplained.
So a new study published in Science investigates this unexplained increase in global warming in 2023. Surprisingly, they’re finding their answers in the clouds (excuse the pun).
Using data from NASA’s CERES satellite and ERA5 climate data, they found an interesting anomaly: 2023 seemed to have the lowest planetary albedo recorded. Planetary albedo is basically the fraction of sunlight that’s reflected from Earth back into space. And when less sun is reflected, that means it’s absorbed by Earth (which contributes to warming).
They studied how changes in cloud cover and melting sea ice contributed to Earth reflecting less sunlight back into space. To work this out, they simulated how energy flows through the Earth’s climate system (using a two-layer energy balance model).
They found that fewer clouds, especially over the oceans in northern mid-latitudes and tropical regions, allowed more sunlight to reach the Earth’s surface, increasing temperatures.
But why did cloud cover reduce?
It’s a result of:
Less air pollution
Natural climate variability (i.e. random changes in weather patterns)
A new feedback loop where warming itself causes clouds to disappear
But if this decline in cloud cover is part of a longer-term trend, it could make the Earth’s climate more sensitive to greenhouse gases than we previously thought. This means warming could happen faster than expected…
2. Marigold-DC: Zero-Shot Monocular Depth Completion with Guided Diffusion

Depth detection is a pretty cool space. I’m personally interested in seeing whether we can take 2D satellite images, apply some type of depth detection algorithm to them, and then create digital elevation models (DEMs).
This is why I was interested to see this new study from some folks from ETH Zurich. They’ve developed a method called Marigold-DC, which upgrades sparse and patchy depth measurements into detailed depth maps for traditional images.
Here’s the problem they’re tackling: many depth sensors (like those used in mapping or robotics) produce incomplete or low-density data. This is where the measurements are either missing large chunks of information or only capture a small number of points in a scene. Marigold-DC addresses this by using a pretrained image-based depth model to fill in the gaps.
The magic lies in how they adapted an image-based diffusion model called Marigold to work with sparse depth inputs. Essentially, their process uses test-time optimisation: it starts with Marigold’s strong understanding of scene layouts and gradually aligns that knowledge with the sparse sensor data. The result is a final depth map that’s detailed and consistent with the limited data points.
To test this, the team ran Marigold-DC on six real-world datasets, covering both indoor and outdoor settings. These datasets vary in sensor types and noise levels, so it’s a good stress test. The results were impressive. Marigold-DC outperformed existing methods, especially when the available data was extremely sparse.
There is one catch: the process is more computationally heavy than standard methods, so speeding it up is a goal for future work. But with its potential for producing high-quality depth maps in tough conditions, Marigold-DC feels like a promising step forward.
P.S. You can check out their code here.
Geospatial Datasets
1. New NASA datasets

NASA has released a bunch of interesting datasets for December 2024. It covers stuff like the MAIA Surface Monitor data for particulate matter analysis, CPEX precipitation datasets for storm research, and LGRIP30 Version 2 maps for detailed cropland monitoring. The MERRA-2 updates enhance stratospheric ozone studies, while new soil moisture and glacier data expand hydrological and cryospheric research.
2. Living Atlas World Elevation Layers update

Esri's ArcGIS Living Atlas of the World has rolled out updated elevation layers with high-resolution lidar data from sources like NRCan, BEV, and USGS. Key additions include 1- and 2-meter HRDEM data for Canada, 10-meter DTMs for Austria, and seamless DEM datasets for the U.S., Mexico, and Canada. These updates improve Terrain, TopoBathy, and Hillshade services, enabling more detailed visualizations and analyses.
3. Global mangrove height map

A global mangrove canopy height map with a 12-metre resolution for 2011–2013 has been released. Created using TanDEM-X elevation data and calibrated with NASA's GEDI and Lidar, the map achieves 2.4-meter accuracy. It captures canopy heights up to 60 meters in Colombia and Gabon. You can access the data here and the code here.
4. Intense precipitation dataset

The Qinghai-Tibet Plateau Precipitation Intensity-Duration-Frequency Curves (QTPPIDFC) dataset provides gridded data for analyzing extreme precipitation in this high-risk region. With 1/30° resolution, it covers durations from 1 to 24 hours and return periods up to 100 years. You can access the data here and the code here.
Other useful bits
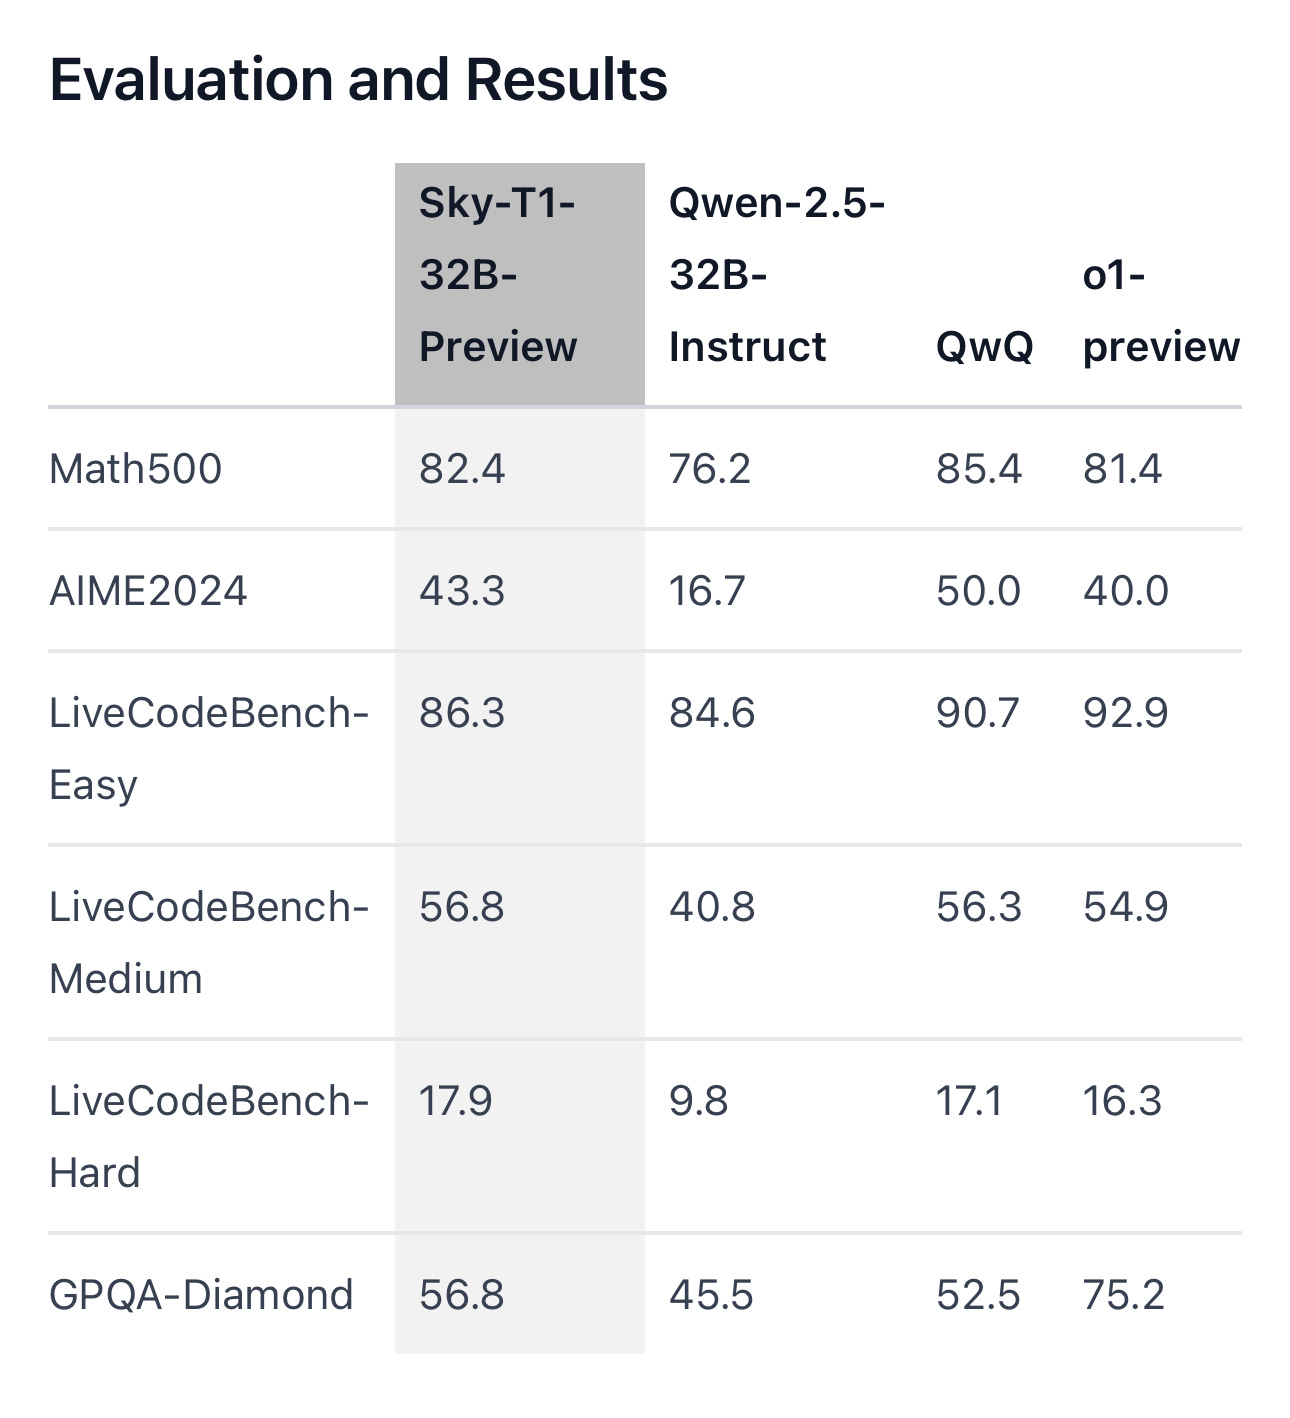
UC Berkley have released an open-source LLM, Sky-T1, that outperforms OpenAI’s o1-preview model on several metrics. The cost of fine-tuning the model was only $450 (i.e. the cost of a latte in New York) 🤯. This is mindboggling. To put this in context, the estimated cost of training OpenAI’s GPT-4 model was $41-78 million.
Jeff Bezos’s company, Blue Origin, planned to launch its New Glenn rocket on Monday, but the launch was called off just minutes before due to an unspecified problem. They’re reportedly considering rescheduling the launch for Thursday.

NASA’s Sentinel-1 synthetic aperture radar data is now certified to CEOS-ARD standards, making it "plug-and-play" with GIS tools and optical imagery. The upgrade supports seamless integration with tools like Landsat and Sentinel-2.
Check out this curated list of Earth Observation Conferences 2025 from Aravind at Terrawatch Space. It’s a pretty comprehensive list of workshops and events focused on Earth observation. I’m hoping to make it to Vienna for the Living Planet Symposium in June. And if you haven’t already, you should subscribe to his newsletter.

Jobs
UNOPS is looking for a GIS Expert based in Lebanon.
FHI 360 is looking for a Senior Director for Emerging Global Health Threats.
UNICEF is looking for a (1) Digital Innovation Officer and a (2) Project Management Consultant.
FAO is looking for a (1) Remote Sensing and GIS Specialist and a (2) Livestock and Environment Specialist.
The World Bank is looking for an E T Consultant in Geospatial Planning.
The International Atomic Energy Agency (IAEA) is looking for a Satellite Imagery Analyst under its State Infrastructure Analysis Section.
Just for fun

An open-source tool called Arnis lets Minecraft players generate maps of real-world locations using geospatial data from OpenStreetMap. You can check out the tool on Github here.
That’s it for this week.
I’m always keen to hear from you, so please let me know if you have:
new geospatial datasets
newly published papers
geospatial job opportunities
and I’ll do my best to showcase them here.
Yohan
Is it possible to quantify the increasing impact of solar panels as well (on the decreasing reflection)? What % reduction of solar reflection is estimated due to the advent of solar energy or this is still quite negligible?