

🌐 Training remote sensing models 10x faster with OpenStreetMap
PLUS: A smarter way to detect informal settlements, and super-resolving hyperspectral images

Hey guys, here’s this week’s edition of the Spatial Edge. If you know what a Zarr is, then we have one thing to say to you: welcome home. In any case, the aim is to make you a better geospatial data scientist in less than five minutes a week.
In today’s newsletter:
GeoLink model: Trains remote sensing 10× faster
Mapping favelas: Graph networks detect informal settlements
Hyperspectral AI: Boosts both spatial and spectral detail
Zero tillage: Proven to cut India’s stubble burning
High-res DEM: NASA’s EarthDEM provides 2m resolution data.
Research you should know about
1. Training remote sensing models 10x faster with OpenStreetMap
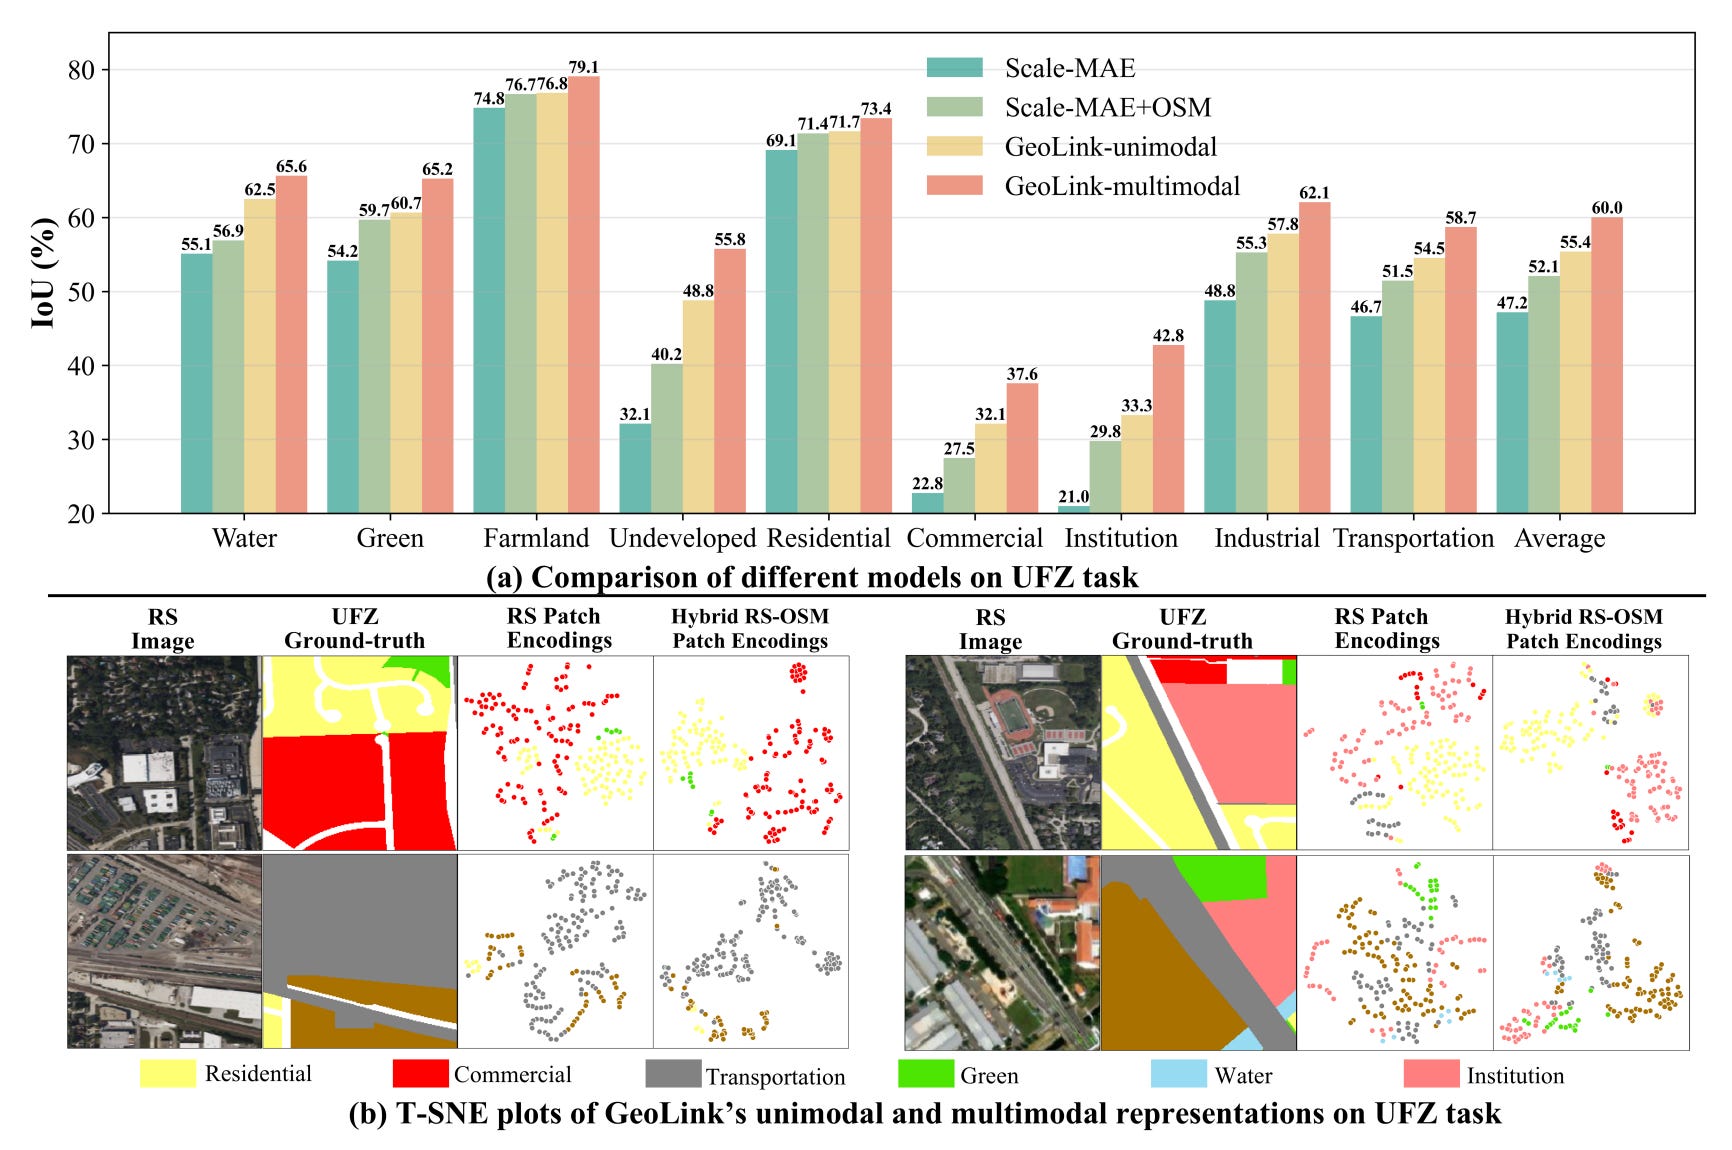
Remote sensing models have been getting pretty good at interpreting satellite imagery, but they’ve mostly ignored a huge source of geographic knowledge: OpenStreetMap. A new study introduces GeoLink, a foundation model that learns from both satellite images and OSM vector data at the same time. The clever bit is how it connects the two. Rather than just converting OSM data into images (the usual approach), GeoLink treats OSM objects (points, lines, and polygons) as nodes in a graph, using spatial relationships like whether features touch or overlap to build connections between them. This lets the model learn geographic context (like road networks, building patterns, and land use types) that satellite images alone struggle to capture.
The training approach is weirdly efficient. GeoLink masks out 75% of image patches during pretraining, processing only the visible ones to speed things up whilst maintaining accuracy. But the real innovation is in how it fuses the two data types. The model uses position-aware attention to match satellite image patches with OSM features based on their geographic coordinates, stopping the model from accidentally linking unrelated elements. This spatial awareness turns out to be super important. When the researchers tested versions without position embeddings, performance on multimodal tasks dropped significantly, whilst unimodal performance stayed roughly the same. The model also converges much faster than existing approaches, needing just 60 training epochs compared to 600 to 800 for comparable models.
The results are pretty solid across the board. On standard satellite image interpretation tasks (like land cover classification and change detection), GeoLink beats six other state-of-the-art models, even when OSM data isn’t used at test time. This suggests the geographic knowledge from OSM genuinely improves how the model understands satellite imagery. But the real gains come in complex multimodal tasks. For urban function zone mapping (distinguishing residential, commercial, and industrial areas), adding OSM data at test time boosts performance substantially, especially for tricky categories like institutional and industrial zones. The model is also pretty robust to incomplete OSM coverage, maintaining strong performance even when 50% of OSM features are randomly removed. All the code is available, so this should be a useful tool for anyone working on urban planning or socioeconomic analysis from satellite data.
You can access the code here.
2. A smarter way to detect informal settlements
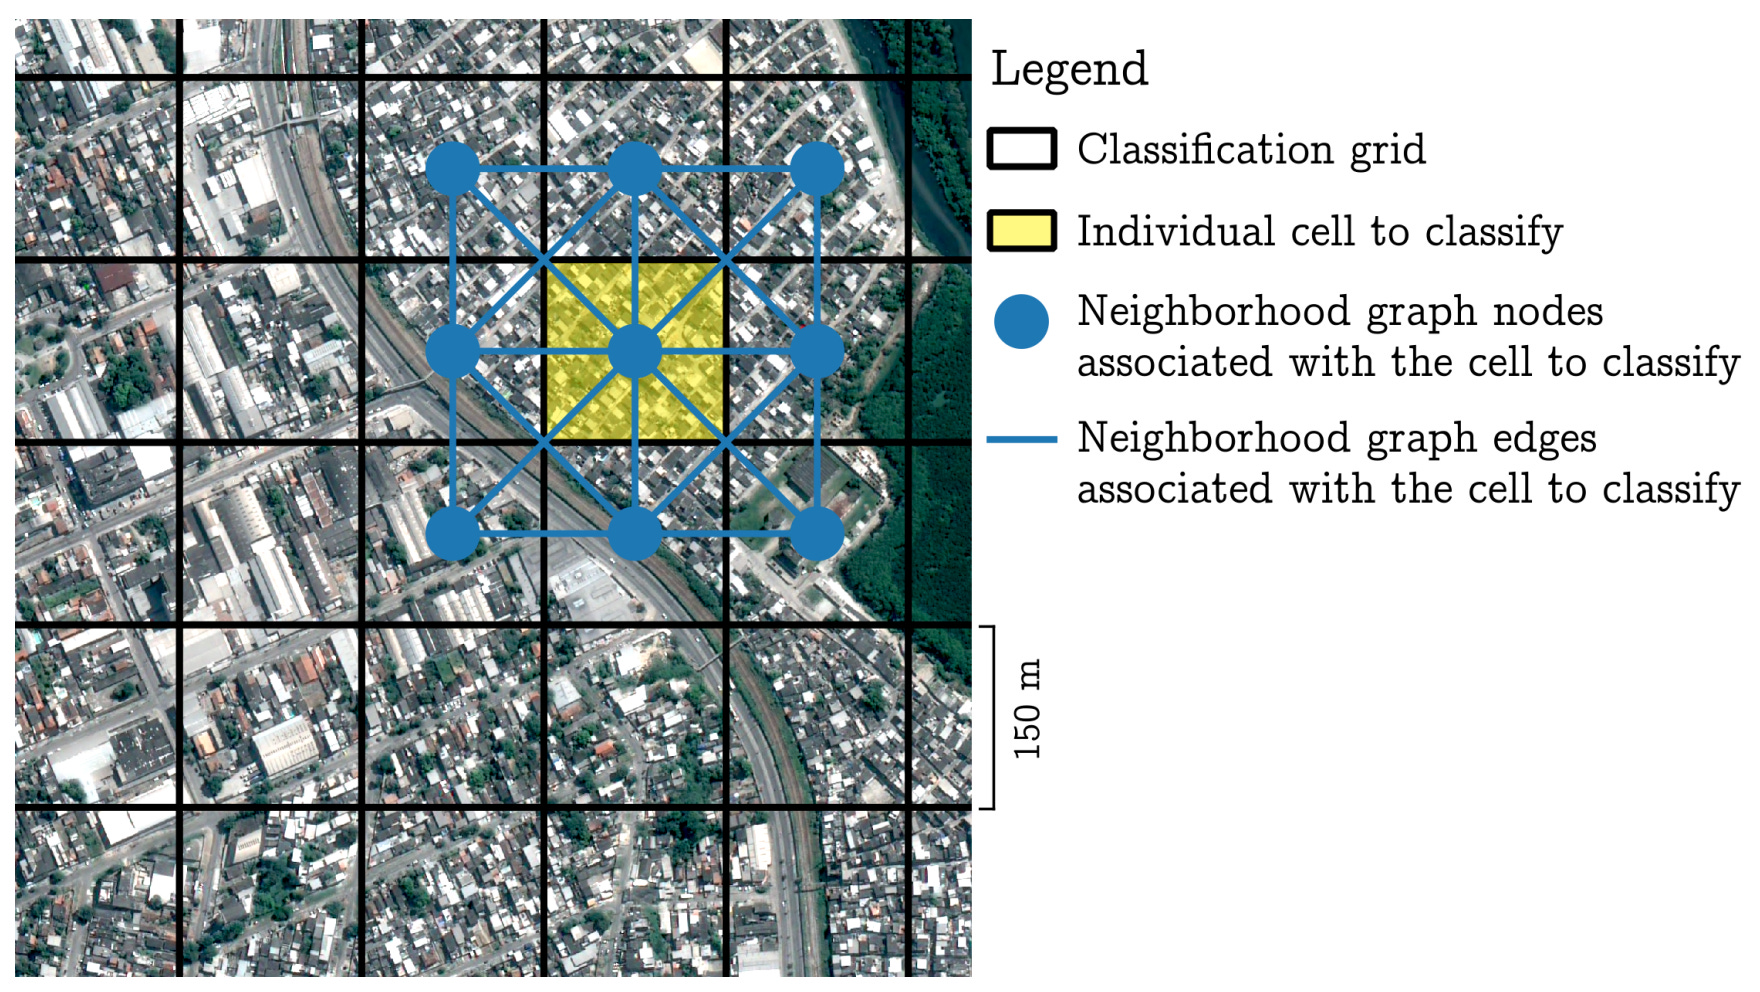
Informal settlements, like Rio de Janeiro’s sprawling favelas, are notoriously hard to map from space because of their dense, irregular layouts. A new study by researchers from IRD and Fiocruz introduces a graph-based deep learning approach that captures these complex neighbourhood patterns better than traditional methods. Instead of classifying each satellite image cell independently, the model links each one to its eight neighbours, forming a small graph that reflects how nearby areas interact. A lightweight Graph Convolutional Network (GCN) then analyses these local structures to decide whether the central cell belongs to an informal settlement.
The team trained and tested their model using Sentinel-2 imagery, elevation data, and OpenStreetMap features across five urban zones of Rio de Janeiro. Spatial cross-validation ensured that the model generalised across very different landscapes (from hillside favelas like Rocinha to low-lying areas near the bay). Compared to standard machine-learning baselines, the graph-based model boosted classification accuracy substantially, improving the Kappa coefficient by up to 17 points over grid-based approaches.
This result shows that spatial relationships matter just as much as pixel-level features when mapping informal settlements. By allowing information to “flow” between neighbouring cells, the GCN captures the urban texture that defines favelas more effectively than conventional grid-based models.
The code is available here.
3. Increasing the resolution of hyperspectral images using AI
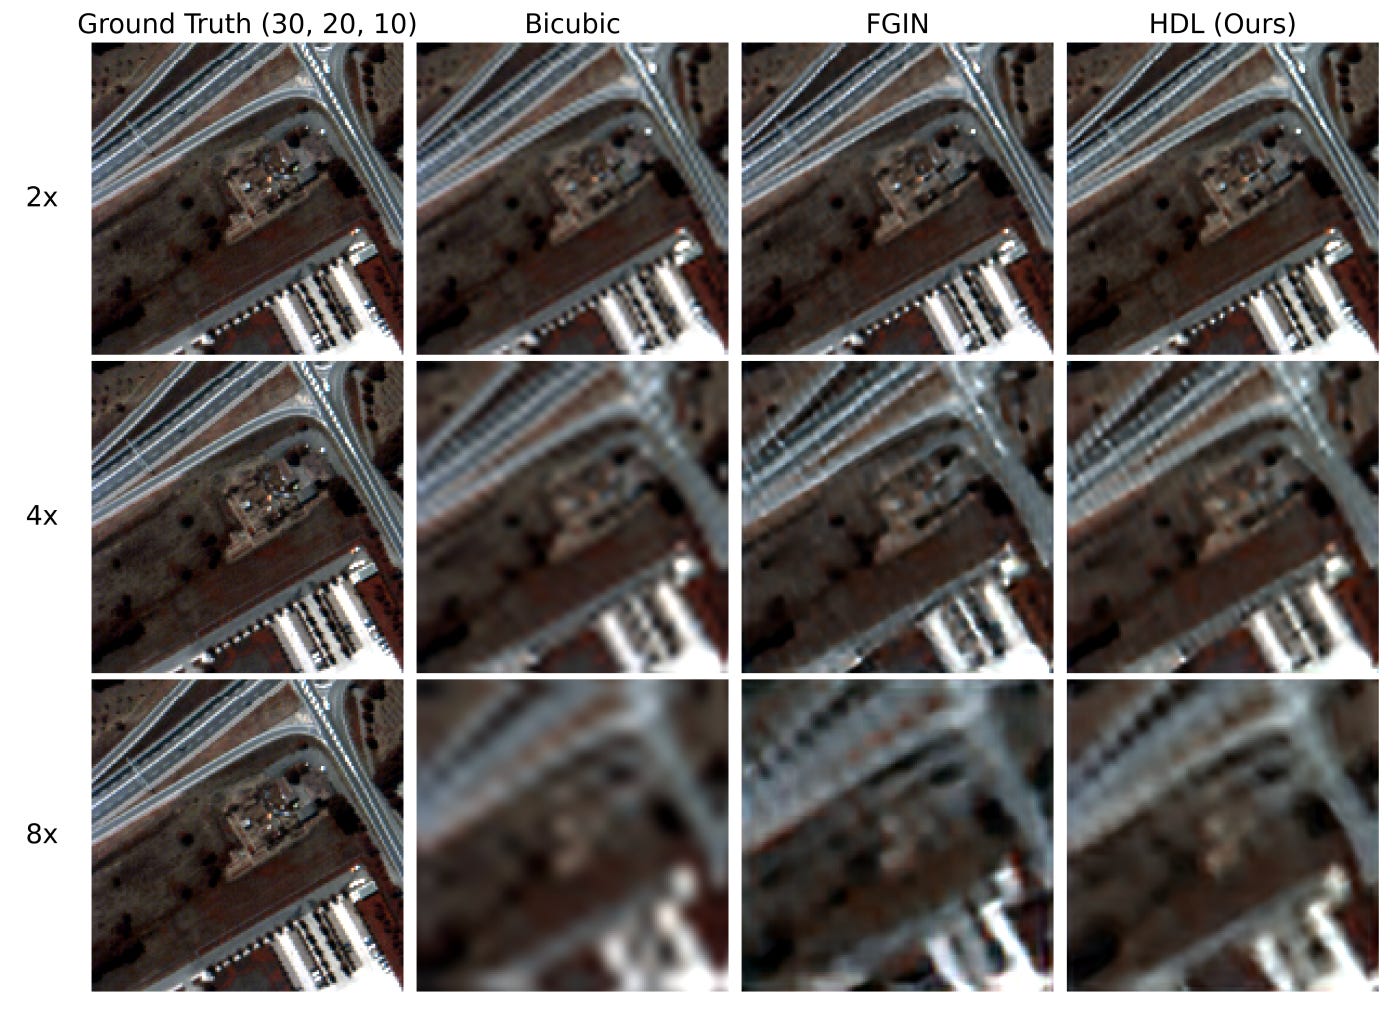
Hyperspectral images capture hundreds of narrow spectral bands, allowing us to detect pretty subtle differences in materials such as crops, minerals, or vegetation health. However, these images often trade spatial detail for spectral richness, meaning they can identify what something is but not precisely where it is. A team from Aalto University has introduced a new “hybrid deep learning” framework to enhance both spectral and spatial quality in a single hyperspectral image. Their approach revolves around a custom module called Spectral–Spatial Unmixing Fusion (SSUF), which merges two key processes: spectral unmixing (understanding the composition of each pixel) and spatial–spectral learning (detecting edges and textures). This integration helps the model sharpen fine spatial details while keeping spectral signatures intact.
The model also introduces a new Spatial–Spectral Gradient Loss function. Unlike standard mean squared error, which mainly focuses on pixel brightness, this loss function looks at how patterns change both across space and across spectral bands. It penalises distortions in shape and colour gradients, helping the model maintain consistency across wavelengths. Essentially, it trains the network to restore the geometry and spectral coherence of real-world surfaces. The architecture itself is lightweight, built from ResNet-style blocks and early spectral–spatial fusion, which keeps it efficient enough for field applications where computing power is limited.
Tests were run on three benchmark hyperspectral datasets: Chikusei (Japan, 128 bands), Pavia Centre (Italy, 102 bands), and Pavia University (Italy, 103 bands). The model took low-resolution inputs that had been artificially downsampled by factors of 2×, 4×, and 8×, and reconstructed them back to their original full resolution. Across all datasets, the hybrid approach produced sharper images and lower spectral distortion scores than state-of-the-art models such as EDSR and CSSFENet, while using only a third of their parameters.
4. Zero tillage really does reduce air pollution
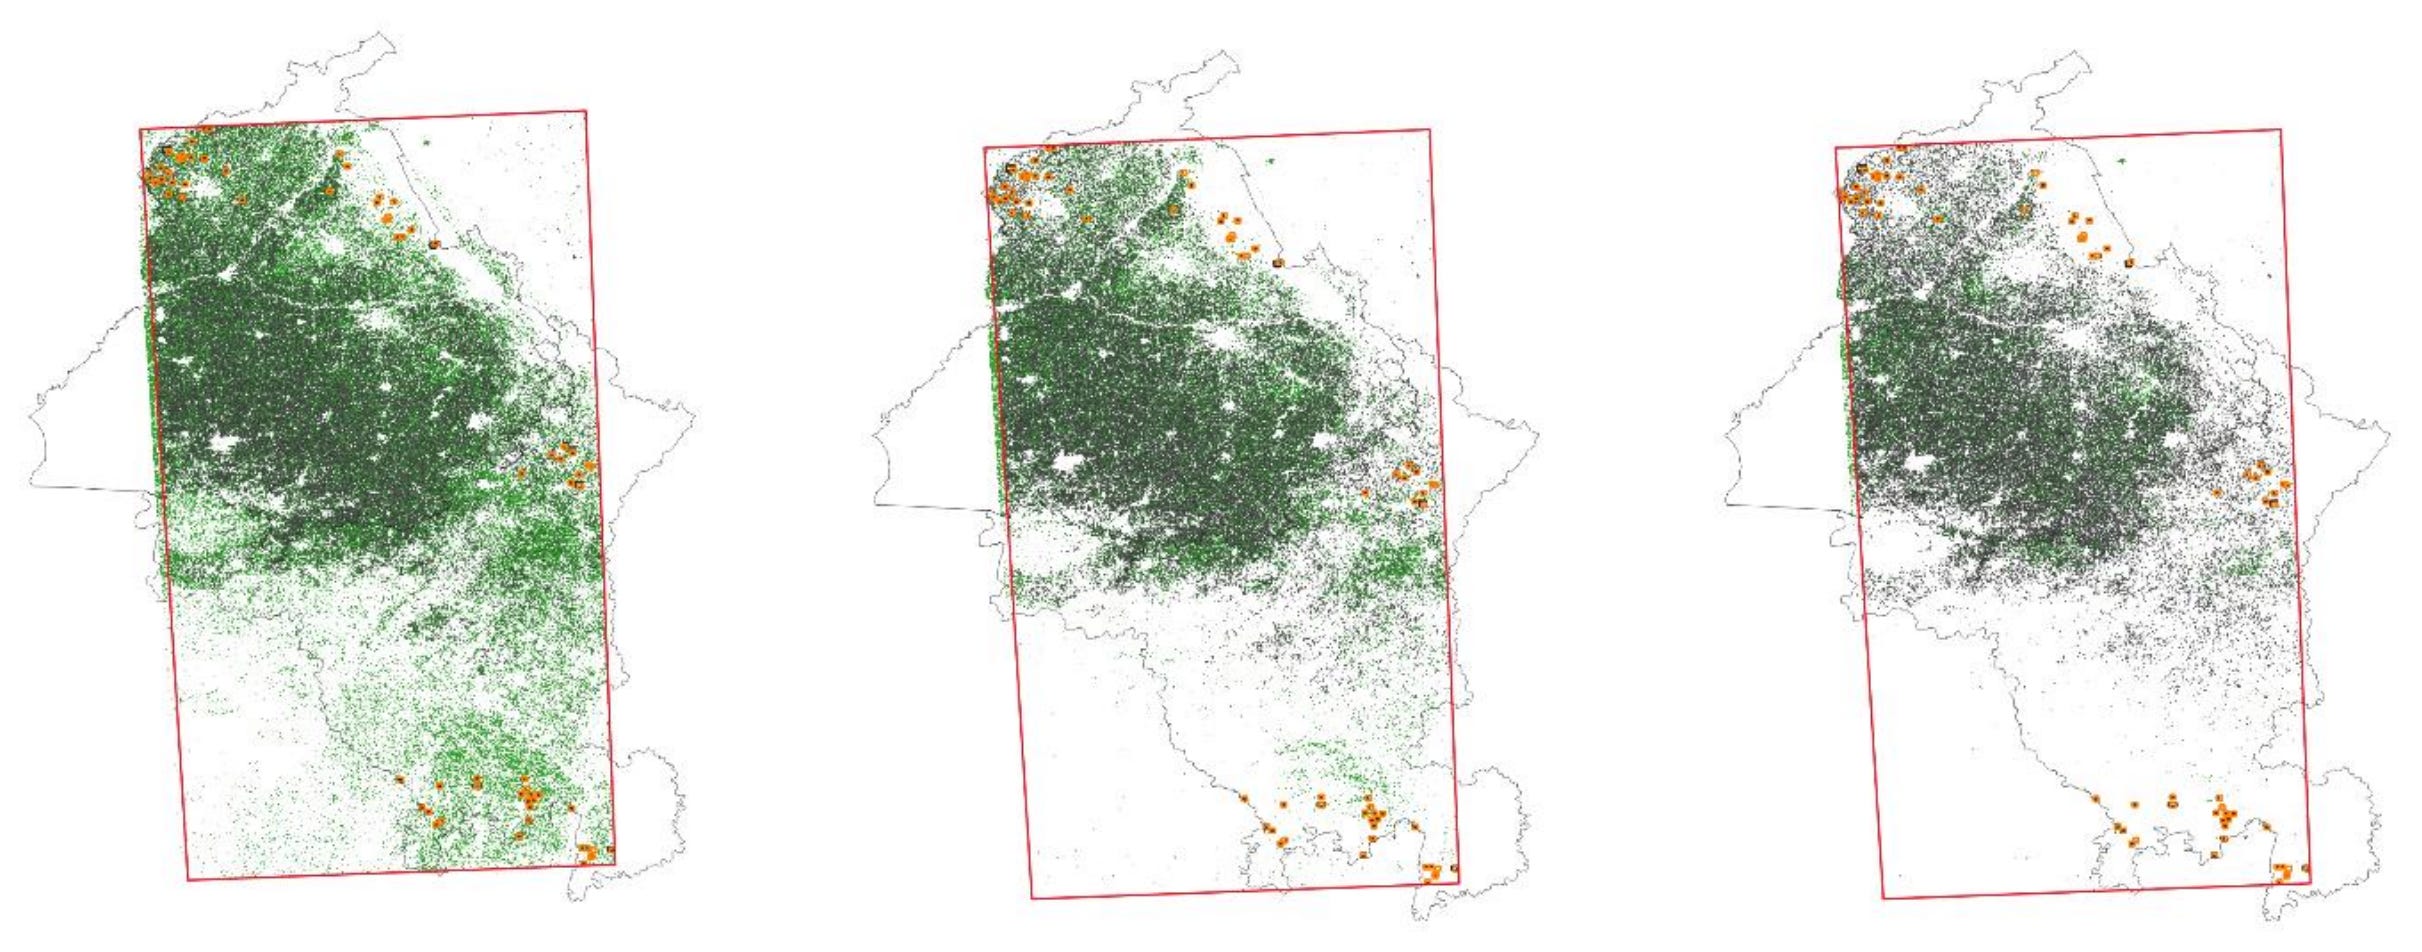
Stubble burning is one of India’s biggest seasonal air pollution sources, especially across Punjab and Haryana. Basically, farmers burn leftover rice straw to quickly clear fields for wheat, releasing thick smoke and particulates. This new study combines high-resolution Sentinel-2 imagery with household surveys from 1,143 farmers to see whether adopting zero tillage (sowing wheat without ploughing) actually reduces burning.
The authors find a strong, consistent link. Plots using zero tillage were 3.9 percentage points less likely to experience residue burning, compared to a baseline of 5.5%. In other words, adopting zero tillage cut burning by around 70% in survey data and by 50% in satellite-based indicators. The results hold even after controlling for farm size, ownership, and local conditions. Farmers using early-sown wheat or owning their plots were also less likely to burn, suggesting that zero tillage complements other sustainable practices.
Another pretty interesting finding was that using plot-level coordinates rather than village-centre proxies greatly improves the accuracy of burn detection.
Geospatial Datasets
1. High-res DSM in non-polar regions
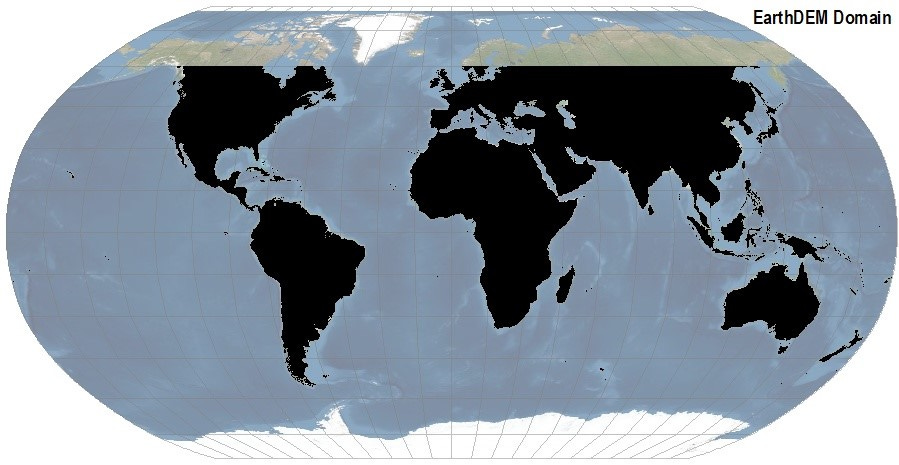
The EarthDEM project delivers 2-metre resolution digital surface models (DSMs) for non-polar regions. It’s built from hundreds of thousands of stereo pairs captured by Maxar’s WorldView and GeoEye satellites since 2009. You can access the data here.
2. Building feature extraction library

ORBITaL-Net is a global training library of ~1.49 million hand-labelled building outlines paired with 128k image chips from very high-resolution Maxar imagery (mostly 2010–2020), spanning 72 countries and a rich mix of urban/rural contexts. You can access the data here.
3. Building footprints and height maps

The Evolving Cityscape dataset provides annual maps of building footprints and heights for 106 Chinese cities from 2018–2023. It provides one of the first high-resolution (≈10 m) longitudinal views of urban structure across China. You can access the data here and the code here.
4. Large-scale remote working dataset

This open dataset captures the experiences of 20,013 remote workers across Europe, collected in mid-2024 as part of the EU-funded R-Map project. It explores how remote and hybrid work influence flexibility, well-being, relocation, and mobility patterns across urban and rural areas, offering detailed socio-economic and spatial insights. You can access the data here.
Other useful bits
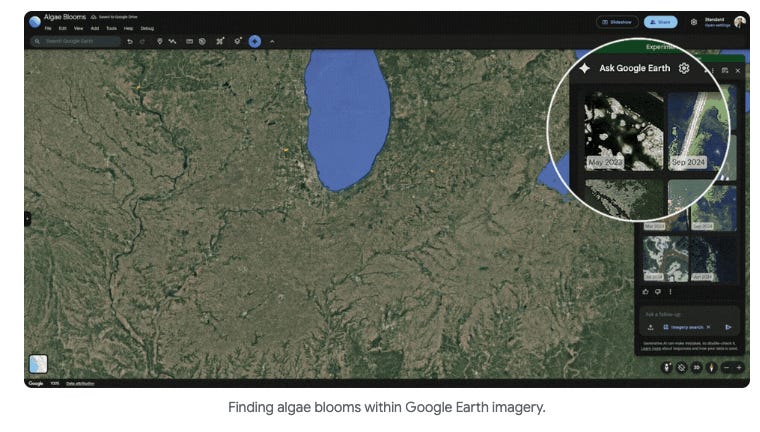
Google Earth AI is expanding its reach, combining decades of Earth modelling with Gemini’s reasoning to help organisations respond to crises and environmental challenges faster. With new tools like Geospatial Reasoning and enhanced Gemini capabilities in Google Earth, users can now connect datasets, detect patterns, and act on insights: from tracking floods and wildfires to predicting disease risks
The World Bank’s new AgriConnect initiative is a major push to transform global agriculture by connecting smallholder farmers to markets, technology, and finance. Already active from Cambodia to Zambia, it’s helping countries modernise farming systems, strengthen infrastructure, and build more resilient rural economies.

A new ESA–World Bank collaboration under the WACA programme is using satellite data and hydrodynamic modelling to trace how plastics move through West Africa’s coastal waters. The study pinpoints pollution hotspots in the Gulf of Guinea and beyond, helping governments target clean-up and prevention efforts
NASA Harvest and the Allen Institute for AI have unveiled Galileo, a powerful open-source AI model that can analyse multiple types of satellite data: from radar to optical imagery, all at once. By revealing both global trends and fine-scale details, Galileo helps scientists monitor crops, floods, wildfires, and climate change more effectively

Jobs
Development Seed is looking for a Cloud Engineer based in an ESA member state.
UNICEF - United Nations Children’s Fund is looking for a Machine Learning Engineering Consultant based in New York, USA
UNLB - United Nations Logistics Base is looking for a Communications and Social Media Specialist based in Brindisi, Italy
ACF International is looking for a GIS Assistant based in Gaza
Just for Fun
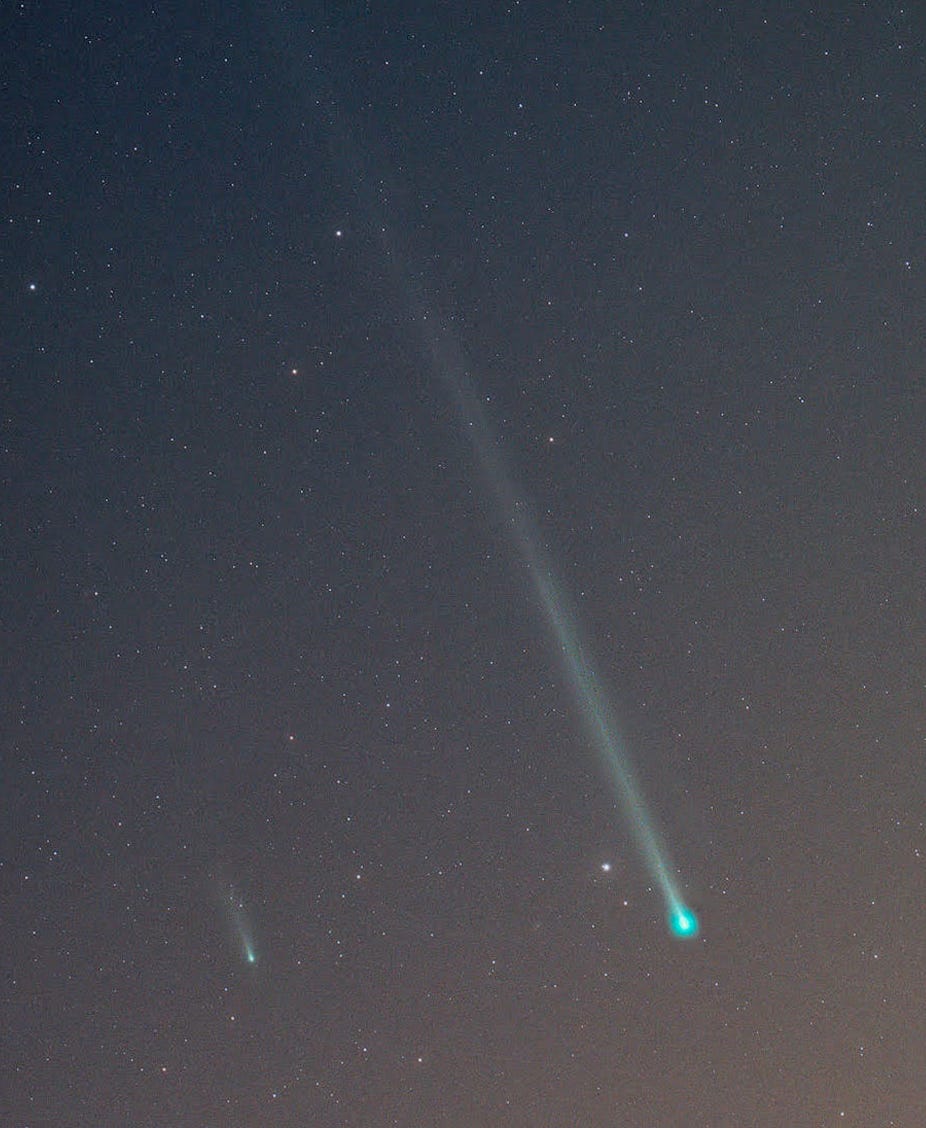
Two comets, ATLAS (left) and SWAN (right), appear to race across the sky in this image from Réunion Island. In reality, they only seem close together by chance. ATLAS is moving toward the Sun and will brighten in early October, while SWAN is heading away and may briefly become visible to the naked eye. Both display greenish comas and ion tails pointing from the Sun.
That’s it for this week.
I’m always keen to hear from you, so please let me know if you have:
new geospatial datasets
newly published papers
geospatial job opportunities
and I’ll do my best to showcase them here.
Yohan