

🌐 Turning satellite images into street view imagery
PLUS: Mapping how forest diversity shapes fire recovery, teaching AI to think geospatially and more.

Hey guys, here’s this week’s edition of the Spatial Edge, a newsletter that’s almost as famous as Moran’s I. The aim is to make you a better geospatial data scientist in less than five minutes a week…
In today’s newsletter:
Satellite to Street: AI turns satellite views into street imagery.
Forest Recovery: Mapping how Europe’s forests bounce back after fires.
Geo Reasoning: Training AI to understand spatial relationships.
Global Boundaries: World Bank releases new administrative maps.
Cooling Data: Mapping residential air conditioning across the U.S.
First up, it was great to meet a bunch of you at the EAEA Conference in Manila last weekend.
It was great fun, and looking forward to next year. I’ll be in Bangkok in a couple of weeks for Clean Air Week, so hit me up if you’re in town.
Research you should know about
1. Turning satellite images into street view imagery
If you’re like me, you’ve spent many long hours dreaming about how you can turn satellite images into street-view imagery.
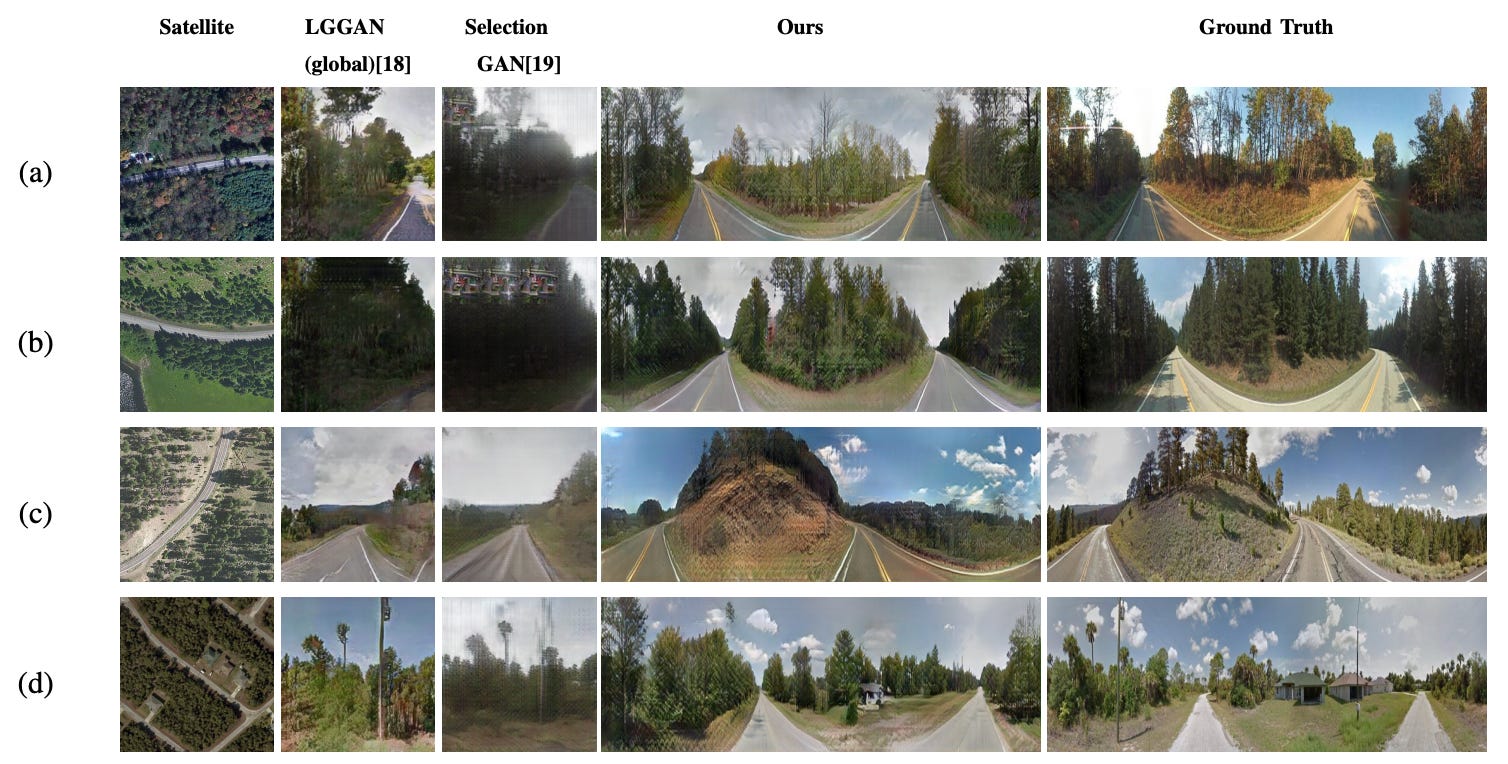
A new study presents an interesting ‘hybrid’ framework that generates realistic street-level images from satellite imagery. The idea is to fill data gaps where ground photos are missing, like remote or unsafe areas. Existing models struggle with this because satellite and street views capture totally different perspectives. The authors combine two leading techniques: diffusion models (like Stable Diffusion) that are good at producing fine visual detail, and Generative Adversarial Networks (GANs) that are good at learning geometric consistency between views.
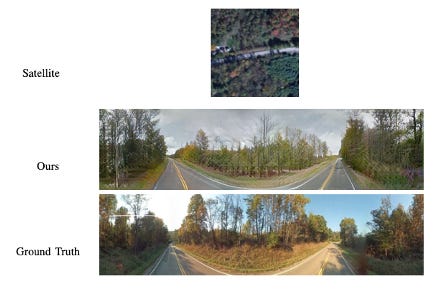
Their system uses a dual-branch setup. One branch employs Stable Diffusion enhanced with ControlNet to create geometrically consistent street scenes from satellite inputs. The other uses PanoGAN, a conditional GAN that directly maps satellite views to panoramic street images. The outputs from both branches are fused, blending the diffusion model’s detailed textures with the GAN’s spatial accuracy. The result is street-view imagery that preserves road layouts, building structures, and even small features like street markings and clouds.
When tested on the Cross-View USA dataset, the hybrid approach clearly outperformed diffusion-only and GAN-only models. It improved image similarity (SSIM) and perceptual quality (FID) while producing realistic 360-degree panoramic views. These results suggest a pretty promising path for building detailed street-view datasets from satellite coverage alone.
I’m not entirely sure what this would be useful for, but it is damn cool.
2. Forest resilience and recovery after European fires
When I lived in the UK several years ago, I’d find it pretty weird that everyone would freak out when in August, there’d be a few days of 30 + degrees in a row. The news headlines would be declaring ‘HEAT WAVE’. And it seemed to happen every year at the same time. And back in Australia, we’d just refer to this as ‘Summer’…
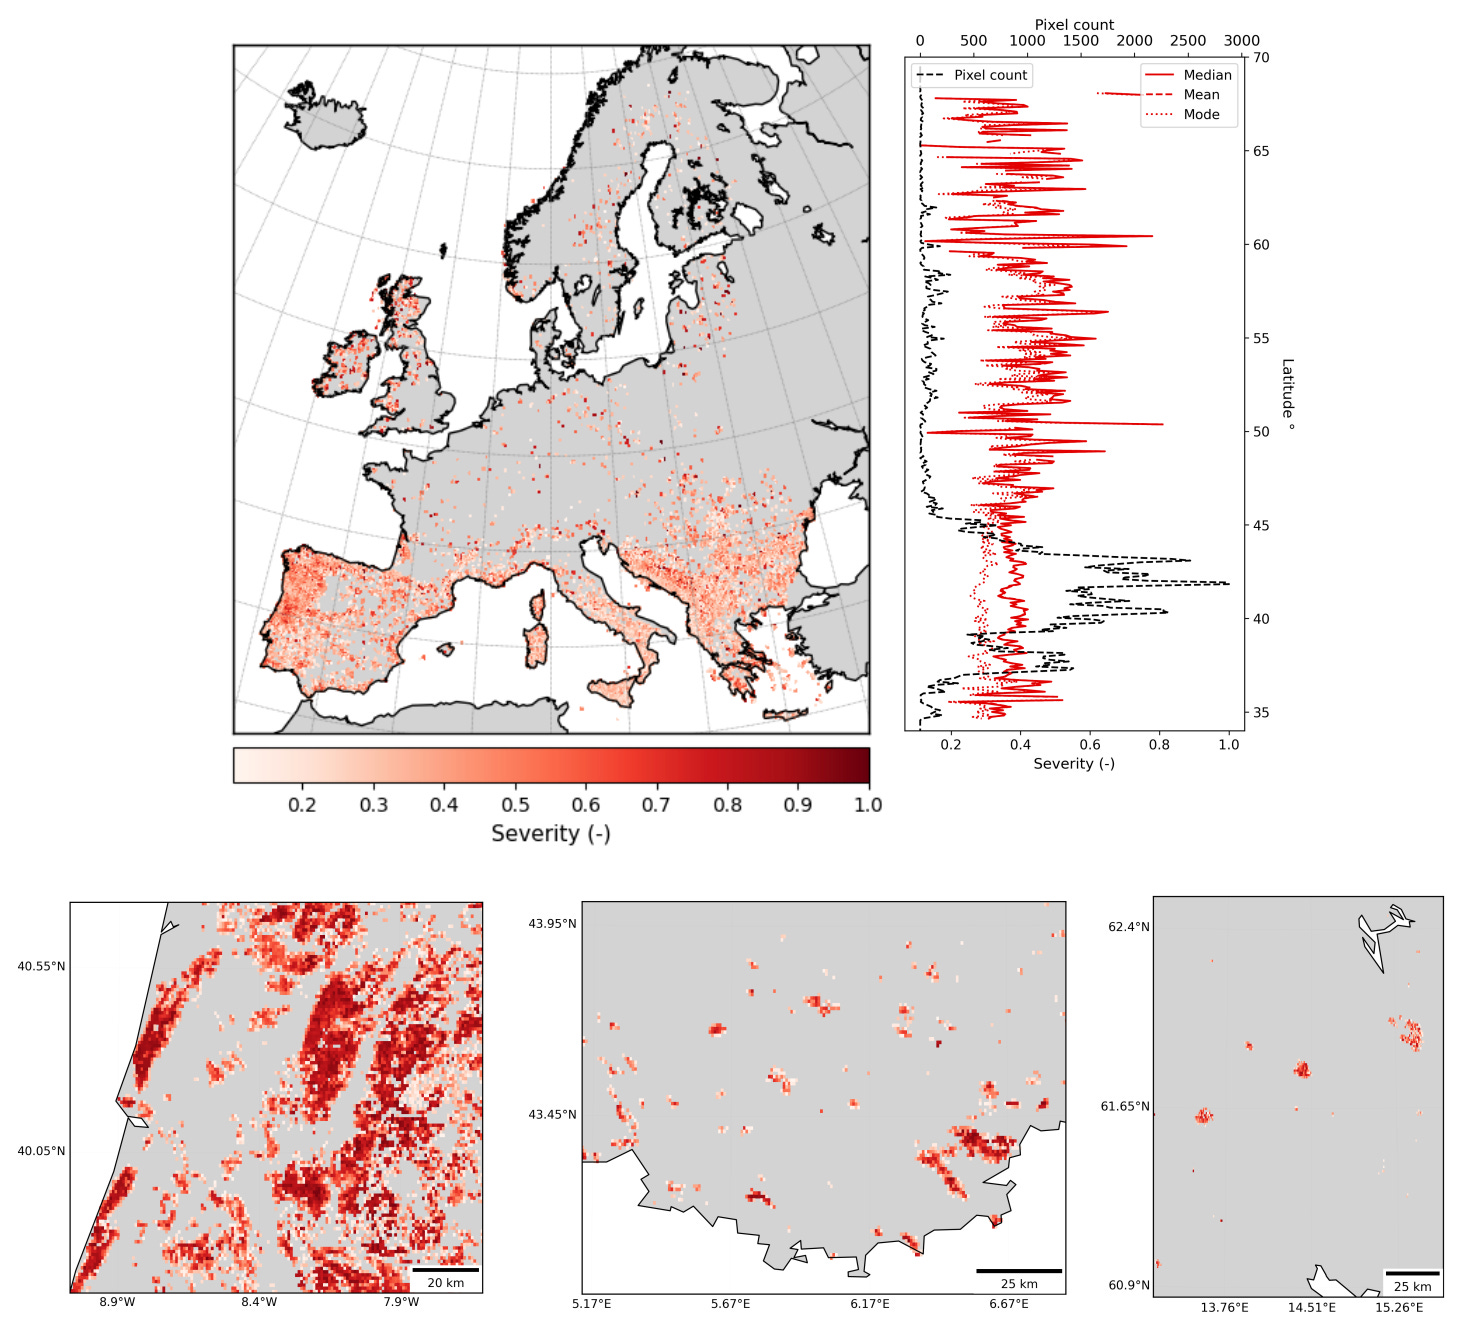
Well these days, it looks like heat is a pretty big issue in Europe. European forests are seeing more fire, and this paper takes a look at how badly areas burn and how fast they recover. It tracks the Leaf Area Index (LAI) from 2001 to 2024 to see how long it takes vegetation to return to pre-fire levels. Unsurprisingly, the Mediterranean regions, especially Portugal, Spain and Greece, face the highest fire frequency and severity. Northern boreal forests, though less often affected, tend to suffer more severe fires and recover much more slowly. Across Europe, about a third of burned areas had not fully recovered by 2024.
Forests with more diverse species and more irregular landscape shapes burned less severely and regrew faster. Coniferous forests and shrublands, both highly flammable and dominated by single species, had the longest recovery times, often over three years. In contrast, broad-leaved and mixed forests rebounded more quickly, helped by species that can resprout or withstand heat better. Agroforestry and vineyard zones also showed relatively mild fire impacts. I guess the idea is that managed, fragmented land systems can buffer against large-scale fires.
Using geographically weighted regression, the authors mapped how species diversity and landscape complexity influence fire outcomes across space. They found that irregular, patchy landscapes interrupt fire spread, while connected, homogenous patches tend to burn more severely. Species diversity, meanwhile, was the main driver of faster recovery. In short, Europe’s most resilient forests are both biologically rich and spatially complex, which strengthens the case for promoting diversity and heterogeneity in future forest management.
3. Teaching AI to think geospatially
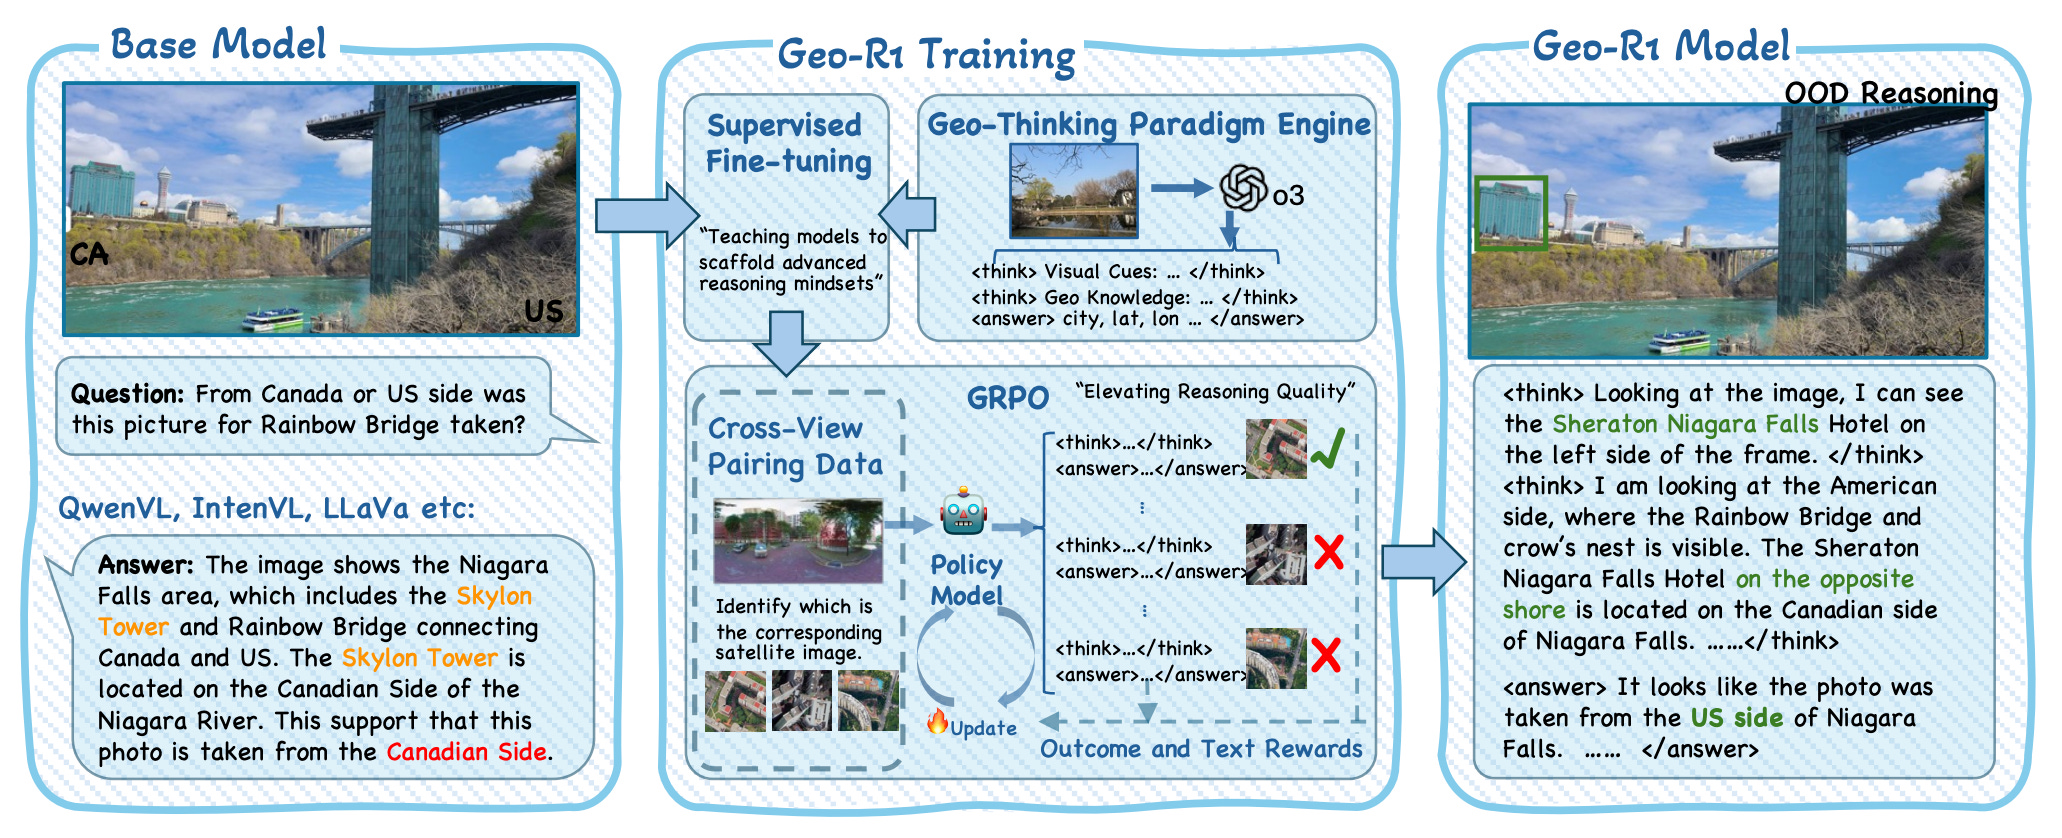
Large vision–language models are getting better at recognising what’s in an image, but not where. This preprint introduces Geo-R1, a post-training framework that teaches models to reason about space: connecting aerial views, ground photos, and place knowledge. Instead of just fine-tuning on labelled data, Geo-R1 uses a two-step recipe:
a “scaffolding” stage that feeds the model synthetic chain-of-thought examples describing geospatial cues (like architecture, vegetation, or solar angles), and
an “elevating” stage where the model improves itself through reinforcement learning.
The reward is correctly matching street-level panoramas to the right satellite view.
This cross-view task turns out to be a powerful teacher. After reinforcement learning, Geo-R1 boosts geolocation accuracy from 19% to over 82%, showing it’s actually reasoning across perspectives instead of memorising scenes. On the GeoChain benchmark, it also outperforms all open-source models on 13 diverse reasoning tasks and generalises to unseen datasets like IMAGEO and RSTeller. Importantly, it does this without forgetting its original multimodal skills (like OCR and visual Q&A).
The key insight is that adding structured “geo-thinking” and verifiable spatial rewards can transform a generic VLM into something that truly understands place. It’s a step toward reasoning-first geospatial AI; one that can describe not just what it sees, but where and why.
Geospatial Datasets
1. Global administrative boundaries dataset

The World Bank’s new global administrative boundaries dataset provides high-res, standardised maps of countries, provinces, and districts (ADM0–ADM2) for use across research, policy, and development operations. Produced under the Space2Stats programme, it replaces older, inconsistent boundary sources with a regularly updated, version-controlled global layer that meets WBG cartographic standards.
2. Surface water transitions dataset

Surface Water Transitions provides the first global, annual map of when surface water permanently advanced or receded, using 30 m Landsat time-series in Google Earth Engine from 1984 to 2022. Each pixel records the year of change (1984–2022), helping researchers and water managers link shifts in rivers, lakes, reservoirs and coasts to potential drivers rather than seasonal noise. You can access the interactive map here, and the data and code here.
3. Residential air conditioning maps

I have been known to pontificate about air conditioning from time to time. So I was pretty interested to see this comprehensive dataset, which maps residential air conditioning (AC) prevalence across the continental United States, covering over 103 million housing units with four AC types. You can access the data here and the code here.
4. Reforestation efforts dataset

This dataset provides the first global integrity-assessed record of reforestation efforts, combining 1.29 million planting sites from 45,000 projects over 33 years. It evaluates each project’s Location Data Integrity Score (LDIS) to flag spatial inaccuracies, with nearly 79% of sites failing at least one integrity check. You can access the data here and the code here.
Other useful bits
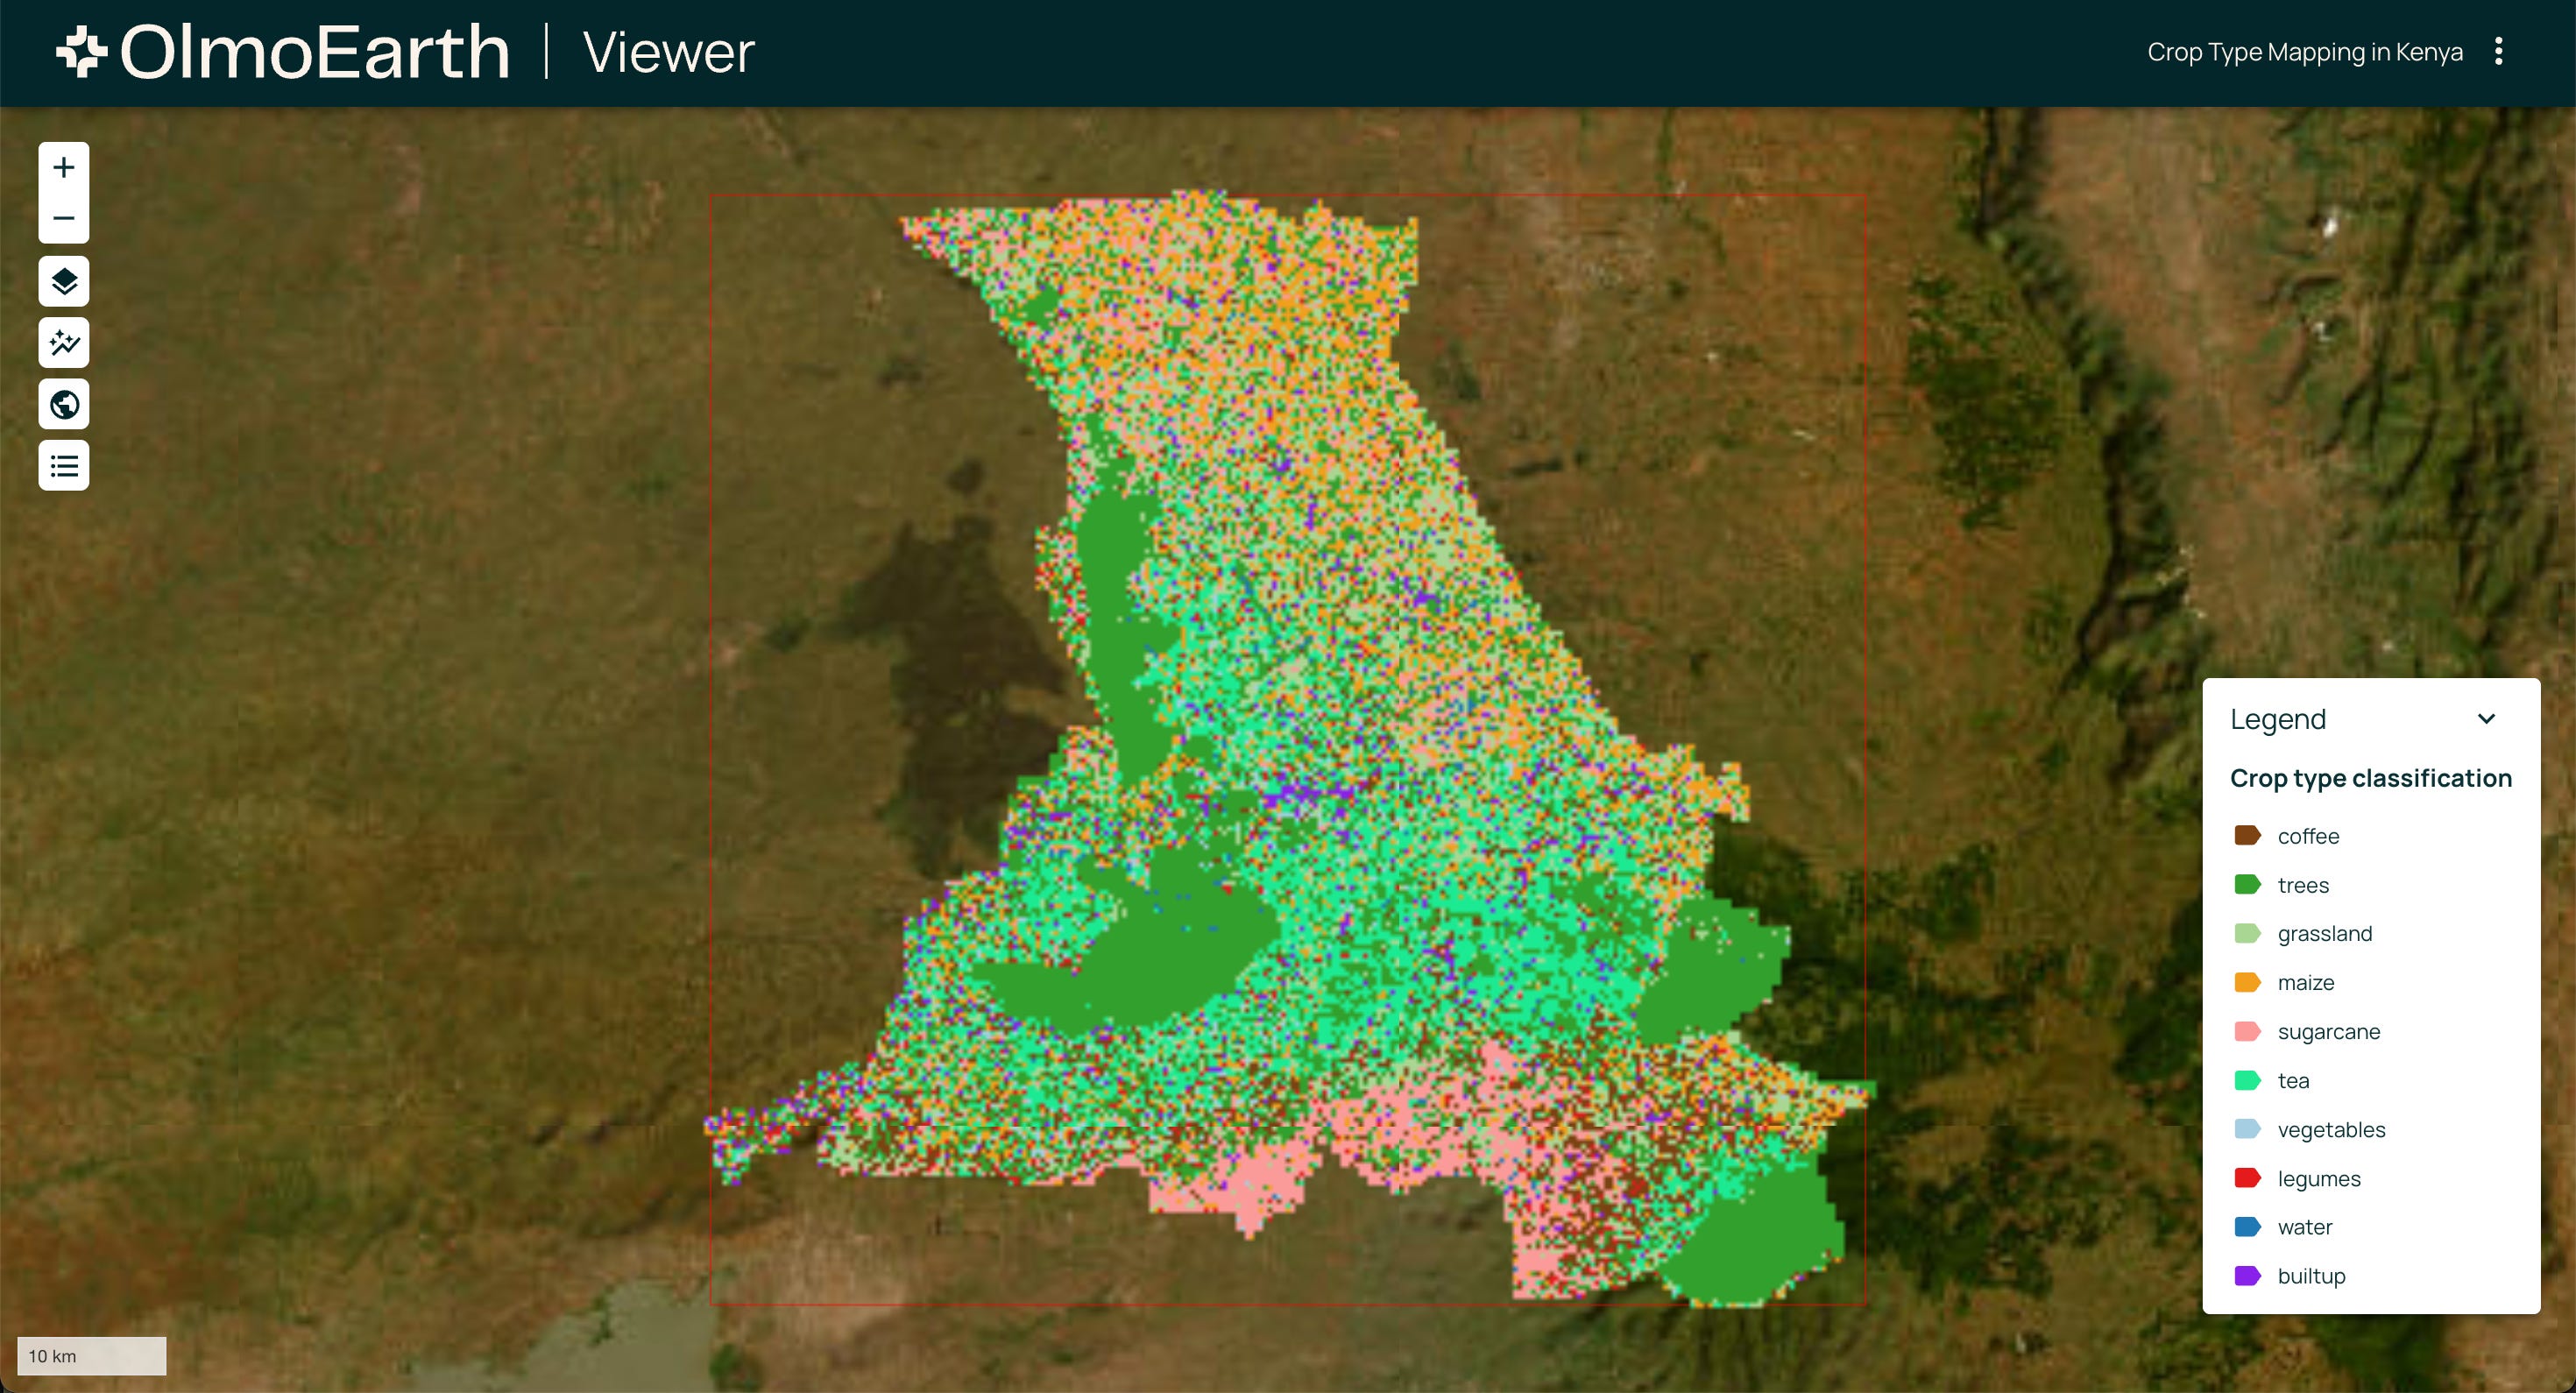
OlmoEarth is a new end-to-end AI platform that transforms raw Earth data into fast, actionable insights, no technical expertise required. Open and efficient, it enables users to analyse and deploy high-performance models in hours, helping organisations keep pace with a rapidly changing planet.
Researchers from ETH Zürich and IBM Research have unveiled TerraCodec, a deep learning approach that compresses satellite imagery up to 100× without losing key information. By using temporal transformers to spot slow Earth changes, it keeps image quality high and even enables zero-shot cloud removal.

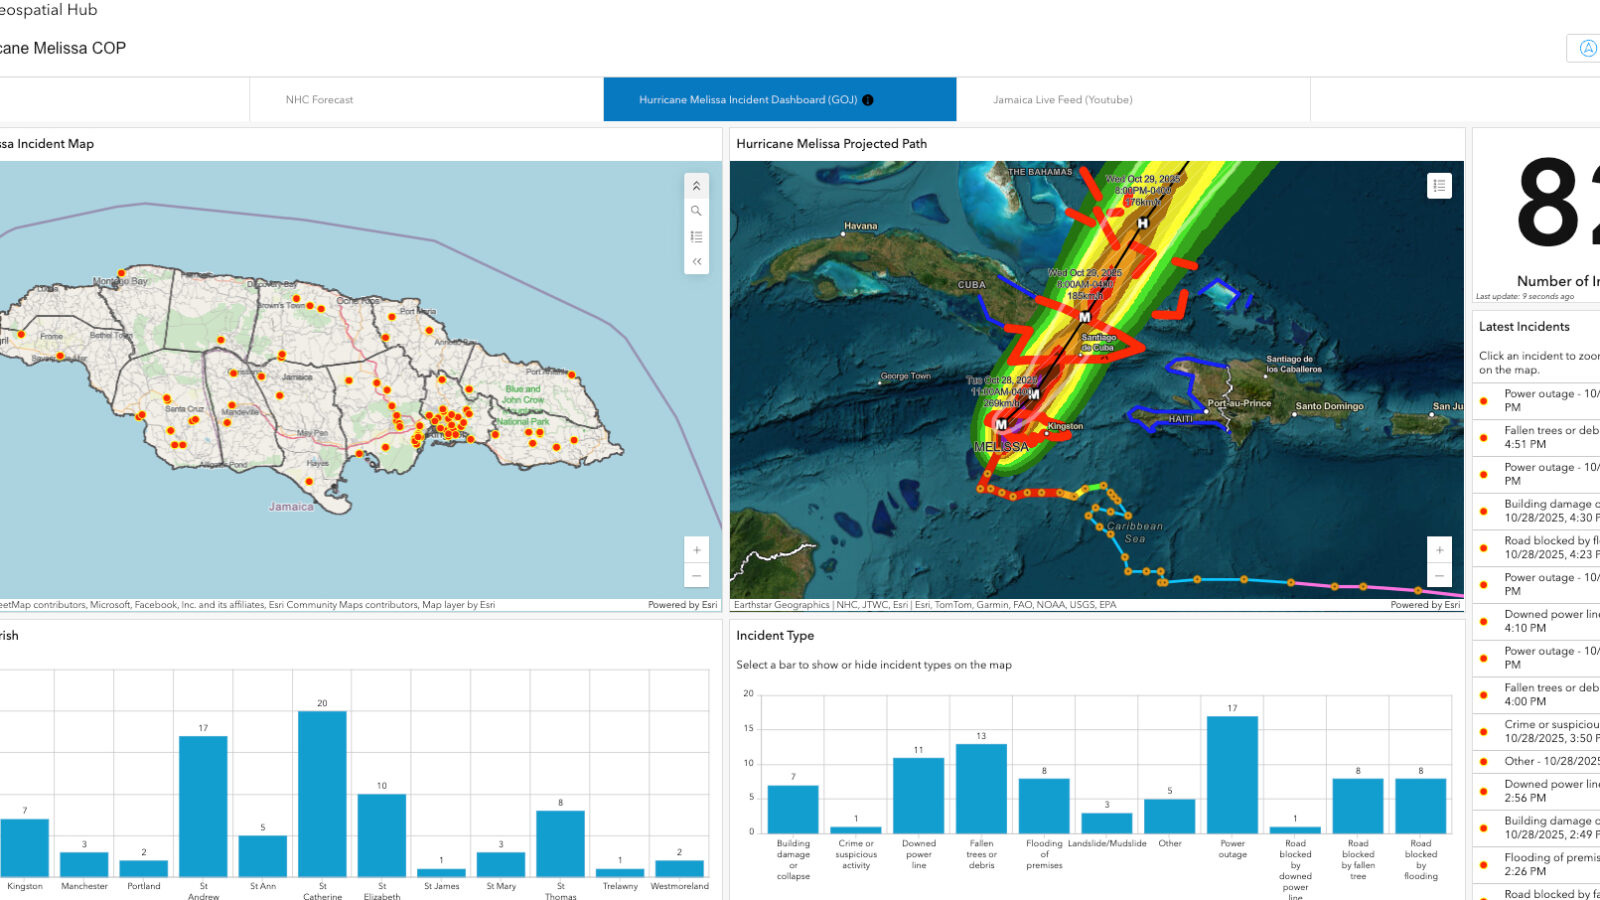
During Hurricane Melissa, disaster relief group Team Rubicon used an ArcGIS-powered Geospatial Hub to combine live hurricane data, damage reports, and crowdsourced updates into one real-time platform. The tool helped volunteers navigate blocked roads, prioritise aid delivery, and reach affected Jamaican communities faster.
Jobs
UNEP is looking for a Lead Developer based in Paris who will work on their IMEO Eye on Methane data platform.
UNICEF is looking for a Geospatial Analyst (Consultant) for equity analysis automation based in the US.
Conservation International is looking for a Geospatial Analyst Intern based in Singapore.
Just for Fun

During its close flyby of Jupiter’s moon Io on 30 December 2023, NASA’s Juno spacecraft captured some of the clearest and most detailed images ever taken of Io’s volcanic surface.
That’s it for this week.
I’m always keen to hear from you, so please let me know if you have:
new geospatial datasets
newly published papers
geospatial job opportunities
and I’ll do my best to showcase them here.
Yohan