

🌐 Turns out DHS surveys aren’t always accurate
PLUS: new job vacancy in my team, generating DEMs from optical images, and more.


Hey guys, here’s this week’s edition of the Spatial Edge — a weekly round-up of geospatial news. The aim is to make you a better geospatial data scientist in less than five minutes a week. As most of you tell me, you come for the geospatial dad jokes, you stay for the updates. Ok... No one actually told me that. Onwards…
In today’s newsletter:
DHS Issues: Survey errors mapped across Africa
TerraMind Launch: Multimodal model breaks EO silos
EarthView Dataset: 15 terapixels for self-supervised learning
Massive Embeddings: 40B Sentinel vectors now public
Grid Release: High-res EO embeddings hit CREODIAS
First up, my team at the Asian Development Bank is looking for a data scientist. You’ll need a PhD in economics, data science, AI or a related discipline plus six years of experience. If this is in your AOI, you should definitely apply. The downside, of course, is that you’ll be in my team, where the geospatial puns are always in high resolution.
(Caveat: I’m not involved in the recruitment process.)
Research you should know about
1. Turns out DHS surveys aren’t always accurate

I’m sure many of you reading this have used the Demographic and Health Surveys (RIP😢). They are (were?) an important tool for research and policymaking in lower-income countries. They help track everything from child nutrition to contraceptive use, and are often used to guide major health and development programmes.
But a new study in Nature Communications shows that the quality of this data varies a lot. This is both between countries, and within them. And in many places, the variation doesn’t seem to be random.
The researchers examined DHS data quality in 35 African countries, across three indicators:
Incomplete age: Missing birth month or year for women aged 15–49
Age heaping: Too many reported ages ending in 0 or 5 (a sign of estimation)
Flagged HAZ: Implausible height-for-age scores in children
How did they do this?
To estimate where data quality is poor across Africa, the researchers started by identifying these three problems. But since these surveys only cover selected areas, they used geospatial modelling to fill in the gaps.
To do this, they combined the observed survey errors with data on geography, population density, malaria prevalence, rugged terrain, and night-time lights (used as a proxy for remoteness and infrastructure).
Then, using a Bayesian spatial model, they predicted where else similar problems were likely to occur. The result was a set of detailed, 5×5 km maps showing the likely distribution of data quality issues across all 35 countries. In short, if a remote area shares key features with places known to have poor data, the model flags it too.
Big differences even within countries
Take Nigeria. Age heaping rates ranged from 25% in Lagos to over 60% in parts of Katsina State. In Chad, the share of women with incomplete age data varied from 8% to over 90%. Even within a single country, some areas have high-quality data, while others have widespread gaps and errors.
And it’s not just random noise. The worst data quality ( I guess unsurprisingly) consistently appeared in remote regions. This pattern suggests that remoteness comes at a cost.
Large sample sizes don’t really solve the problem if the data itself has systematic errors. For example, if many people report rounded ages or do not give a birth date, this can distort key health measures like child stunting or the age which women first give birth. These kinds of problems can’t be fixed just by using statistical adjustments or more data.

In any case, the authors published their district-level estimates online, so those of us using these datasets can explore which areas are most affected:
👉 https://apps.worldpop.org/SSA/data_quality/
2. TerraMind, an any-to-any multimodal EO model

These days, geospatial foundation models are sort of everywhere. In fact, I’ve covered some of the ongoing debates about their utility over here.
Now we have TerraMind, which was put together by a team from IBM Research, ETH Zurich, Forschungszentrum Julich, ESA Phi Lab, NASA Impact and the University of Iceland. Terramind is an attempt to create a general-purpose geospatial model that works across different types of satellite data.
While many foundation models focus on either optical or radar imagery, TerraMind works with both. It uses Sentinel-2, Sentinel-1, digital elevation models (DEMs), NDVI, land cover maps, and more. Using this dataset, it builds a shared representation space that allows users to move from one type of data to another. For example, you can generate land cover from radar or derive DEMs from optical imagery.
First, the basics: how TerraMind works
TerraMind processes different types of satellite data by turning each into tokens using specialised encoders. A diffusion-based decoder then learns to reconstruct the original data, allowing the model to work across data types. The team found that simpler compression methods made training more stable but didn’t improve output quality. Handling complex inputs like multi-band imagery required careful tuning, and larger vocabularies sometimes made results worse. Attempts to smooth training blurred important details, so they were avoided.
Does it perform well?
TerraMind performs pretty well on standard image reconstruction tests.
For SAR, which is notoriously noisy and difficult to model, the tokenisers achieved pretty high accuracy. Structural similarity (SSIM) scores were above 0.94 and peak signal-to-noise ratio (PSNR) values exceeded 56 decibels. For optical Sentinel-2 data, SSIM was over 0.92 and PSNR reached above 66 decibels. These are strong results that suggest the model can create realistic and detailed reconstructions.
What can you do with TerraMind?
The main feature is the ability to translate between satellite data types. The paper includes examples such as turning a DEM, which shows elevation, into a plausible land cover map that includes rivers and agricultural areas. This is synthetic data, but it could be useful in areas where certain types of satellite information are missing.
They also tested the model’s performance in few-shot classification tasks using the EuroSAT and METER-ML datasets. TerraMindv1-B outperformed other foundation models, such as Prithvi and CLIP, and even surpassed task-specific U-Nets in some segmentation benchmarks. It did especially well in cases that used multiple types of input data.
Some caveats
Despite its strengths, TerraMind isn’t perfect. In tasks such as generating flood maps, it still performs below specialist models like Google’s Dynamic World. In crop mapping, adding synthetic land cover data helped slightly, but the improvement was small (only about one percentage point in mean IoU).
Anyway, like all foundation models, its real-world usefulness depends on the specific task. For now, it is an impressive technical development and one to watch closely.
Geospatial Datasets
1. Remote sensing data for self-supervision

EarthView is a massive remote sensing dataset built for self-supervised learning in Earth monitoring tasks. It contains 15 terapixels of imagery from 2017–2022, combining data from NEON, Sentinel, and newly released 1 m-resolution Satellogic images. You can access the dataset here.
2. DeCUR & MMEarth Sentinel embedding datasets
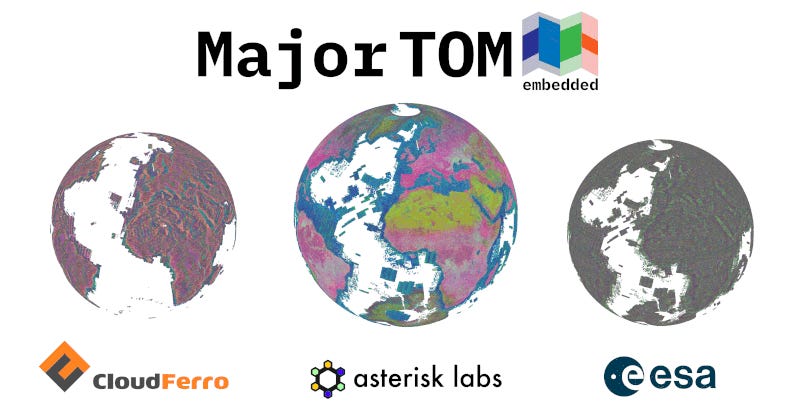
Nearly 40 billion new embeddings from Copernicus data have been released under the Major TOM project. This update includes:
DeCUR Sentinel-2 L1C embeddings capturing joint MSI-SAR representations
DeCUR Sentinel-1 RTC embeddings with vivid PCA visualisations
MMEarth Sentinel-2 L2A dense embeddings (133×133 vectors per grid), released at 13×13 on Hugging Face due to storage limits
Full-resolution versions are hosted on CREODIAS.
Other useful bits
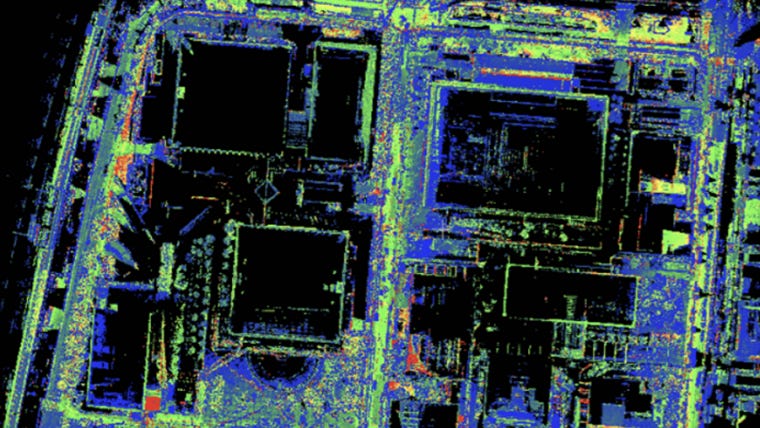
Kudan and NTT InfraNet trialled a new 3D mapping method using SLAM and infra data to generate high-precision maps in dense urban areas where GNSS fails. The method, when tested in Tokyo, achieved high accuracy with low-cost sensors. This will enable smart city applications like autonomous navigation, infrastructure monitoring, and creating digital twins.
UP42 has teamed up with Maxar to bring high-res satellite tasking straight to its platform. This makes it easier to access near real-time imagery.
Geospatial tech is transforming Zimbabwe’s farming sector, thanks to FAO’s EOSTAT project backed by the AfDB. It’s helping improve yields, cut inefficiencies, and train the next generation in digital agriculture.
Burning satellites could soon pose a real climate risk. A new study finds that by 2040, aluminium from thousands of re-entering satellites may cause upper-atmosphere warming, ozone depletion, and disrupted wind patterns. How fun…
Jobs
Yale Inclusion Economics is looking for a remote Geospatial Data Scientist Consultant to work on enhancing the reach and impact of flood early-warning systems in low-income contexts.
Mapbox is looking for a US-based Software Development Engineer III for Map Data Publication.
UNESCO is looking for a Consultant under their Natural Sciences Sector (SC) in Paris who will support analytical and capacity-building activities on mangrove and glacier conservation.
Chemonics is looking for a remote GIS Senior Specialist to work on their Famine Early Warning Systems Network (FEWS NET).
Just for Fun
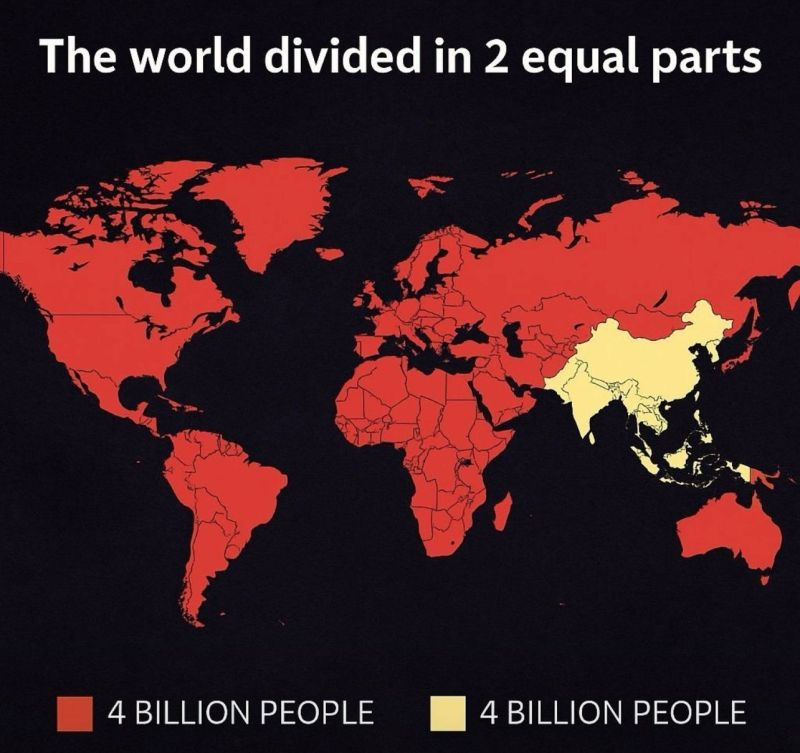
As you all know, I’m a sucker for maps, and I thought this was a good one…
That’s it for this week.
I’m always keen to hear from you, so please let me know if you have:
new geospatial datasets
newly published papers
geospatial job opportunities
and I’ll do my best to showcase them here.
Yohan