Tutorial: How to increase the resolution of nightlights data
The exact steps and codebase to increase nightlights from ~500m to ~30m resolution
It’s been a while since I’ve done a tutorial on here.
The last time I did it was in December, which featured a guide on how to download and process NASA’s Black Marble data.
However, in January, one of my posts on X got a bit of attention. It discussed how NASA was able to increase the resolution of nightlights data from ~500m to ~30m resolution. They used this data to then measure the impact of the massive earthquake that hit Turkey and Syria in February 2023:
Given the interest in this methodology, I thought it would be helpful to provide you with the exact steps and codebase required to downscale nightlights data for any place in the world.
Background
One of the biggest limitations with nightlights data is their resolution.
As I’ve discussed previously, the highest resolution (freely-available) nightlights data has a resolution of 500m. This is substantially lower than free sources of daytime satellite images (e.g. Sentinel-2, which is ~10m; and Landsat 8, which is ~30m).
However, researchers from NASA published a study that manages to increase the resolution of nightlights to roughly ~30m resolution.
I’ll be breaking down this methodology, and providing (my version) of the codebase in R, which achieves the same results.
Downscaling nightlights data has remarkable use cases. It allows us to quantify the impact of events such as natural disasters, or wars on electricity consumption and economic activity at incredibly granular levels.
For instance, check out this change in luminosity in Kyiv from January 2022 to November 2022:
And here, we can see the impact of the Earthquake on Turkey’s electricity consumption in February 2023:
Now let’s take a look at how we can re-create this for ourselves.
Step 1: Pre-requisites
There are a few pre-requisites before we get started.
You need the following data for your given region of interest:
Black Marble nightlights data
A polygon (for a region of interest)
OpenStreetMap data
Landsat or Sentinel daytime satellite data
Here is a link to the tutorial on how to download Black Marble data. You can find a polygon for an area of interest from the GADM website, while OpenStreetMap data can be easily downloaded from GeoFabrik. Meanwhile, the daytime satellite data can be obtained from Google Earth Engine.
Step 2: Loading packages
We’re only using three R packages for this:
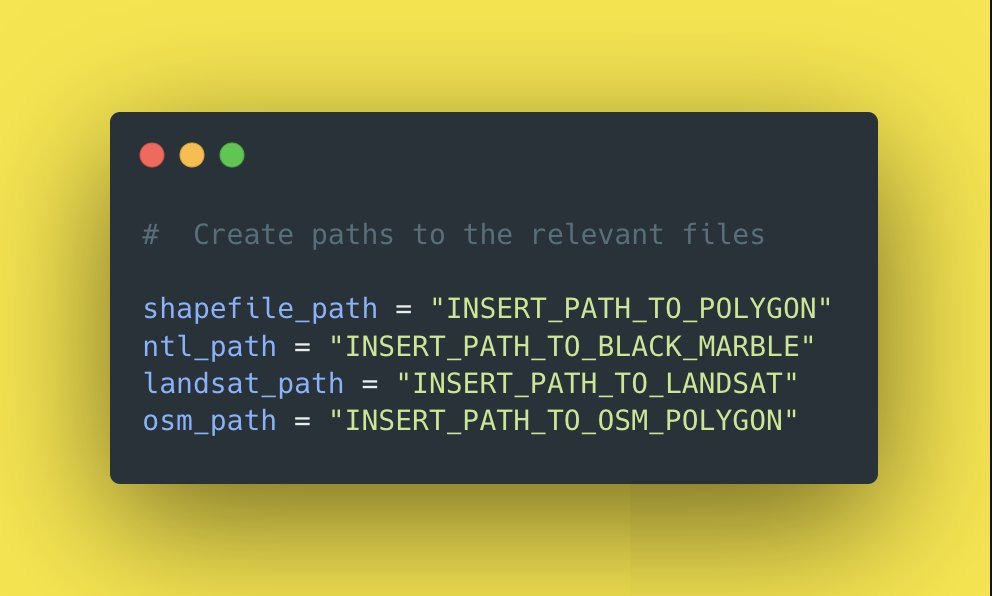
Step 3: Set paths
Set up the paths to the relevant files you’re using:
Step 4: Function to load and transform polygons
Create this function to load and transform the polygons for your area of interest:
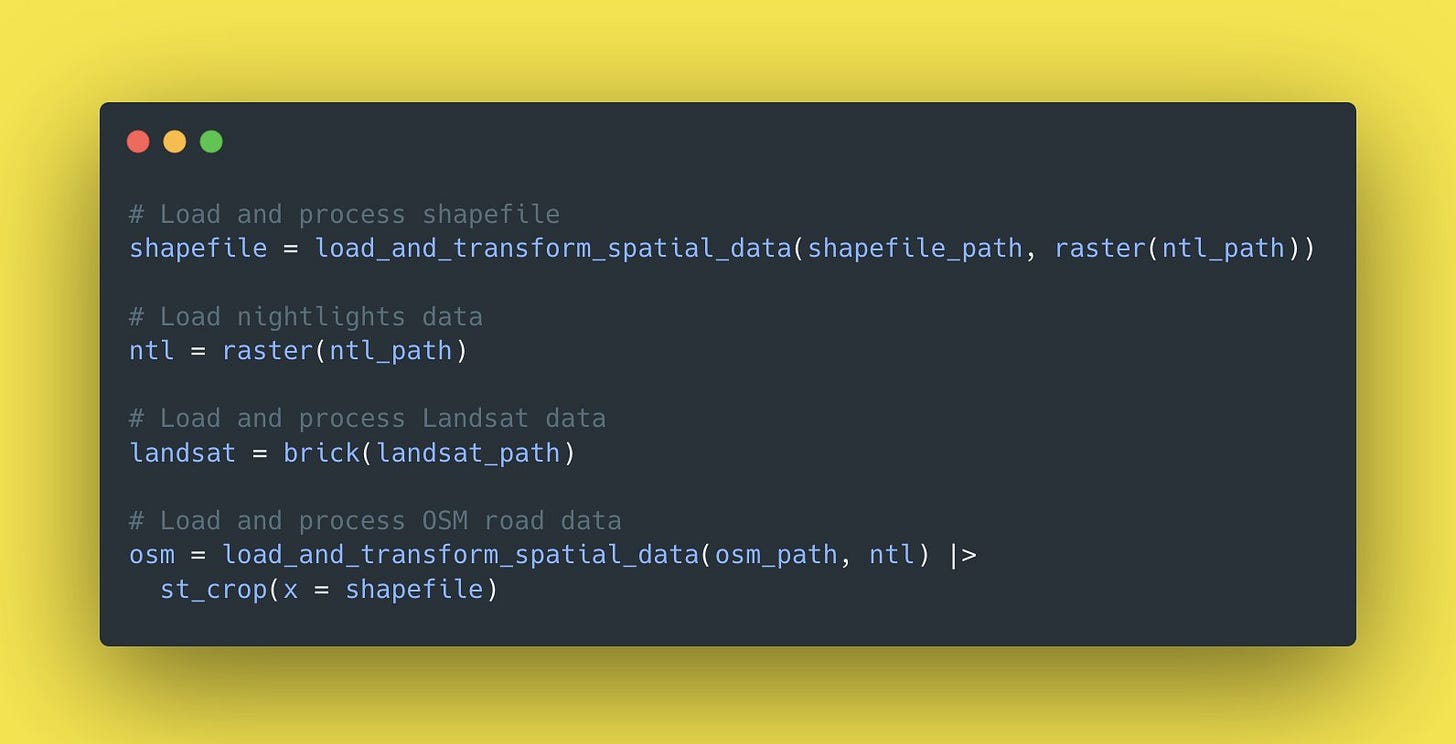
Step 5: Load the data
Now you can load all of the data as follows:
Step 6: Resampling
Resample the nightlights data to Landsat (I use bilinear resampling here):
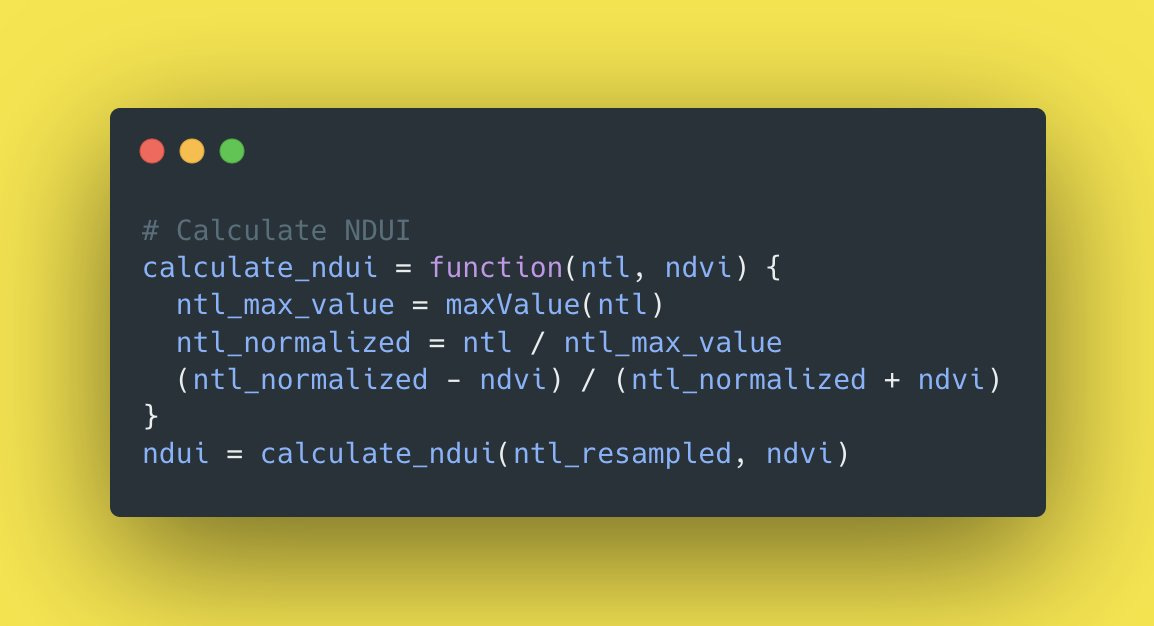
Step 7: Calculate NDUI
Calculate a normalized difference urban index as follows:
Step 8: Drop water bodies
Step 9: Generate results
Put everything together and generate the downscaled nightlights image:
Step 10: Export results
Export the results as a raster:
And there you have it.
Using this method you’ll be able to massively increase the resolution of nightlights:


Thanks for the tutorial, that was super interesting. Quick question though: what do you use the OSM data for? Perhaps I overlooked something, but I can’t figure it out right now. Thanks!