🌐 Using ChatGPT to predict poverty from satellites
PLUS: downscaling temperature data, and examining the best locations for wind and solar energy.
Hey guys, here’s this week’s edition of the Spatial Edge — a weekly round-up of geospatial news that you can digest quicker than you understand the logic behind OpenAI’s naming conventions (‘o3-mini-high’? Seriously?). In any case, the aim is to make you a better geospatial data scientist in less than 5 minutes a week.
In today’s newsletter:
Poverty Prediction: using ChatGPT to predict poverty from satellites.
Renewable Energy: Mapping the best locations for wind and solar farms.
Land Surface Temperature Downscaling: Deep learning fills gaps in data.
Forest Regrowth: New dataset tracks global forest recovery since 1985.
SAR Mapping: OpenEarthMap-SAR offers high-res global land cover data.
1. Using ChatGPT to predict poverty from space
A new paper from researchers at Halmstad University and Lund University explores how a vision-enabled ChatGPT prototype can analyse satellite images to rank locations by poverty levels.
The team used two side-by-side images from Google Maps and a prompt that asked ChatGPT which village looked wealthier. These pairwise votes were then turned into an overall ranking. They compared this rank to a survey-based wealth index in Tanzania from the Demographic and Health Surveys dataset. They used a prompt focused on roads, building materials, and visible amenities.
They found that ChatGPT outperformed human-expert evaluations. However, it fell short of a trained convolutional neural network that uses satellite data in a standard supervised learning pipeline.
The bottom line is that the paper highlights ChatGPT’s ability to interpret unfamiliar images without additional fine-tuning. My guess is we’re going to increasingly see LLMs being used to label satellite images (which can be an absolute pain).
However, this obviously needs to be done with care. LLMs are generally non-deterministic. This means that if you feed it the same data several times, the generated labels could be different each time. But then again, this could be something we experience with humans as well (since ranking images is inherently subjective).
2. Identifying promising locations for wind and solar energy
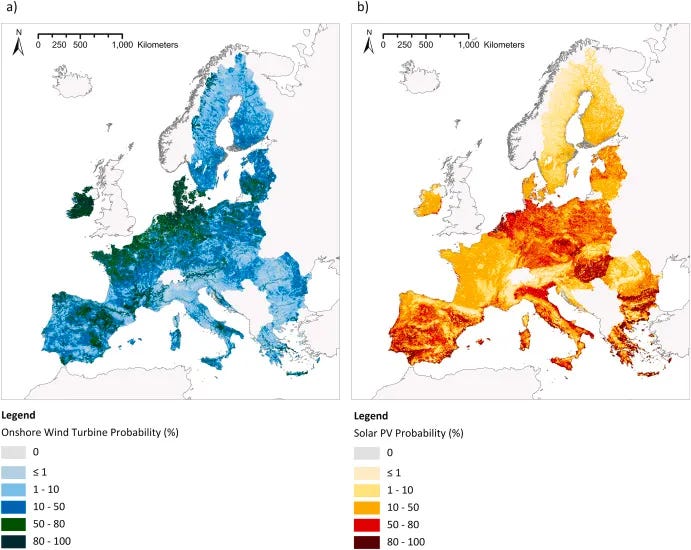
A recent study in Renewable and Sustainable Energy Review looks at renewable energy installations across the European Union, by compiling a geospatial dataset of onshore wind turbines and industrial solar panels.
Let’s start with wind energy.
Germany, Spain, and France have the most wind turbines overall. However, when looking at turbine density per area, the Netherlands and Denmark stand out. The study used logistic regression to look at a bunch of factors like:
weather
land shape
infrastructure
policy measures &
socioeconomic conditions
To no one’s surprise, it found that wind speed is the key factor driving wind turbine placements. However, the best locations for this appeared to be in farmlands.
For solar energy, the research shows that solar radiation, government subsidies, and flat terrain strongly predict where solar installations happen. Once again, farmland is the top choice. Some variables (like net-zero targets, fossil fuel subsidies, and distance to roads) sometimes affect outcomes in unexpected ways. This is because real-world decisions are influenced by different interacting factors. E.g., a variable such as a net-zero target may indicate future ambitions rather than current deployment levels, while process barriers might emerge as a consequence of increased project activity rather than acting as a deterrent
From these models, the authors created maps showing where future wind and solar projects might grow. For wind, Northern Europe (especially Denmark, Ireland, the Netherlands, and northern France) appears most promising. For solar, areas in the Netherlands, Germany, and the low-lying regions of Italy and southern Spain seem to have the best potential.
Overall, the study confirms that farmland plays a major role in renewable energy development while protected lands are generally avoided.
3. Downscaling land surface data
The folks at GeoVille have published a study in Remote Sensing that uses deep learning to generate high-resolution land surface temperature (LST) datasets, which ultimately helps researchers and planners tackle climate adaptation challenges.
LST is pretty important for understanding topics like urban heat islands, local climate patterns, and global warming impacts. However, as with most optical imagery, cloud cover and sensor limitations creates issues.
The researchers trained a convolutional neural network to estimate LST at ~70 m resolution using a bunch of data sources:
Land cover maps,
ECOSTRESS thermal data,
Sentinel-2 imagery (visible and infrared),
meteorological variables (e.g. air temperature and wind speed).
The model analyses small 5 × 5 pixel patches to learn patterns between land cover, weather conditions, and surface heat, allowing it to reconstruct missing temperature data. It achieves at least 80% of predictions within ±3 °C.
This approach has some immediate applications in urban planning, climate mitigation, and heat monitoring. Local governments can use the detailed LST maps to pinpoint heat-prone areas, design cooling strategies, and integrate temperature data into broader environmental planning. Future improvements include refining the method for higher resolutions, more diverse landscapes, and better seasonal accuracy.
You can access the data used in the study here.
Geospatial datasets
1. Forest regrowth dataset
For all you forest regrowth folks, you’re in luck. This newly released forest regrowth dataset spans 1985–2020 and tracks changes in forest height, biomass, leaf area, and light capture across global deforestation hotspots. You can access the data here and the code here.
2. OpenEarthMap SAR dataset
OpenEarthMap-SAR is a new dataset from RIKEN and the University of Tokyo focusing on global land cover mapping with Synthetic Aperture Radar (SAR). It encompasses 1.5 million segments from over 5,000 aerial and satellite images across 35 locations, each at a 1024×1024 resolution and equipped with detailed land cover labels. You can access the dataset here.
3. Geospatial football dataset
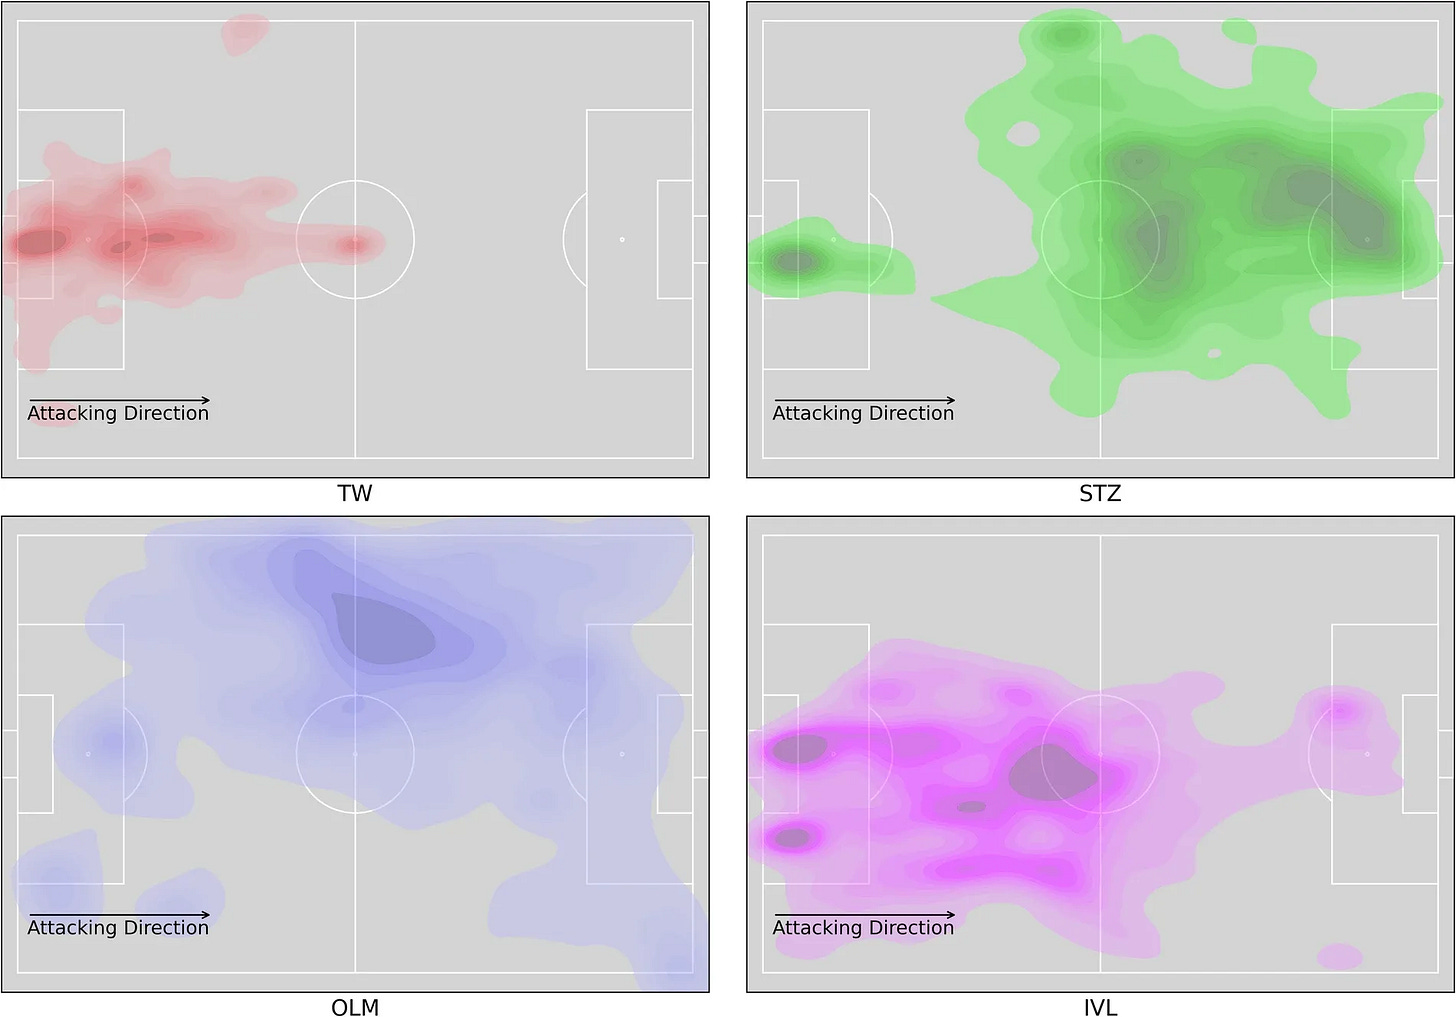
This one’s new: this German Bundesliga dataset provides in-depth match information for seven football games. It includes info on team details, crowd size, weather conditions, event data (passes, shots), and positional data for players and the ball. The bottom line is this is a perfect resource for all of you writing your (very specific) geospatial PhDs on seven Bundesliga games. You can access the data here and the code here.
Other useful bits
NASA is wrapping up its final ASTER data processing campaign, making the entire archive freely available to users worldwide. This means easier access to decades of satellite images for research, mapping, and environmental monitoring.
Google’s Photorealistic 3D Maps Challenge challenged developers to create immersive experiences using 3D Maps. The winning entries, built with the Maps JavaScript API, showcase creativity and innovation in visualising real-world locations.
Climate Engine has launched new customisable climate reports for any location in the continental U.S. These reports provide insights on vegetation trends, drought conditions, and climate variability. Watch the demo here.
According to the OpenAQ 2024 report, nearly 45% of nations either don’t monitor air quality or collect data without sharing it, while 28% only provide partial data. This means nearly three-quarters of the world’s population lacks access to crucial air quality information, posing a serious public health risk.
UNDP India, GIZ, and Lacuna Fund have launched the Hyperlocal Pollution Mapping Hackathon to tackle air pollution in Patna and Gurugram. Participants will use near-real-time data to develop solutions in predictive air quality modelling, source attribution, and impact assessment.
Jobs
The UK Office for National Statistics is looking for a (1) Principal Geospatial Technologist and a (2) Senior Geospatial Technologist to join their geospatial technology team.
The University of Stavanger is offering 2 fully funded PhD fellowships in Innovation and Regional Studies, focusing on the Nordic battery value chain and its impact on geopolitics, sustainability, and industry—1 for qualitative/mixed methods and 1 for quantitative research.
The World Bank is looking for an Economist - Digital Development Effectiveness in the US.
Just for fun
A new year and a new opportunity to see some eclipses…
That’s it for this week.
I’m always keen to hear from you, so please let me know if you have:
new geospatial datasets
newly published papers
geospatial job opportunities
and I’ll do my best to showcase them here.


Looking forward to seeing more datasets pop up—will keep an eye out for interesting ones to share! 🚀