

🌐 We're losing rivers
PLUS: making radar images colourful, foundation models for estimating carbon stocks, and more.


Hey guys, here’s this week’s edition of the Spatial Edge — a weekly round-up of geospatial news. I’m told we’re Substack’s safe space for map fetishists. In any case, the aim is to make you a better geospatial data scientist in less than five minutes a week.
In today’s newsletter:
Water Crisis: Brazil’s rivers are drying from below.
SAR to RGB: Diffusion models attempt radar image conversion.
Eco Mapping: Foundation model estimates vegetation and carbon stocks.
Crop Data: Subnational crop stats from 33 African countries.
AI Model: COP-GEN-Beta enables cross-sensor image generation.
Research you should know about
1. A hidden water crisis beneath Brazil’s rivers

If, unlike me, you follow water resource issues, then you'll know that rivers and groundwater (i.e. water stored underground in cracks and spaces between soil, sand and rocks) aren't separate. They constantly exchange water beneath the surface. But a new study in Nature Communications shows a worrying trend in Brazil: many rivers are now draining water into the ground instead of being refilled by it. This basically means the rivers are shrinking, which could cause serious problems for people and the environment.
Researchers examined groundwater levels from nearly 18,000 wells across Brazil and found that 55% of them have water tables below nearby rivers. This means the rivers are likely losing water into the ground. It's especially severe in drylands and heavily farmed regions, where groundwater pumping for agriculture is a pretty common practice.
Take the São Francisco River Basin, an important area for Brazilian agriculture and hydropower. Over 60% of rivers there appear to be losing water to the ground. In the Verde Grande Basin, another agriculturally intensive region, that figure jumps to around 74%.
So what's driving this?
This is mainly driven by farmers in dry areas pumping lots of water from underground to irrigate crops. This lowers the water levels in the ground. As a result, instead of underground water flowing into rivers like it used to, the flow is now reversed, with rivers losing water to refill the drained underground stores. This makes the rivers drier over time.
Why should we care?
This signals a bunch of future problems. Reduced streamflow can harm ecosystems, limit water available for agriculture and cities, and worsen drought impacts. It’s also a bit of a problem for water quality, as surface pollutants could seep more easily into underground drinking water sources.
Interestingly, the study also tested whether remote sensing could identify these river-aquifer exchanges without extensive ground measurements. They found that satellite-based methods were surprisingly effective at pinpointing areas most at risk.
The takeaway:
Managing groundwater and rivers separately won't cut it anymore. We need to treat surface water and groundwater as one interconnected system to avoid deeper water crises.
2. Can Diffusion Models turn radar images into realistic optical imagery?

As we’ve covered previously on the Spatial Edge, SAR (Synthetic Aperture Radar) satellites can capture images regardless of weather or time of day. Optical satellites like Sentinel-2 (S2) provide colourful images but struggle with clouds or bad weather. So the perennial question that has been asked is: can we convert SAR images into optical images?
A recent paper by folks from the University of St. Gallen is the latest study to test this idea. In short, they explore whether diffusion models can reliably translate SAR images (from Sentinel-1) into RGB (colour) images that resemble Sentinel-2 data.
How did they do it?
The researchers tested two approaches:
Standard Diffusion: The model gradually adds and removes noise to generate colour images from SAR inputs.
They tested this with and without giving the model extra hints (i.e. “class conditioning”) about land cover types (like forests or lakes).
Cold Diffusion: Instead of using noise, this method blends SAR and optical images directly, then gradually removes the SAR influence.
Did it work?
The results were mixed.
When evaluated purely on visual quality, images generated using diffusion models lacked key details and realism compared to actual Sentinel-2 images. Cold Diffusion images were especially blurry and lacked accurate textures and colours.
However, when tested on practical applications like land cover classification, the generated images did slightly outperform using SAR alone. But even the best-generated images still fell noticeably short of real optical imagery:
Using original SAR imagery alone provided around 67% accuracy.
Real optical (RGB) images achieved about 77% accuracy.
Synthetic RGB images from diffusion models achieved around 69% accuracy (with class conditioning) at best, only a marginal improvement over SAR alone, and clearly below actual optical data.
In terms of cloud removal, while their method showed competitive results against some specialised techniques, the images produced were still visibly less accurate and detailed than dedicated cloud-removal methods. Importantly, this was despite the method not being specifically optimised for cloud removal, raising doubts about how consistently reliable these results could be.
The takeaway:
The research is interesting, but it highlights some of the ongoing challenges of translating radar data into optical images. Diffusion models aren’t yet capable of generating images that are truly reliable or practically valuable for detailed analytical tasks. Improvements might be possible with more sophisticated approaches, but currently, I think these generated images serve only as rough approximations and probably not something you’d confidently base important analyses on.
3. Can foundation models handle ecological mapping?

As I’m sure you all know, deriving insights from satellite images on stuff like vegetation health, carbon stocks or water content, can be tricky. Typically, this requires models built from scratch for each specific task. But **a recent paper introduces SatelliteCalculator, a foundation model designed specifically for turning satellite imagery into quantitative ecological estimates.**
SatelliteCalculator takes Sentinel-2 satellite images and estimates eight different ecological indicators like vegetation health (NDVI, EVI), biomass, canopy height, and carbon stocks, all at once.
Here’s how it works:
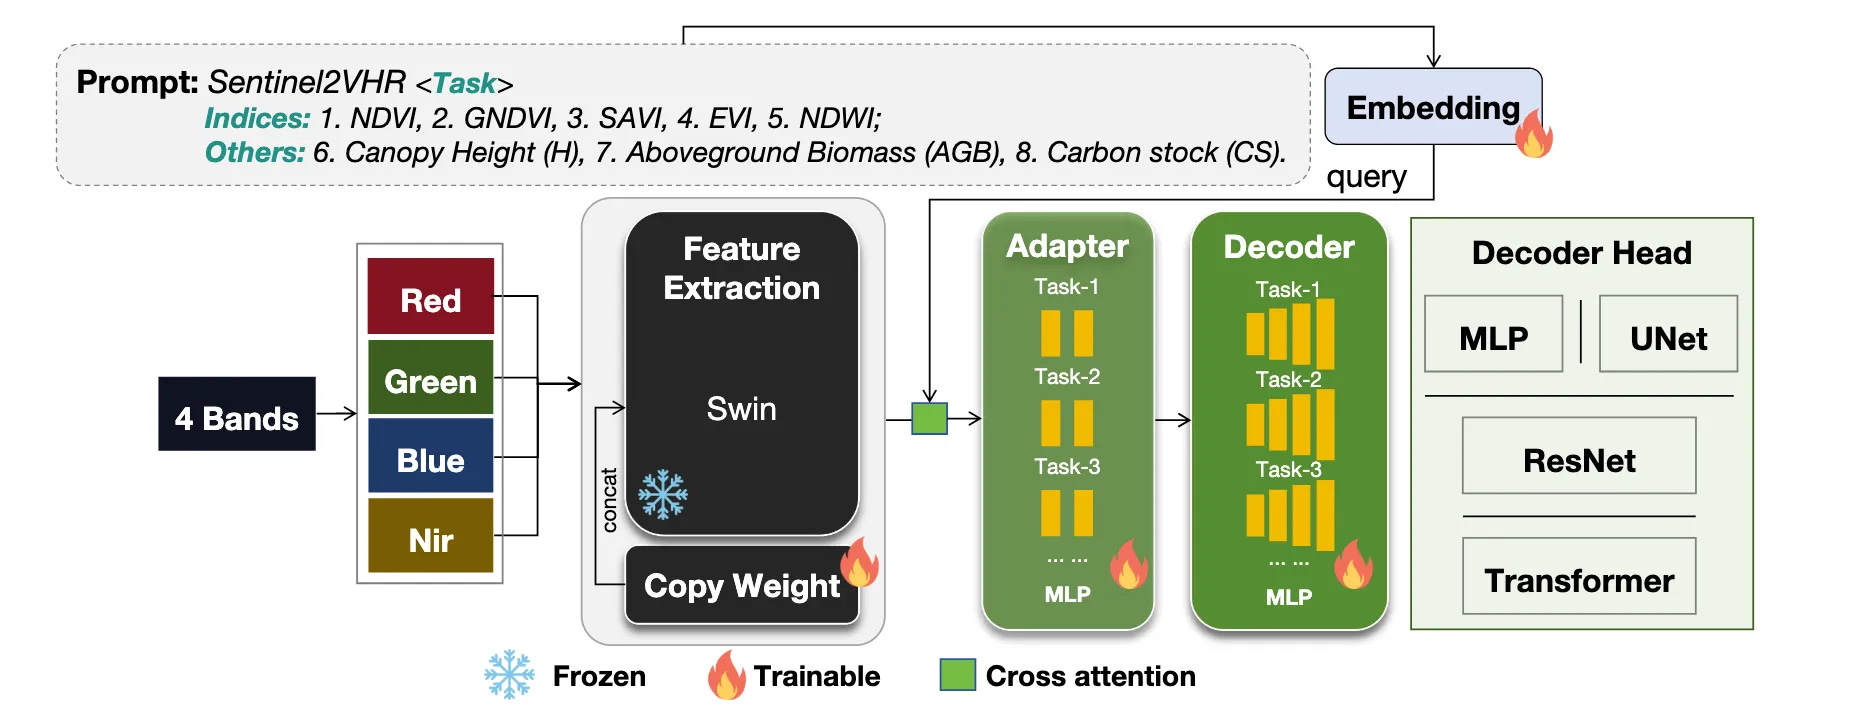
First, it uses a pre-trained Swin Transformer as a backbone, which extracts basic visual features from the satellite images. On top of that, the model uses “cross-attentive adapters,” which basically help the model focus specifically on each ecological indicator separately. Finally, a simple decoder translates these focused features into usable maps.
How good is it?
SatelliteCalculator performed well on the “Open-Canopy” dataset (covering large areas in France), achieving strong results across a bunch of tasks like vegetation indices and canopy height. Spectral indices (like NDVI) were particularly accurate, which makes sense given they’re directly related to the satellite’s measured bands. But predictions for biomass and carbon stocks weren’t as sharp, which indicates there’s still plenty of room to improve.
What makes this promising, though, is its efficiency. By reusing a general visual backbone and adding simple task-specific tweaks, SatelliteCalculator can quickly adapt to new tasks without starting from scratch each time.
In any case, while it performs solidly, it won’t replace detailed ground measurements anytime soon. But it offers a flexible, scalable starting point, which can be useful if you’re trying to quickly map large regions or estimate ecological variables where detailed measurements are sparse.
You can check out the code here.
Geospatial Datasets
1. Subnational crop data

HarvestStat Africa is the largest open-access dataset of harmonised subnational crop statistics for Sub-Saharan Africa. It spans 33 countries and covers 94 crop types from 1980–2022. You can use it to analyse food systems, conduct yield forecasting, and track climate impacts. You can access the data here and the code here.
2. COP-GEN-Beta AI model
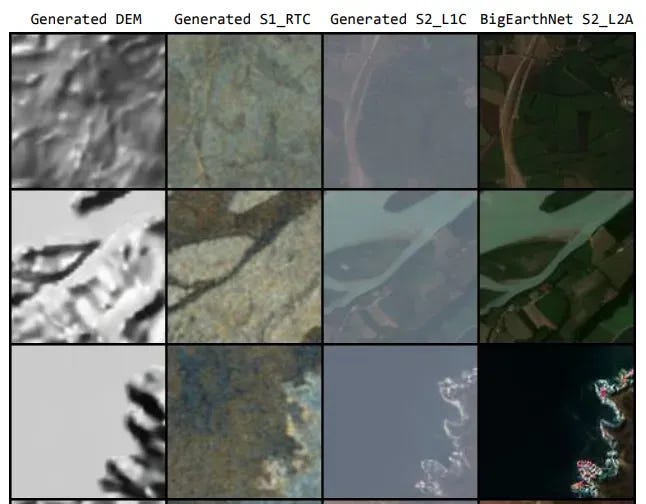
COP-GEN-Beta is a generative diffusion model that learns from optical, radar, and elevation data to produce high-quality images across different sensor types in remote sensing. Unlike earlier methods that rely on one or two data types, it can translate between any combination of sensor inputs, even ones it hasn’t seen before, using a sequence-based diffusion transformer with separate timestep embeddings for each type. Trained on the Major TOM dataset, it shows strong performance in generating accurate cross-sensor images. You can access the code here.
Other useful bits

Meta researchers have released a global map of migration flows built from anonymised platform data, helping fill gaps left by incomplete government records. The data reveals that about 0.3% of the world’s population migrates internationally each year, often following stepwise “ladder” routes and shifting rapidly in response to policy changes. It shows migration dipped during COVID but has rebounded, with clear pathways emerging from lower- to higher-income countries.
Docling is a new toolkit for parsing documents across formats like PDFs, DOCX, HTML, and images, with advanced layout and table extraction. It supports local execution, integrates easily with agentic AI frameworks like LangChain and Haystack, and includes early support for visual language models.
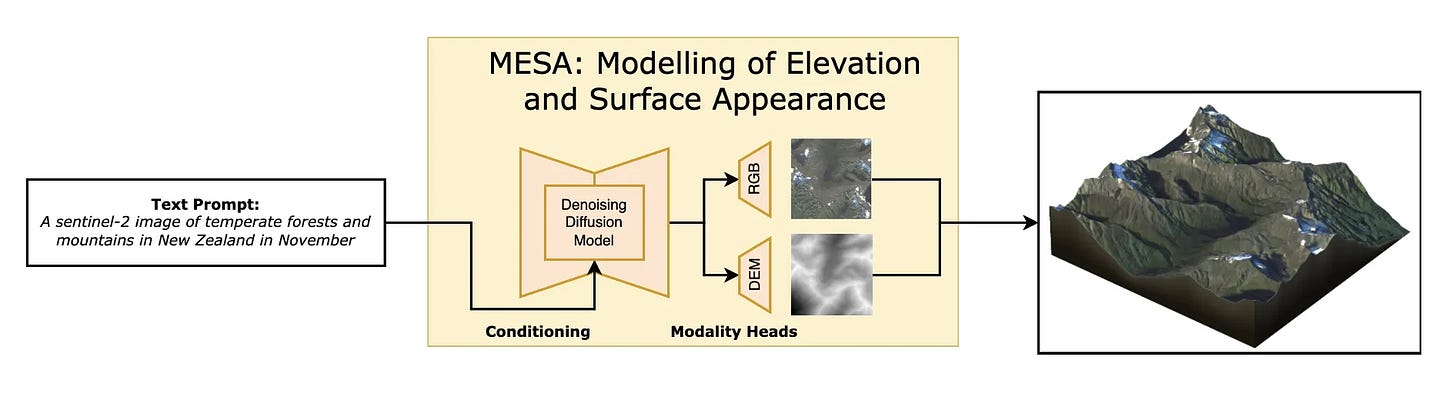

MESA is a new text-to-terrain model that generates realistic 2.5D landscapes (co-registered RGB and depth maps) from natural language prompts. Built on global Copernicus data and a modified Stable Diffusion 2.1 architecture, it offers a scalable, data-driven alternative to procedural terrain modelling, which can be used for VFX, games, and simulation.
Some changes are coming to QGIS: it's migrating to Qt6 and launching QGIS 4.0 in October 2025. This under-the-hood upgrade brings better performance, long-term maintainability, and a few more modern features.
Jobs
WWF is looking for a (1) Projects Coordination and GIS Support Graduate Intern and (2) Enterprise Geospatial Undergraduate Intern in Washington, DC.
IAEA is looking for an Intern who will work as a Building Information Modelling (BIM) - Digital 3D Infographics/Modeller in Vienna.
Sylvera is looking for a Geospatial Data Scientist (Intern) under their Applied Solutions Team in London.
Wing Aviation is looking for a remote Geospatial Data Analyst to join their Flight Operations Geospatial Team.
Mapbox is looking to fill several positions:
Mapbox Germany: (1) Senior Software Development Engineer, Big Data and (2) Principal Software Development Engineer, Navigation
Mapbox US: (1) Engineering Manager, Guidance and (2) Principal Software Development Engineer, Navigation
Just for Fun

Italy’s IRIDE mission just shared its first image: a pretty crisp 2.66 m shot of Rome. This kicks off the country’s ambitious €1.1 billion Earth observation programme, where they’re aiming to launch over 60 satellites by 2026.
That’s it for this week.
I’m always keen to hear from you, so please let me know if you have:
new geospatial datasets
newly published papers
geospatial job opportunities
and I’ll do my best to showcase them here.
Yohan