

🌐 We’re missing a lot of black carbon
PLUS: New nightlights dataset, identifying rural tourism sites and more.

Hey guys, here’s this week’s edition of the Spatial Edge. If you’re the type of person who uses the Raster package on R, then fear not. We’re here to save you. With bold statements like these, our aim is to make you a better geospatial data scientist in less than five minutes a week.
In today’s newsletter:
Black Carbon: Global models miss emissions in the South.
Night Lights: VIIRS data extended back to 1986.
Tourism Villages: GIS shows Sichuan’s “Six Cores” clusters.
Conflict Forecasts: Machine learning predicts refugee displacement flows.
Oil Spills: 3,550 incidents compiled into global dataset.
Research you should know about
1. How black carbon is underestimated in the Global South

Black carbon, produced by incomplete combustion, is a major pollutant with serious climate and health impacts. But how well do our global emission inventories capture it? Using thousands of ground measurements from the SPARTAN network and other sources, a new paper in Nature Communications compared observed black carbon levels with simulations from widely used models. They then ran high-resolution simulations with the GEOS-Chem (a global atmospheric model), linking emissions from inventories to observed ground-level concentrations at a spatial scale of around 25 km.
The results show good consistency between simulations and measurements in developed regions such as the US, Canada, and Europe (r² = 0.73). But in the Global South, the match was almost non-existent (r² = 0.00019). Simulations based on the widely used CEDS inventory underestimated black carbon by about 38% in cities such as Dhaka, Addis Ababa, and Kanpur. Even when using other global inventories like EDGAR and HTAP, the same pattern remained, with major hotspots across South Asia and sub-Saharan Africa missing from the models.
The discrepancy comes from the difficulty of capturing emissions from informal and inefficient sources, such as household cooking with wood or charcoal, open waste burning, poorly regulated kilns, and widespread diesel use in places with unreliable electricity. These activities are often invisible to standard data collection, yet they dominate black carbon output in many low- and middle-income countries. I suppose the findings demonstrate the value of globally distributed networks like SPARTAN, combined with fine-resolution modelling, for closing these gaps and improving estimates of pollutants that matter for both climate and public health.
2. A new way to identify rural tourism sites

A new study examines the 396 officially recognised traditional villages across Sichuan and assesses which ones are best suited for tourism development. Using kernel density estimation and nearest neighbour analysis, the authors found a “Six Cores and Five Belts” pattern, where clusters of villages form in certain areas such as the Chengdu Plain and southern Sichuan. At the same time, places like northwest Sichuan and the Panxi region emerged as “cold spots” with far weaker tourism potential.
To quantify location potential, the team constructed an evaluation system of 25 indicators grouped into five dimensions: natural environment, location and transport, socio-economics, tourism market, and policy support. Data sources included remote sensing products from Google Earth Engine, transport networks from OpenStreetMap, socio-economic data from the Sichuan Statistical Yearbook, and planning documents on cultural corridors and demonstration zones. Indicator weights were calculated using the entropy weight method, and a weighted summation produced composite scores for each village. They found that high-potential sites are concentrated in the Sichuan Basin, medium-potential ones appear on the basin’s edges and in central Ganzi Prefecture, and low-potential ones are concentrated in more remote mountain areas.
The analysis also showed how tourism potential is spatially linked. High-value villages cluster together and exert “gravity” on nearby ones, suggesting that focusing on core clusters could deliver wider spillovers. The authors recommend different strategies depending on whether villages are tourism-, resource-, ecology-, or transport-oriented. Beyond Sichuan, the framework offers a useful way to evaluate and plan tourism in traditional villages elsewhere.
You can access the dataset here.
3. Forecasting conflict-driven migration with machine learning

Humanitarian planners often struggle to predict where people will flee when violence breaks out. This paper, published in Scientific Reports, takes a fresh approach by combining machine learning with an agent-based model. The study combines a Random Forest classifier, trained on detailed spatial data, with the Flee agent-based model (ABM) that simulates refugee and internally displaced person movements. The conflict forecasts draw on ACLED event data and PRIO-GRID covariates such as terrain, GDP per capita, and population density, allowing predictions at the daily level and for specific localities over several years. This makes the approach much more granular than traditional country-level statistical models.
The machine learning component generates conflict predictions, which are then fed into the Flee ABM. This model essentially represents individuals as agents moving through networks of locations, routes, and camps. Together, the system creates displacement forecasts without requiring manual conflict estimates in advance. The method was tested on four African conflicts (Mali 2012, Burundi 2015, South Sudan 2013, and the Central African Republic 2013), comparing predicted refugee flows against observed UNHCR data.
Results showed that the hybrid approach matched or outperformed the original Flee model that relies on recorded conflict data. Accuracy was measured using the Average Relative Difference metric, with forecasts in most cases falling within 70–75% of actual displacement patterns. This suggests the combination of geospatially trained machine learning and ABM can produce reliable forecasts even where ground truth conflict data is missing, offering a more practical tool for humanitarian planning.
You can access the data and code here.
4. Extending VIIRS night-time lights back to the 1980s
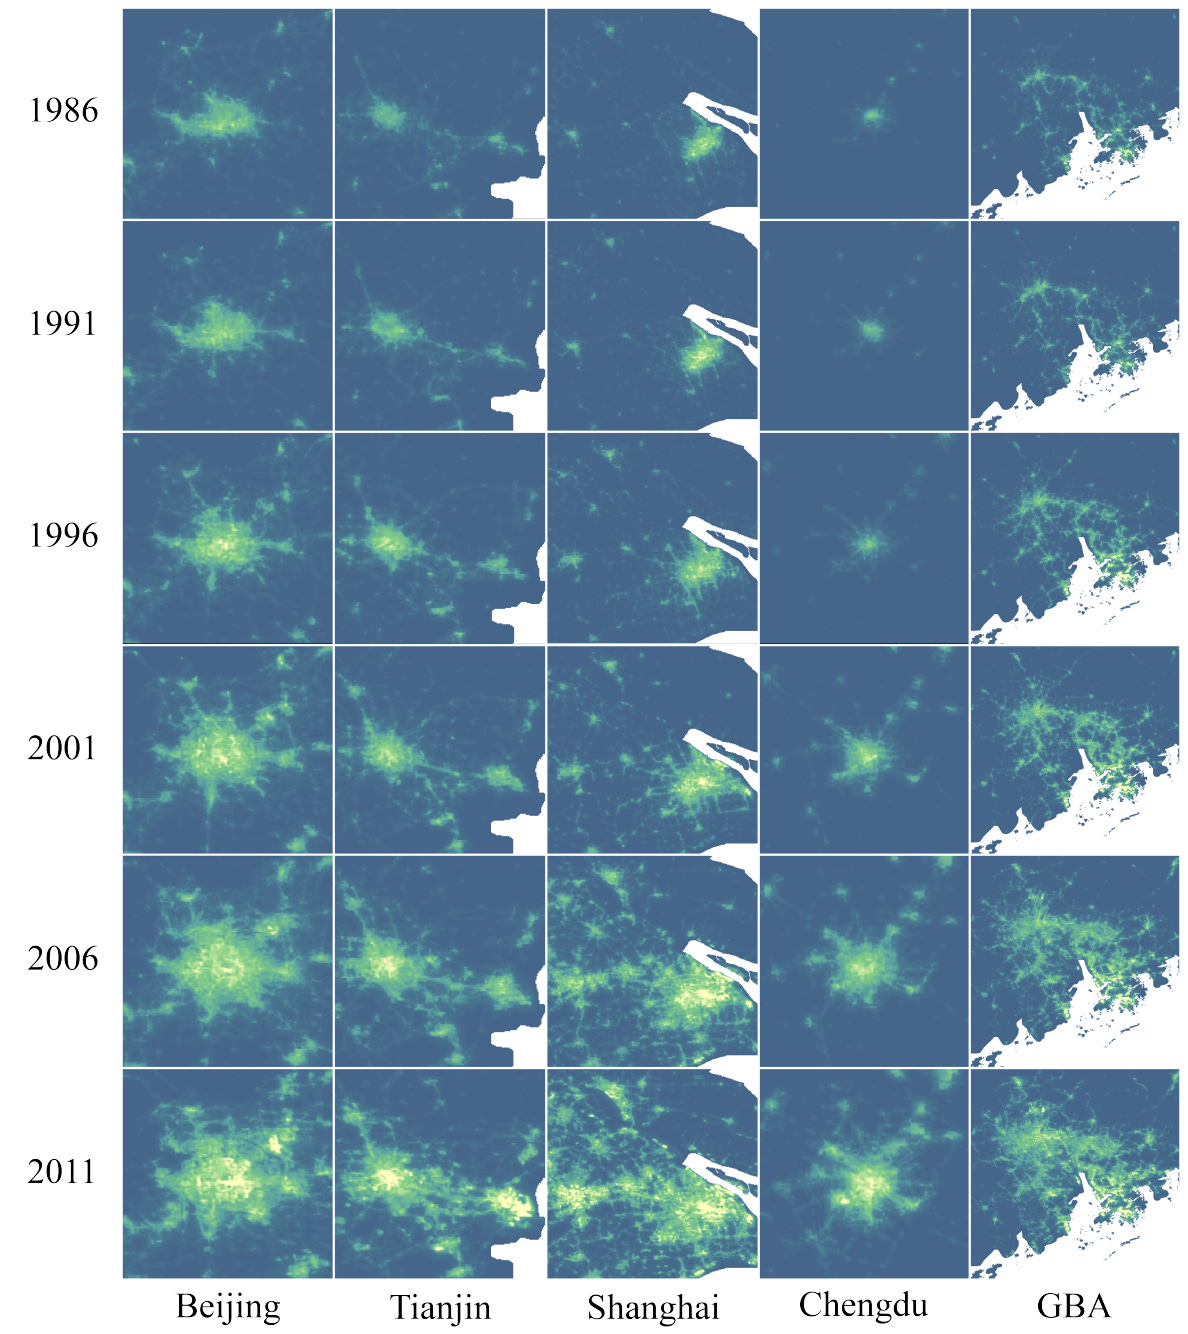
Researchers have built a new dataset called EVAL, which reconstructs VIIRS-like night-time light imagery for China all the way back to 1986. The challenge they tackled is that while VIIRS provides high-quality light data, it only starts in 2012, and older DMSP-OLS data is coarser and suffers from saturation and calibration issues. The team used a deep learning framework with two novel modules: (1) a Hierarchical Fusion Decoder to improve reconstruction and (2) a Dual Feature Refiner that uses high-resolution impervious surface masks to capture roads and fine urban structure.
The result is a long, continuous, 500-metre resolution dataset that performs much better than existing products. In tests, EVAL reduced error rates and preserved detail in both bright city centres and rural road networks, avoiding the systematic underestimation seen in older datasets. Importantly, it also shows strong correlations with socioeconomic data like GDP and population, which makes it highly reliable for long-term human activity studies.
You can access the data here.
Geospatial Datasets
1. Global oil spill dataset

The enhanced global oil spill dataset compiles 3,550 incidents from 1967–2023, adding verified actual release amounts extracted from NOAA’s text-based incident records. You can access the data and code here.
2. Population estimates in fluvial areas

FloodPop is a new high-resolution dataset estimating how many people and housing units in the contiguous US are located in fluvial or coastal flood hazard areas. By combining 2020 Census block data with classified residential building footprints and FEMA/EPA flood maps, it provides more precise estimates than previous studies. You can access the data here and the code here.
3. 30-m Landsat dataset
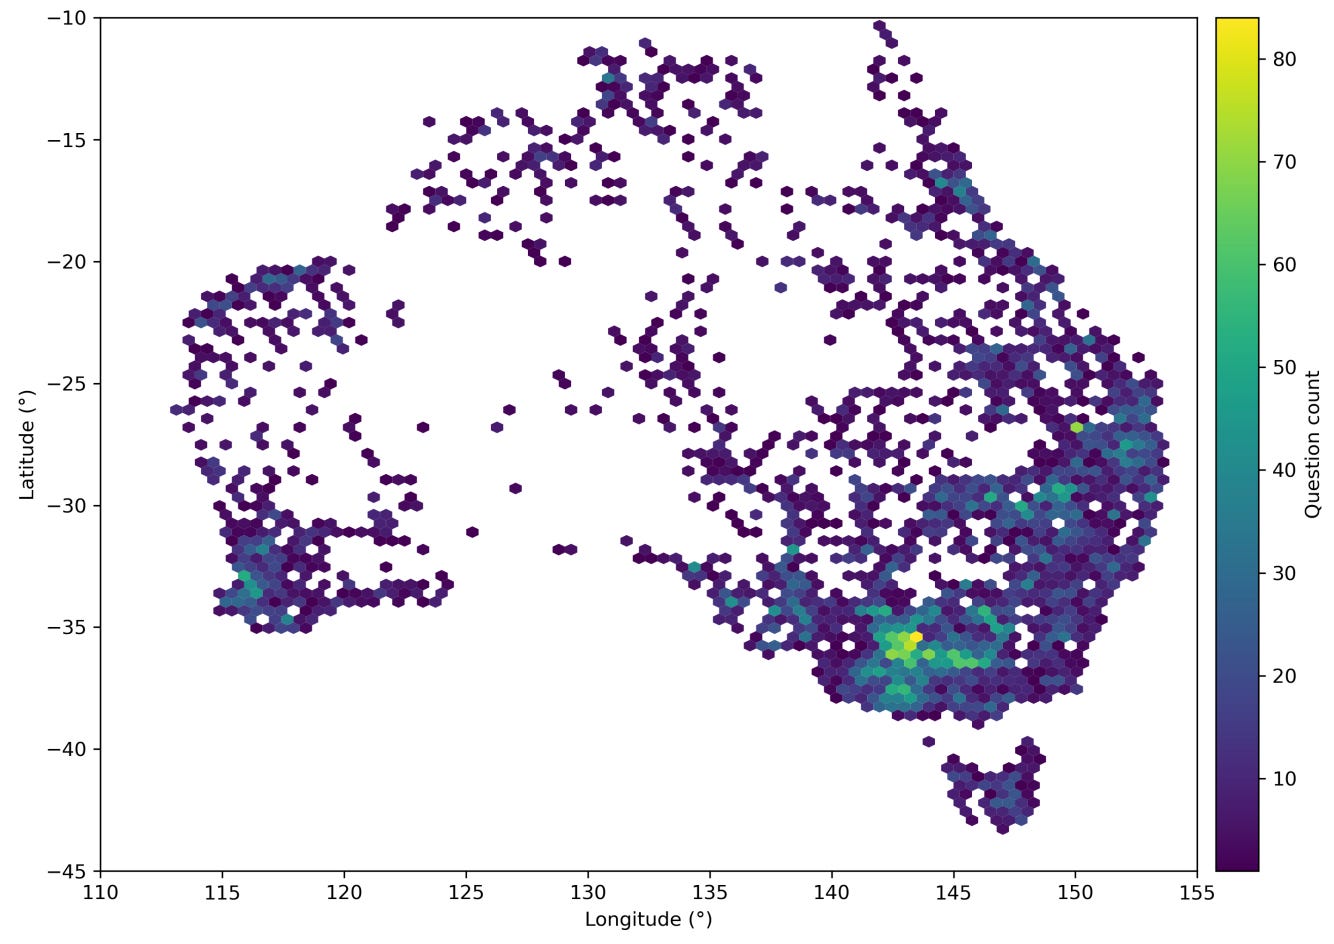
Landsat30-AU is a new large-scale vision-language dataset built from 36 years of Landsat 5, 7, 8, and 9 imagery over Australia at 30 m resolution. It includes 196,000 image–captions pairs (Landsat30-AU-Cap) and 17,700 human-verified VQA samples (Landsat30-AU-VQA) across eight reasoning tasks. You can access the data and code here.
4. High-res soil nutrient maps

These baseline high-res maps of phosphorus and potassium in Morocco provide the first national view of soil nutrient availability at 250 m resolution. You can access the data and code here.
Other useful bits
Meta’s DINOv3 takes self-supervised learning for images to a whole new scale, delivering state-of-the-art performance across tasks from satellite monitoring to healthcare without the need for labelled data. With open-sourced backbones, including one trained on MAXAR imagery, it’s already helping groups like WRI track deforestation and support climate action.
A community-made Planet MCP server is showing real promise in making everyday GIS workflows easier with natural language prompts. In early tests, it pulled Planet Feature Collections straight into QGIS via Claude Desktop alongside the QGIS MCP Server.
NOAA, NASA, and Brightband have released NNJA-AI v1, an AI-ready reformatting of decades of global atmosphere, ocean, ice, and land observations. By converting legacy data into modern formats like Parquet, the archive makes it far easier to use for AI training, reanalysis, and large-scale Earth system research.
NISAR, a joint NASA–ISRO mission, has successfully unfurled its massive 12-metre radar antenna reflector in orbit (NASA’s largest ever). The satellite will soon begin delivering high-resolution data to track Earth’s changing surface, from glaciers and forests to earthquakes and farmland.
Jobs
ESA is looking for an EO Systems Engineer based in Frascati.
UN Global Service Centre (UNGSC) is looking for a Geospatial Information Officer based in Valencia.
UNEP is looking for a CCAC National Expert in Silvopastoral Systems and Spatial Analysis based in Paris.
Nature Conservancy is looking for a (1) SNAPP Research Fellow: Future Tidal Wetlands based in Alabama and a (2) Coral Restoration Technician based in Hawaii.
Just for Fun

NASA’s Perseverance rover has captured one of its sharpest panoramas yet on Mars, stitching together 96 images from the “Falbreen” site into a stunning 360-degree view. The mosaic shows stuff like float rocks, ancient terrain, and distant hills up to 65 km away, offering fresh insights into the Red Planet’s geology.
That’s it for this week.
I’m always keen to hear from you, so please let me know if you have:
new geospatial datasets
newly published papers
geospatial job opportunities
and I’ll do my best to showcase them here.
Yohan